 Multi-family
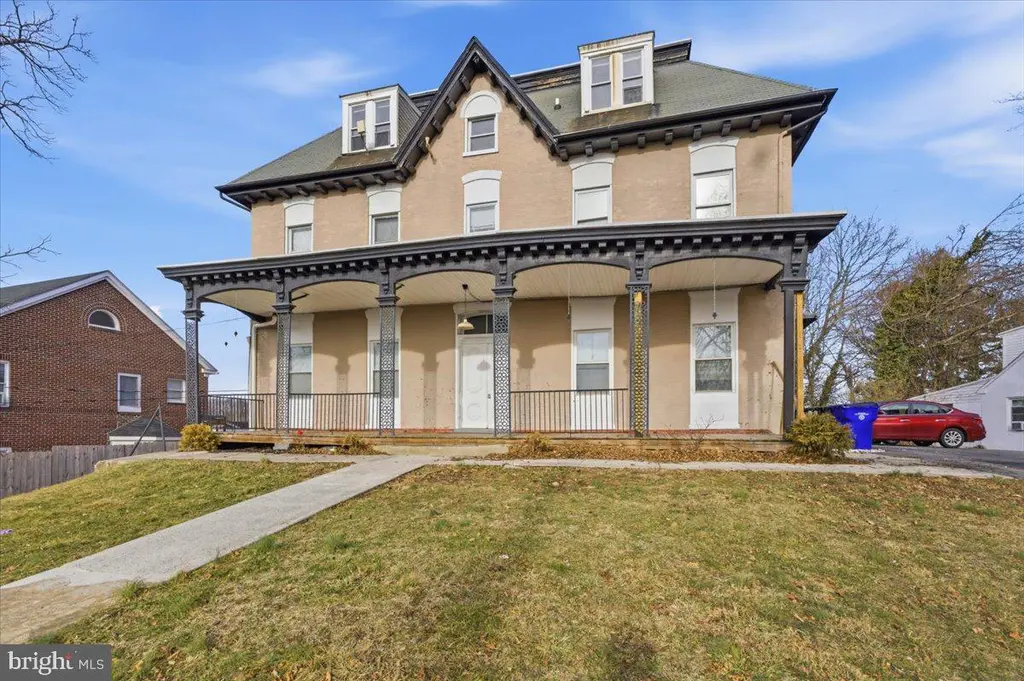
671 Highland Way · Hagerstown, MD
Flood risk 1/10 · Minimal
- FEMA flood zone
- X (unshaded)
- Chance of flooding over 30 yrs
- 0.0%
- Est. flood insurance / yr
- $473 – $860
Fire risk 1/10 · Minimal
- Est. fire insurance / yr
- $755 – $1,403
Heat risk 5/10 · Moderate
- Hot days now (above 101°F)
- 7 days/yr
- Hot days in 30 yrs
- 16 days/yr
Wind risk 2/10 · Minimal
- Chance of severe wind over 30 yrs
- 2.0%
Air-quality risk 2/10 · Minimal
- Unhealthy air days now
- 1 days/yr
- Unhealthy air days in 30 yrs
- 2 days/yr
Risk factors via First Street. Map © Google.
Why this score? — see what drove the B- grade
The composite is a weighted blend of 9 inputs, each scored 0–100. Each bar is that input's sub-score; the figure is the points it added to the 100-point composite (weight × sub-score).
- Cash flow +30.0/30.0
- DSCR +10.0/10.0
- 1% rule +9.2/10.0
- ARV discount +7.5/15.0
- Livability +3.9/5.0
- Rent growth +3.5/5.0
- Condition / age +2.5/5.0
- Schools +2.3/10.0
- Appreciation +0.0/10.0
$574,900
🖨 Deal sheet 📄 Offer letter ✓ Due diligence
Multi-family units
County records classify this as Multi-Family (5+ Unit). Listing-text estimate: 1 unit. estimate disagrees with records
5+ unit building — per-unit beds/baths from public records are typically unavailable; the breakdown below (if shown) is an estimate from the listing text.
Listing remarks MLS
Great Location walking distance to the Beautiful Hagerstown City Park! Ok FIVE (5) Units fully Rented! New Rear steps being installed now. 9% CAP RATE, same owner for years. All leases are yearly except one is month to month. Call for more details and to schedule a tour!
Key facts
- 0.58 acre lot
- 10 parking spots
- Built 1900
Neighborhood map
What this means for you Summary
Snapshot
- This is a 8-bed/?-bath multifamily listed at $575k.
Deal economics
- At list price, monthly cash flow is $3k ($36k/yr) — positive.
- The deal already cash-flows at list — no discount required.
- Meets the 1% rule at list price ($8k rent vs $575k).
- Recommended offer: $506k (12.0% below list) — sets the bar for market timing.
- Cap rate 12.5% vs local median 4.4% in Hagerstown — top-decile yield for the area; either an underpriced asset or a hidden risk that comps aren't pricing in. Stress-test before assuming the spread holds.
Location & tenants
- Location reads 77/100 on livability (#83 in MD, #3,170 nationally) — a middle-class / working-renter tenant base. Strengths: commute A+, cost of living A+, health & safety A+; Watch: schools C-, crime F, employment F.
- Washingtion County Public Schools (suburban): math 18% / reading 33% proficiency, ranked #13 of 24 in MD (top 54%) — low school quality limits family demand, transient renter base, plan for 1-2y turnover.
- Market conditions: Rents rising fast (+4.0%/yr); 368 active listings in the ZIP; 232 units permitted in Washington County in 2024 (12 in 5+ unit buildings).
- At $8,142/mo this rent would consume 155% of the median local household income ($63k/yr) (locally 2832% of renters already pay >50% of income on rent) — very limited rent-growth headroom before tenants either downsize or default.
Forward outlook
- Local home prices are declining (-3.0%/yr); year-one equity from $4k of loan paydown is wiped out by about $17k of value loss. Plan a longer hold.
- At projected returns (-3.0% appreciation + 4.0% rent growth), your $161k cash investment doubles in ~6 years — after that, you're playing with house money.
Negotiation context
- It's been on market 142 days — a 12% lower offer ($506k) is reasonable based on typical stale-listing flexibility.
- 17 sale attempts since 31y ago; this cycle's ask has dropped $74k (11%) from the opening price — seller is motivated, your offer sets the floor, not the list.
- Current owner paid $185k; list at $575k implies a 211% gain — meaningful room to come down on a strong offer.
Risks & watch-outs
- Watch-outs: built in 1900 — expect roof / HVAC / electrical / plumbing capex.
- Climate carrying-cost: extreme-heat days projected 7→16/yr by 2055 (HVAC capex compounding) — expect insurance premiums to compound above CPI over the hold.
Questions for the listing agent
- It's been on market 142 days. Have you received any prior offers? Is the seller open to a 12% concession, seller financing, or rate buy-down credit?
- Built in 1900 — when were the roof, HVAC, electrical panel, plumbing, and water heater last replaced?
- Why hasn't it sold? Are there any deal-killer items the seller is aware of (foundation, flood, title, zoning, code violations)?
- Is there a deadline driving the sale (1031 exchange, divorce, estate, relocation)? That informs how much negotiation room exists.
- Crime grade is F in this area — have there been break-ins, vandalism, or insurance claims at this property in the last 3 years? What carrier currently insures it and at what premium?
- What's the average days-on-market for RENTAL listings here right now (not sales)? A rising rental-DOM trend means longer vacancies and softer asking-rent achievability than the comps imply.
- What's the recent tenant-quality profile in this submarket — average credit score on applications, eviction rate, late-payment / NSF rate, and stable-employment percentage? A property-management company in the area should have these aggregated.
- How much new apartment / multifamily construction is in the pipeline within 1–3 miles? Heavy new supply (>2% of stock underway) typically softens rents 12–24 months out; light construction supports rent growth.
Investment metrics
- 1% rule
- 1.42% ✓
- Cap rate
- 12.53%
- Cash-on-cash
- 22.27%
- DSCR
- 1.99
- GRM
- 5.9
CMA / ARV
- ARV (median comp)
- $345,492
- List price
- $574,900
- Delta
- 66.40%
- Verdict
- OVERPRICED
- Comps
- 8 within 1.0 mi
Show comp detail 1 sale within ~0.75 mi
| Address | Dist | Beds/Ba | Sqft | Sold | Price | $/sf | Match |
|---|---|---|---|---|---|---|---|
| 518 Reynolds Ave | 0.46mi | 9/— (+1) | 6,528 (+13%) | 9mo | $680,000 | $104 | 44 |
Match score weights: distance 35% · size 25% · config 20% · recency 20%. Top-matched comps best support the ARV.
Projected returns pro-forma
-3.0% appreciation · 4.0% rent growth · sell at horizon
- IRR
- 16.1%
- Equity multiple
- 1.65×
- Total profit
- $105,149
- Equity at exit
- $85,719
- IRR
- 25.3%
- Equity multiple
- 3.30×
- Total profit
- $370,350
- Equity at exit
- $49,707
Cash invested: $160,972 (down + closing). Projections, not guarantees.
Landlord ↔ Tenant lean methodology
- Overall (STATE)
- 27 Tenant-Leaning
- State Maryland
- 27 Tenant-Leaning · D+14
- County
- — inherits STATE
- City
- — inherits STATE
ZIP-level market 21740
- Rents YoY
- 4.0%
- Active inventory
- 368
- Price-to-rent
- 29.4×
Monthly cashflow live
- Estimated rent
- $8,142 high interval (Pro) →
- Mortgage (P&I)
- −$3,015
- Tax from tax record
- −$191 /mo · $2,291/yr
- Insurance
- −$240
- HOA
- −$0
- Vacancy / Maint / Mgmt
- −$1,710
- Net cashflow
- $2,987
Break-even live
5-unit breakdown (identical units grouped — click to expand)
| Units | Beds | Baths | Est. rent |
|---|---|---|---|
| 5× units | 3 | 1 | $8,140 |
| #1 | 3 | 1 | $1,628 |
| #2 | 3 | 1 | $1,628 |
| #3 | 3 | 1 | $1,628 |
| #4 | 3 | 1 | $1,628 |
| #5 | 3 | 1 | $1,628 |
| Total (5 units) | $8,142 | ||
UW: 25.0% down · 7.5% · 30yr · 1.5% tax · 5.0% vac · 8.0% maint · 8.0% mgmt
Financing live
Cash to close
- Down payment
- $143,725
- Closing costs
- $17,247
- Reserves months
- —
- Total cash needed
- —
Loan-product check · same deal, 3 products live
Conventional
25% down · 7.5% · 30yr
- Down + closing
- —
- Monthly P&I
- —
- Monthly cashflow
- —
- DSCR
- —
- Eligible?
- —
Personal DTI + credit; lowest rate.
DSCR
20% down · 8.5% · 30yr
- Down + closing
- —
- Monthly P&I
- —
- Monthly cashflow
- —
- DSCR
- —
- Eligible?
- —
No personal income docs; deal must DSCR.
Hard money
10% down · 12.0% · 12mo
- Down + closing
- —
- Monthly P&I
- —
- Monthly cashflow
- —
- DSCR
- —
- Eligible?
- —
Short-term bridge; refi at stabilization.
Listing history 50 events
-
2026-06-18days on market $574,900 Active 142 DOM
-
2026-06-17days on market $574,900 Active 141 DOM
-
2026-06-16days on market $574,900 Active 140 DOM
-
2026-06-15days on market $574,900 Active 139 DOM
-
2026-06-14days on market $574,900 Active 137 DOM
-
2026-06-13days on market $574,900 Active 136 DOM
-
2026-06-10days on market $574,900 Active 134 DOM
-
2026-06-09days on market $574,900 Active 133 DOM
-
2026-06-08days on market $574,900 Active 132 DOM
-
2026-06-07days on market $574,900 Active 131 DOM
-
2026-06-03days on market $574,900 Active 127 DOM
-
2026-06-02days on market $574,900 Active 126 DOM
-
2026-06-01days on market $574,900 Active 125 DOM
-
2026-05-31days on market $574,900 Active 124 DOM
-
2026-05-30days on market $574,900 Active 123 DOM
-
2026-04-12price $574,900 273-char remark
Show marketing remark (273 chars)
Great Location walking distance to the Beautiful Hagerstown City Park! Ok FIVE (5) Units fully Rented! New Rear steps being installed now. 9% CAP RATE, same owner for years. All leases are yearly except one is month to month. Call for more details and to schedule a tour!
-
2026-04-12status Active 273-char remark
Show marketing remark (273 chars)
Great Location walking distance to the Beautiful Hagerstown City Park! Ok FIVE (5) Units fully Rented! New Rear steps being installed now. 9% CAP RATE, same owner for years. All leases are yearly except one is month to month. Call for more details and to schedule a tour!
-
2026-04-10historical 273-char remark
Show marketing remark (273 chars)
Great Location walking distance to the Beautiful Hagerstown City Park! Ok FIVE (5) Units fully Rented! New Rear steps being installed now. 9% CAP RATE, same owner for years. All leases are yearly except one is month to month. Call for more details and to schedule a tour!
-
2026-01-26$649,000 Active 273-char remark
Show marketing remark (273 chars)
Great Location walking distance to the Beautiful Hagerstown City Park! Ok FIVE (5) Units fully Rented! New Rear steps being installed now. 9% CAP RATE, same owner for years. All leases are yearly except one is month to month. Call for more details and to schedule a tour!
-
2026-01-15historical $649,000 273-char remark
Show marketing remark (273 chars)
Great Location walking distance to the Beautiful Hagerstown City Park! Ok FIVE (5) Units fully Rented! New Rear steps being installed now. 9% CAP RATE, same owner for years. All leases are yearly except one is month to month. Call for more details and to schedule a tour!
-
2019-07-08soldstatus $185,000
-
2011-04-22soldstatus $245,000
-
2011-04-08soldstatus $245,000 Sold 291-char remark
Show marketing remark (291 chars)
Walk to City Park! Nice all brick apartment building * 5 Units - Half acre lot * plenty of Off Street parking * Heat is electric which is separately metered * Replacement windows on 2nd & 3rd floors - original windows w/ storm windows on 1st flor. Good investment opportunity.
-
2011-04-08soldstatus $245,000
Show marketing remark (291 chars)
Walk to City Park! Nice all brick apartment building * 5 Units - Half acre lot * plenty of Off Street parking * Heat is electric which is separately metered * Replacement windows on 2nd & 3rd floors - original windows w/ storm windows on 1st flor. Good investment opportunity.
-
2011-02-24status Contingent (No Kick Out) 291-char remark
Show marketing remark (291 chars)
Walk to City Park! Nice all brick apartment building * 5 Units - Half acre lot * plenty of Off Street parking * Heat is electric which is separately metered * Replacement windows on 2nd & 3rd floors - original windows w/ storm windows on 1st flor. Good investment opportunity.
-
2011-02-24historical
Show marketing remark (291 chars)
Walk to City Park! Nice all brick apartment building * 5 Units - Half acre lot * plenty of Off Street parking * Heat is electric which is separately metered * Replacement windows on 2nd & 3rd floors - original windows w/ storm windows on 1st flor. Good investment opportunity.
-
2010-11-22$274,900 Active 291-char remark
Show marketing remark (291 chars)
Walk to City Park! Nice all brick apartment building * 5 Units - Half acre lot * plenty of Off Street parking * Heat is electric which is separately metered * Replacement windows on 2nd & 3rd floors - original windows w/ storm windows on 1st flor. Good investment opportunity.
-
2010-11-22$274,900
Show marketing remark (291 chars)
Walk to City Park! Nice all brick apartment building * 5 Units - Half acre lot * plenty of Off Street parking * Heat is electric which is separately metered * Replacement windows on 2nd & 3rd floors - original windows w/ storm windows on 1st flor. Good investment opportunity.
-
2010-06-15historical Withdrawn
-
2009-08-17price
-
2009-07-09Active
-
2009-07-01historical
-
2009-07-01historical
-
2009-04-14historical
-
2009-04-10price
-
2009-04-05
-
2009-04-04$279,000
-
2009-03-25
-
2009-01-09historical
-
2009-01-09price
-
2009-01-09status
-
2009-01-02historical
-
2008-06-24
-
2008-04-17historical
-
2005-06-09
-
2003-04-22historical
-
2002-12-02
-
2002-10-04historical
-
2002-08-21
-
1998-07-07soldstatus $147,000
ⓘ Source: listings_history table (triggers on properties + properties_extension) + one-shot
backfill from property_details.listing_events for pre-trigger history.
Tax reassessment forecast MD · Partial reset (capped growth)
- Current annual tax
- $2,291 · $191/mo
- Projected year-2 tax
- $4,279 · $357/mo
- Expected delta
- +$1,988/yr (+$166/mo · 86.8%)
ⓘ Screening estimate from a state-policy table — verify with the county assessor before closing.
Climate risk First Street
- Flood 1/10 Low FEMA zone X (unshaded) · 0% chance over 30 yrs
- Wildfire 1/10 Low
- Heat 5/10 Major 7 d/yr ≥101°F today · 16 d/yr by 30 yrs out
- Wind 2/10 Low 2% chance of damaging wind over 30 yrs
- Air quality 2/10 Low 1 unhealthy d/yr today · 2 by 30 yrs out
Nearby sold comps map
Loading sold comps map…
Walkable amenities ~0.75 mi
Loading nearby amenities…
Taxation est. · year 1
- Rental income
- $97,704
- − Mortgage interest
- −$32,203
- − Property taxes
- −$2,291
- − Insurance
- −$2,874
- − Repairs & maintenance
- −$7,816
- − Management
- −$7,816
- − Depreciation
- −$16,724
- Taxable income
- $27,978
- Est. tax owed @ 24.0%
- −$6,715
- After-tax cash flow
- $29,128/yr
For passive investors: Depreciation is non-cash, so a rental often shows a tax loss while cash-flowing — sheltering income. Rental losses are passive: they offset passive income freely, and up to $25,000/yr can offset ordinary (W-2) income if you actively participate and your MAGI is under $100k (phasing out to $0 by $150k); unused losses carry forward. On sale, claimed depreciation is recaptured at up to 25%, and gains may owe capital-gains tax (a 1031 exchange can defer both). Figures are a year-1 estimate at your 24.0% rate — not tax advice; consult a CPA.
Schools (NCES district)
- District
- Washingtion County Public Schools
- NCES district ID
- 2400660
- Math proficiency
- 18% ▼ -20.00%
- Reading proficiency
- 33% ▼ -17.00%
- Median HH income
- $54,784
- Composite
- 22.87/100
- National rank
- #8007
- State rank
- #13 of 24 in MD
Livability — Hagerstown
- Score
- 77/100
- State rank
- #83
- US rank
- #3170
Category grades
Schools grade is shown separately in the Schools card above.
Census & demographics
- Census place
- Hagerstown, MD
- County
- Washington County · 98,861 people
- City population
- 64,792
- Metro
- Hagerstown-Martinsburg, MD-WV
- Population (ZIP)
- 64,792
- Household income
- $62,873
- Rent vs Own
- Severe rent burden
- 2832.0
Population outlook (Washington County) Hauer SSP2
- Today (2025)
- 151,614 people
- By 2030
- 151,455 · -0.1%
- By 2040
- 150,097 · -1.0%
- By 2050
- 148,193 · -2.3%
- By 2075
- 146,581 · -3.3%
- By 2100
- 138,025 · -9.0%
Race, ethnicity, and origin ACS 2023
- Neighborhood character
- Majority White (64%)
- Race & ethnicity
- White 64% Black 18% Two or more races 10% Hispanic / Latino 10% Asian 2%
- Hispanic origin (detail)
- Mexican 2% Puerto Rican 2% Dominican 2%
- Common ancestry
- Romanian 2% Lithuanian 1% Slovak 1%
- Foreign-born
- 9% · Canada, China
- Languages at home
- 86% English-only · Spanish 9% French/Haitian/Cajun 1% Chinese 1%
Political lean MEDSL · Washington
- 2024 margin
- Strong R (+23.0) · D 37.3% · R 60.4% · Other 2.3%
- 2008→2024 swing
- -10.2pp toward R · 2008: -12.9pp · 2024: -23.0pp
- All cycles
- 2024: R+23.0 2020: R+20.9 2016: R+32.4 2012: R+18.5 2008: R+12.9
Not yet ingested
- Civics
- —
Market trends
- HPI YoY
- ▼ -248.38%
- Current HPI
- 264.8018
- Rent YoY
- ▲ 4.00%
- Metro
- Hagerstown-Martinsburg, MD-WV
- State GDP YoY
- ▲ 2.97%
- F500 in state
- 12
Industry mix (Fortune 500 HQ in MD)
| Industry | F500 HQs | Revenue |
|---|---|---|
| Aerospace / Defense | 1 | $71B |
|
||
| Utilities | 1 | $25B |
|
||
| Hotels | 1 | $24B |
|
||
| Consumer Goods | 1 | $7B |
|
||
| Real Estate | 1 | $6B |
|
||
| Chemicals | 1 | $2B |
|
||
Price history
+283.3% since first listed44 events — show timeline
- 2026-04-12 Price Changed $574,900 BRIGHT MLS
- 2026-04-12 Relisted — BRIGHT MLS
- 2026-04-10 Listing Removed — BRIGHT MLS
- 2026-01-26 Listed $649,000 BRIGHT MLS
- 2026-01-15 Coming Soon $649,000 BRIGHT MLS
- 2019-07-08 Sold (Public Records) $185,000 Public Records
- 2011-04-22 Sold (Public Records) $245,000 Public Records
- 2011-04-08 Sold (MLS) $245,000 BRIGHT MLS
- 2011-04-08 Sold (MLS) $245,000 MRIS
- 2011-02-24 Pending — MRIS
- 2011-02-24 Listing Removed — BRIGHT MLS
- 2010-11-22 Listed $274,900 MRIS
- 2010-11-22 Listed $274,900 BRIGHT MLS
- 2010-06-15 Delisted — MRIS
- 2009-08-17 Price Changed — MRIS
- 2009-07-09 Listed — MRIS
- 2009-07-01 Delisted — MRIS
- 2009-07-01 Listing Removed — BRIGHT MLS
- 2009-04-14 Delisted — MRIS
- 2009-04-10 Price Changed — MRIS
- 2009-04-05 Listed — MRIS
- 2009-04-04 Listed $279,000 BRIGHT MLS
- 2009-03-25 Listed — MRIS
- 2009-01-09 Delisted — MRIS
- 2009-01-09 Relisted — MRIS
- 2009-01-09 Price Changed — MRIS
- 2009-01-02 Delisted — MRIS
- 2008-06-24 Listed — MRIS
- 2008-04-17 Delisted — MRIS
- 2005-06-09 Listed — MRIS
- 2003-04-22 Delisted — MRIS
- 2002-12-02 Listed — MRIS
- 2002-10-04 Delisted — MRIS
- 2002-08-21 Listed — MRIS
- 1998-07-07 Sold (Public Records) $147,000 Public Records
- 1998-07-02 Sold (MLS) $147,000 MRIS
- 1998-06-19 Delisted — MRIS
- 1998-04-22 Listed $150,000 MRIS
- 1996-08-31 Delisted — MRIS
- 1996-08-31 Delisted — MRIS
- 1996-02-28 Listed — MRIS
- 1996-02-28 Listed — MRIS
- 1996-01-31 Delisted — MRIS
- 1995-07-06 Listed — MRIS
Property tax history
-4.1%/yrLatest (2025): $2,291 · +2.7% YoY. Source: county tax records.
Cash-flow waterfall
monthlySold comps — $/sqft
last 12 mo · ≤1 miLoading sold comps…