2321 Guinn Ct · Pahrump, NV
Flood risk 1/10 · Minimal
- FEMA flood zone
- X (shaded)
- Chance of flooding over 30 yrs
- 0.0%
- Est. flood insurance / yr
- $507 – $1,088
Fire risk 5/10 · Moderate
- Est. fire insurance / yr
- $490 – $910
Heat risk 7/10 · Major
- Hot days now (above 103°F)
- 7 days/yr
- Hot days in 30 yrs
- 16 days/yr
Wind risk 1/10 · Minimal
- Chance of severe wind over 30 yrs
- —
Air-quality risk 1/10 · Minimal
- Unhealthy air days now
- 0 days/yr
- Unhealthy air days in 30 yrs
- 0 days/yr
Risk factors via First Street. Map © Google.
Why this score? — see what drove the D+ grade
The composite is a weighted blend of 9 inputs, each scored 0–100. Each bar is that input's sub-score; the figure is the points it added to the 100-point composite (weight × sub-score).
- ARV discount +15.0/15.0
- Cash flow +12.6/30.0
- DSCR +3.8/10.0
- Livability +3.4/5.0
- 1% rule +2.6/10.0
- Appreciation +2.5/10.0
- Rent growth +2.5/5.0
- Condition / age +2.5/5.0
- Schools +2.2/10.0
$234,900
🖨 Deal sheet 📄 Offer letter ✓ Due diligence
Listing remarks
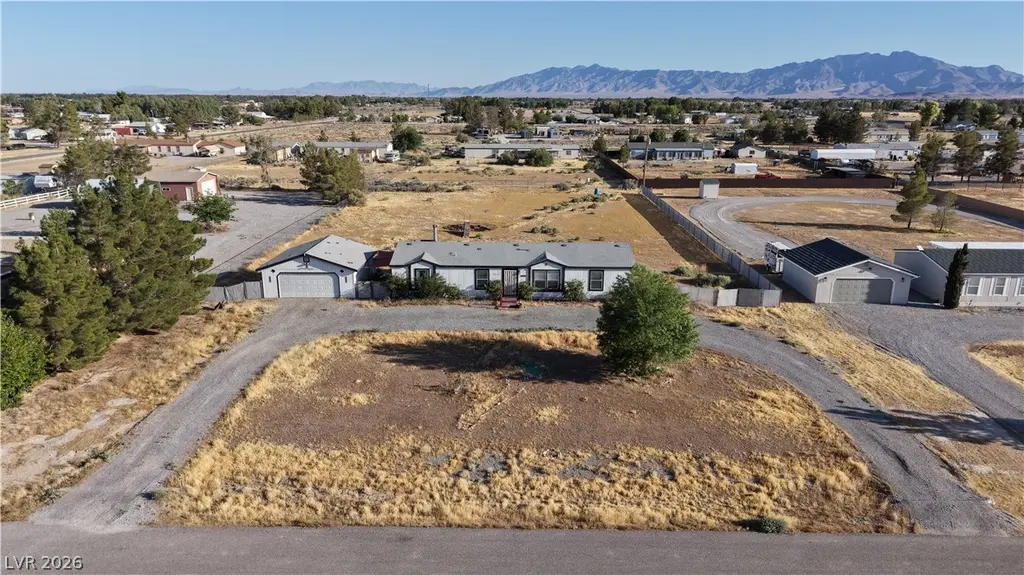
Beautifully situated on a spacious 1.13-acre lot in the peaceful north end of Pahrump, this 2002 manufactured home offers 1,792 sq ft of comfortable living space with endless potential. Located on a quiet cul-de-sac, the property features a detached garage, expansive desert surroundings, and plenty of room for RV parking, recreational vehicles, animals, or future improvements. Enjoy the privacy and freedom of rural living while still being conveniently located near shopping, dining, and local amenities. Generous outdoor space provides the perfect setting for entertaining, gardening, or simply relaxing under Nevada’s stunning sunsets. A fantastic opportunity for investors, first-time b
Key facts
- Rv parking
- Spacious lot
- Detached garage
Tags
Property features AI
Exterior
- Parking: Detached garage with 2 spaces; Private parking; RV potential
- Utilities: Underground utilities; Private well water; Septic available (septic tank)
- Home design: Single-family manufactured home; One-story; Faces south; Resale property
- Construction: Frame construction; Asphalt and tile roof; Manufactured home (64 x 28)
- Exterior features: Private yard with patio; Patio; Back yard metal fencing; Desert landscaping and landscaped areas; Has a view
Interior
- Kitchen: Tile countertops; Tile flooring; Electric range; Microwave; Refrigerator
- Bedrooms: Up to 3 bedrooms (one primary downstairs); Bedroom 2: 12 x 11 with ceiling fan and ceiling light; Bedroom 3: 12 x 11 with ceiling fan and ceiling light; Primary bedroom: 16 x 14 with ceiling fan, ceiling light and walk-in closet
- Flooring: Tile
- Bathrooms: 2 full bathrooms; One bathroom with double sink, separate shower and tub
- Heating & cooling: Central heating (electric); Central air conditioning (electric); Has heating and cooling
- Interior features: Blinds and window treatments; Ceiling fans; Bedroom on main level; Primary bedroom downstairs; Tile flooring
- Laundry & utility: Washer and dryer included; Electric dryer hookup on main level
Neighborhood map
What this means for you Summary
Snapshot
- This is a 3-bed/2.0-bath manufactured listed at $235k.
Deal economics
- At list price, monthly cash flow is $-28 ($-335/yr) — negative.
- To cash-flow at today's rent, offer at most $230k (2.1% below list).
- To meet the 1% rule (rent ≥ 1% of price), the offer needs to be $178k (24.3% below list).
- Recommended offer: $178k (24.3% below list) — sets the bar for 1% rule.
- Cap rate 6.2% vs local median 3.4% in Pahrump — top-decile yield for the area; either an underpriced asset or a hidden risk that comps aren't pricing in. Stress-test before assuming the spread holds.
Location & tenants
- Location reads 68/100 on livability (#30 in NV) — a middle-class / working-renter tenant base. Strengths: cost of living A+, housing A+, health & safety A+; Watch: employment D, schools F, crime F.
- Nye County School District (rural): math 20% / reading 33% proficiency, ranked #16 of 17 in NV (top 94%) — low school quality limits family demand, transient renter base, plan for 1-2y turnover.
- Market conditions: 655 active listings in the ZIP.
- This rent runs 43% of the median local income ($50k/yr) — at the standard rent-burdened threshold; future hikes will face affordability resistance.
Forward outlook
- Local home prices are declining (-3.0%/yr); year-one equity from $2k of loan paydown is wiped out by about $7k of value loss. Plan a longer hold.
- Nye County population projected at -28% by 2050 — secular population decline; favor cash flow + early exit over multi-decade hold.
Negotiation context
- Only 11 days on market — expect competitive offers; lowballing is unlikely to land.
- Current owner paid $170k; 38% above their basis — modest negotiation headroom, anchor on the comps not their cost.
Risks & watch-outs
- Climate carrying-cost: moderate wildfire risk; extreme-heat days projected 7→16/yr by 2055 (HVAC capex compounding) — expect insurance premiums to compound above CPI over the hold.
Questions for the listing agent
- What do current leases actually rent for vs. the listed asking? Can we see a recent rent roll and the last 12 months of T-12 income?
- Is there a deadline driving the sale (1031 exchange, divorce, estate, relocation)? That informs how much negotiation room exists.
- Schools are F-rated, which usually means shorter tenancies and higher turnover. Who's the typical renter profile here, and what's been the actual vacancy rate?
- Crime grade is F in this area — have there been break-ins, vandalism, or insurance claims at this property in the last 3 years? What carrier currently insures it and at what premium?
- The area grade is low — what's the realistic commute time and amenity access for the typical tenant pool here? Any planned neighborhood developments (good or bad) we should know about?
- What's the average days-on-market for RENTAL listings here right now (not sales)? A rising rental-DOM trend means longer vacancies and softer asking-rent achievability than the comps imply.
- What's the recent tenant-quality profile in this submarket — average credit score on applications, eviction rate, late-payment / NSF rate, and stable-employment percentage? A property-management company in the area should have these aggregated.
- How much new for-sale + rental construction is in the pipeline within 1–3 miles? Heavy new supply typically softens prices + rents 12–24 months out; constrained supply supports both.
Investment metrics
- 1% rule
- 0.76% ✗
- Cap rate
- 6.15%
- Cash-on-cash
- -0.51%
- DSCR
- 0.98
- GRM
- 11.0
CMA / ARV
- ARV (on-the-fly)
- $286,720
- Comps found
- 11
Show comp detail 11 sales within ~0.75 mi
| Address | Dist | Beds/Ba | Sqft | Sold | Price | $/sf | Match |
|---|---|---|---|---|---|---|---|
| 2421 W Adkisson St | 0.16mi | 4/2.0 (+1) | 1,716 (-4%) | 5mo | $275,000 | $160 | 76 |
| 2351 Stardust St | 0.13mi | 3/2.0 | 1,566 (-13%) | 2mo | $222,000 | $142 | 71 |
| 1680 N Leslie St | 0.31mi | 3/3.0 | 1,914 (+7%) | 5mo | $300,000 | $157 | 66 |
| 2380 W Adkisson St | 0.10mi | 3/2.0 | 1,580 (-12%) | 12mo | $345,000 | $218 | 65 |
| 1481 Royal Ave | 0.16mi | 4/3.0 (+1) | 1,681 (-6%) | 10mo | $329,500 | $196 | 65 |
| 2451 W Adkisson St | 0.18mi | 4/2.0 (+1) | 1,696 (-5%) | 17mo | $250,000 | $147 | 64 |
| 1960 Royal Ave | 0.37mi | 3/3.0 | 1,859 (+4%) | 14mo | $365,000 | $196 | 61 |
| 1531 N Royal Ave | 0.13mi | 3/2.0 | 1,963 (+10%) | 22mo | $250,000 | $127 | 59 |
| 1870 Landmark Ave | 0.32mi | 3/2.0 | 1,960 (+9%) | 13mo | $300,000 | $153 | 58 |
| 2911 Shadow Mountain St | 0.62mi | 4/2.0 (+1) | 1,624 (-9%) | 6mo | $347,500 | $214 | 46 |
| 2501 Tough Girl Rd | 0.58mi | 3/2.0 | 2,052 (+14%) | 6mo | $345,000 | $168 | 44 |
Match score weights: distance 35% · size 25% · config 20% · recency 20%. Top-matched comps best support the ARV.
Projected returns pro-forma
-3.0% appreciation · 3.0% rent growth · sell at horizon
- IRR
- -17.2%
- Equity multiple
- 0.39×
- Total profit
- $-39,933
- Equity at exit
- $35,024
- IRR
- -9.2%
- Equity multiple
- 0.43×
- Total profit
- $-37,430
- Equity at exit
- $20,310
Cash invested: $65,772 (down + closing). Projections, not guarantees.
Landlord ↔ Tenant lean methodology
- Overall (STATE)
- 71 Landlord-Friendly
- State Nevada
- 71 Landlord-Friendly · R+1
- County
- — inherits STATE
- City
- — inherits STATE
ZIP-level market 89060
- Home prices YoY
- -1.6%
- Active inventory
- 655
- Price-to-rent
- 11.0×
Monthly cashflow live
- Estimated rent
- $1,778 medium interval (Pro) →
- Mortgage (P&I)
- −$1,232
- Tax from tax record
- −$103 /mo · $1,234/yr
- Insurance
- −$98
- HOA
- −$0
- Vacancy / Maint / Mgmt
- −$373
- Net cashflow
- $-28
Break-even live
UW: 25.0% down · 7.5% · 30yr · 1.5% tax · 5.0% vac · 8.0% maint · 8.0% mgmt
Financing live
Cash to close
- Down payment
- $58,725
- Closing costs
- $7,047
- Reserves months
- —
- Total cash needed
- —
Loan-product check · same deal, 3 products live
Conventional
25% down · 7.5% · 30yr
- Down + closing
- —
- Monthly P&I
- —
- Monthly cashflow
- —
- DSCR
- —
- Eligible?
- —
Personal DTI + credit; lowest rate.
DSCR
20% down · 8.5% · 30yr
- Down + closing
- —
- Monthly P&I
- —
- Monthly cashflow
- —
- DSCR
- —
- Eligible?
- —
No personal income docs; deal must DSCR.
Hard money
10% down · 12.0% · 12mo
- Down + closing
- —
- Monthly P&I
- —
- Monthly cashflow
- —
- DSCR
- —
- Eligible?
- —
Short-term bridge; refi at stabilization.
Listing history 9 events
-
2026-06-19days on market $234,900 Active 11 DOM
-
2026-06-18days on market $234,900 Active 10 DOM
-
2026-06-17days on market $234,900 Active 9 DOM
-
2026-06-16days on market $234,900 Active 8 DOM
-
2026-06-15days on market $234,900 Active 7 DOM
-
2026-06-14days on market $234,900 Active 5 DOM
-
2026-06-12days on market $234,900 Active 4 DOM
-
2026-06-09remarks 693-char remark
-
2026-06-09$234,900 Active 1 DOM
ⓘ Source: listings_history table (triggers on properties + properties_extension) + one-shot
backfill from property_details.listing_events for pre-trigger history.
Tax reassessment forecast NV · Resets to sale price
- Current annual tax
- $1,234 · $103/mo
- Projected year-2 tax
- $1,386 · $115/mo
- Expected delta
- +$152/yr (+$13/mo · 12.3%)
ⓘ Screening estimate from a state-policy table — verify with the county assessor before closing.
Climate risk First Street
- Flood 1/10 Low FEMA zone X (shaded) · 0% chance over 30 yrs
- Wildfire 5/10 Major
- Heat 7/10 Severe 7 d/yr ≥103°F today · 16 d/yr by 30 yrs out
- Wind 1/10 Low
- Air quality 1/10 Low 0 unhealthy d/yr today · 0 by 30 yrs out
Nearby sold comps map
Loading sold comps map…
Walkable amenities ~0.75 mi
Loading nearby amenities…
Taxation est. · year 1
- Rental income
- $21,336
- − Mortgage interest
- −$13,158
- − Property taxes
- −$1,234
- − Insurance
- −$1,174
- − Repairs & maintenance
- −$1,707
- − Management
- −$1,707
- − Depreciation
- −$6,833
- Taxable loss
- −$4,478
- Est. tax savings @ 24.0%
- +$1,075
- After-tax cash flow
- $740/yr
For passive investors: Depreciation is non-cash, so a rental often shows a tax loss while cash-flowing — sheltering income. Rental losses are passive: they offset passive income freely, and up to $25,000/yr can offset ordinary (W-2) income if you actively participate and your MAGI is under $100k (phasing out to $0 by $150k); unused losses carry forward. On sale, claimed depreciation is recaptured at up to 25%, and gains may owe capital-gains tax (a 1031 exchange can defer both). Figures are a year-1 estimate at your 24.0% rate — not tax advice; consult a CPA.
Schools (NCES district)
- District
- Nye County School District
- NCES district ID
- 3200360
- Math proficiency
- 20% ▼ -6.00%
- Reading proficiency
- 33% ▼ -5.00%
- Median HH income
- $41,447
- Composite
- 22.43/100
- National rank
- #8110
- State rank
- #16 of 17 in NV
Livability — Pahrump
- Score
- 68/100
- State rank
- #30
- US rank
- #9226
Category grades
Schools grade is shown separately in the Schools card above.
Census & demographics
- Census place
- Pahrump, NV
- County
- Nye County · 47,491 people
- City population
- 47,491
- Metro
- Pahrump, NV
- Population (ZIP)
- 12,864
- Household income
- $50,000
- Rent vs Own
- Severe rent burden
- 170.0
Population outlook (Nye County) Hauer SSP2
- Today (2025)
- 40,727 people
- By 2030
- 38,812 · -4.7%
- By 2040
- 33,952 · -16.6%
- By 2050
- 29,393 · -27.8%
- By 2075
- 21,122 · -48.1%
- By 2100
- 14,400 · -64.6%
Race, ethnicity, and origin ACS 2023
- Neighborhood character
- Predominantly White (71%)
- Race & ethnicity
- White 71% Hispanic / Latino 20% Two or more races 12% Asian 2% Black 1% Pacific Islander 1%
- Hispanic origin (detail)
- Mexican 16%
- Common ancestry
- Iranian 4% Romanian 3% Lithuanian 2%
- Foreign-born
- 9% · Canada, China
- Languages at home
- 85% English-only · Spanish 12% Other Indo-European 1% German/W. Germanic 1%
Political lean MEDSL · Nye
- 2024 margin
- Solid R (+42.2) · D 28.0% · R 70.2% · Other 1.8%
- 2008→2024 swing
- -28.8pp toward R · 2008: -13.4pp · 2024: -42.2pp
- All cycles
- 2024: R+42.2 2020: R+40.4 2016: R+42.0 2012: R+24.2 2008: R+13.4
Not yet ingested
- Civics
- —
Market trends
- HPI YoY
- ▼ -4.93%
- Current HPI
- 312.3758
- Rent YoY
- —
- Metro
- Pahrump, NV
- State GDP YoY
- ▲ 3.08%
- F500 in state
- 6
Industry mix (Fortune 500 HQ in NV)
| Industry | F500 HQs | Revenue |
|---|---|---|
| Hotels / Casinos | 3 | $36B |
|
||
Price history
-59.9% since first listed3 events — show timeline
- 2026-06-08 Listed $234,900 GLVAR
- 2005-01-05 Sold (Public Records) $170,000 Public Records
- 2001-01-16 Sold (Public Records) $585,500 Public Records
Property tax history
-0.9%/yrLatest (2025): $1,234 · +3.3% YoY. Source: county tax records.
Cash-flow waterfall
monthlySold comps — $/sqft
last 12 mo · ≤1 miLoading sold comps…