 🏗️ New Construction
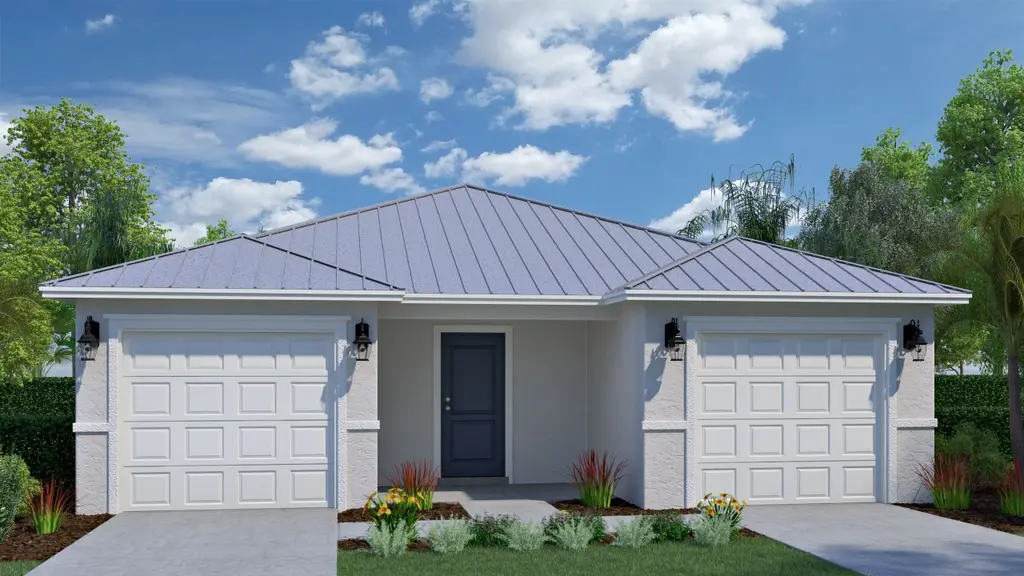
Sundance Plan · Lakewood Park, FL
Flood risk 3/10 · Minor
- FEMA flood zone
- X (unshaded)
- Chance of flooding over 30 yrs
- 0.2%
- Est. flood insurance / yr
- $507 – $1,088
Fire risk 4/10 · Minor
- Est. fire insurance / yr
- $947 – $1,759
Heat risk 10/10 · Severe
- Hot days now (above 107°F)
- 7 days/yr
- Hot days in 30 yrs
- 25 days/yr
Wind risk 10/10 · Severe
- Chance of severe wind over 30 yrs
- 99.0%
Air-quality risk 1/10 · Minimal
- Unhealthy air days now
- 0 days/yr
- Unhealthy air days in 30 yrs
- 0 days/yr
Risk factors via First Street. Map © Google.
Why this score? — see what drove the D- grade
The composite is a weighted blend of 9 inputs, each scored 0–100. Each bar is that input's sub-score; the figure is the points it added to the 100-point composite (weight × sub-score).
- Cash flow +12.1/30.0
- ARV discount +7.5/15.0
- Condition / age +3.8/5.0
- Schools +3.7/10.0
- DSCR +3.6/10.0
- 1% rule +3.5/10.0
- Livability +3.2/5.0
- Rent growth +2.5/5.0
- Appreciation +0.0/10.0
$246,990
🖨 Deal sheet (PDF) 📄 Offer letter ✓ Due diligence
Listing remarks
The Sundance is a bright and thoughtfully designed home that offers the ideal blend of comfort, convenience, and easy Florida living. With 1,191 square feet of interior space, this two-bedroom layout is perfect for homebuyers who want a welcoming low-maintenance home in a lively 55+ community. From the covered entry, you step into a light-filled foyer that opens directly into the spacious great room. This central gathering area offers plenty of room for relaxing, watching movies, or hosting friends. The great room flows naturally into the kitchen, which features a smart L-shaped layout with an island, a pantry, and clear sightlines to the main living area. Just off the great room, a sliding
Key facts
- Spacious great room
- Light filled foyer
- Walk in closet
Tags
Property features AI
Finance
- Financial info: List price $244,990
Exterior
- Parking: 1 garage space (1 parking space total)
- Home design: Single-family plan home located at 18 Las Casitas Ct, Fort Pierce, FL 34951; Status: Active
- Exterior features: Living area of 1,191 (living area provided)
Interior
- Bedrooms: 2 bedrooms
- Bathrooms: 2 full bathrooms
- Interior features: Plan: Sundance (new construction plan)
Neighborhood map
What this means for you Summary
Snapshot
- This is a 2-bed/2.0-bath single-family listed at $247k. Condition is rated good.
Deal economics
- At list price, monthly cash flow is $-54 ($-647/yr) — negative.
- To cash-flow at today's rent, offer at most $246k (0.4% below list).
- To meet the 1% rule (rent ≥ 1% of price), the offer needs to be $215k (12.9% below list).
- Recommended offer: $215k (12.9% below list) — sets the bar for 1% rule.
Location & tenants
- Location reads 63/100 on livability (#719 in FL) — a middle-class / working-renter tenant base. Strengths: cost of living A+, housing A+; Watch: schools F, amenities F, commute F.
- St. Lucie (urban): math 40% / reading 48% proficiency, ranked #51 of 73 in FL (top 70%) — families likely to look elsewhere, expect single-tenant / working-renter base with shorter leases.
- Market conditions: 292 active listings in the ZIP; 8 comparable units currently listed for rent nearby; rentals at typical pace (median 22d on market — plan ~3-4 weeks tenant-placement turnaround); 4,868 units permitted in St. Lucie County in 2024 (268 in 5+ unit buildings).
- This rent runs 41% of the median local income ($63k/yr) — at the standard rent-burdened threshold; future hikes will face affordability resistance.
Forward outlook
- Local home prices are declining (-3.0%/yr); year-one equity from $2k of loan paydown is wiped out by about $8k of value loss. Plan a longer hold.
- St. Lucie County population projected at +20% by 2050 — long-run rental-demand tailwind backs the buy-and-hold thesis.
Negotiation context
- It's been on market 65 days — a 6% lower offer ($232k) is reasonable based on typical stale-listing flexibility.
Risks & watch-outs
- Climate carrying-cost: severe wind risk, 99% chance of damaging wind over 30y; extreme-heat days projected 7→25/yr by 2055 (HVAC capex compounding) — expect insurance premiums to compound above CPI over the hold.
Questions for the listing agent
- What do current leases actually rent for vs. the listed asking? Can we see a recent rent roll and the last 12 months of T-12 income?
- It's been on market 65 days. Have you received any prior offers? Is the seller open to a 13% concession, seller financing, or rate buy-down credit?
- Why hasn't it sold? Are there any deal-killer items the seller is aware of (foundation, flood, title, zoning, code violations)?
- Is there a deadline driving the sale (1031 exchange, divorce, estate, relocation)? That informs how much negotiation room exists.
- Schools are F-rated, which usually means shorter tenancies and higher turnover. Who's the typical renter profile here, and what's been the actual vacancy rate?
- The area grade is low — what's the realistic commute time and amenity access for the typical tenant pool here? Any planned neighborhood developments (good or bad) we should know about?
- What's the average days-on-market for RENTAL listings here right now (not sales)? A rising rental-DOM trend means longer vacancies and softer asking-rent achievability than the comps imply.
- What's the recent tenant-quality profile in this submarket — average credit score on applications, eviction rate, late-payment / NSF rate, and stable-employment percentage? A property-management company in the area should have these aggregated.
- How much new for-sale + rental construction is in the pipeline within 1–3 miles? Heavy new supply typically softens prices + rents 12–24 months out; constrained supply supports both.
Investment metrics
- 1% rule
- 0.85% ✗
- Cap rate
- 6.04%
- Cash-on-cash
- -0.91%
- DSCR
- 0.96
- GRM
- 9.8
CMA / ARV
- ARV (on-the-fly)
- $253,683
- Comps found
- 12
Show comp detail 12 sales within ~0.75 mi
| Address | Dist | Beds/Ba | Sqft | Sold | Price | $/sf | Match |
|---|---|---|---|---|---|---|---|
| 3 Quito | 0.31mi | 1/1.5 (-1) | 1,305 (+10%) | 2mo | $249,000 | $191 | 61 |
| 11 Villa Blanca | 0.22mi | 1/1.5 (-1) | 1,305 (+10%) | 8mo | $249,000 | $191 | 60 |
| 6806 Pensacola Rd | 0.61mi | 3/2.0 (+1) | 1,244 (+4%) | 5mo | $305,000 | $245 | 55 |
| 5809 Killarney Ave | 0.70mi | 2/2.0 | 1,125 (-6%) | 4mo | $240,000 | $213 | 55 |
| 674 25th St SW | 0.74mi | 3/2.0 (+1) | 1,176 (-1%) | 5mo | $215,000 | $183 | 54 |
| 5 Villa Maria | 0.36mi | 1/1.5 (-1) | 1,305 (+10%) | 8mo | $249,000 | $191 | 53 |
| 6603 Deland Ave | 0.47mi | 2/2.0 | 1,275 (+7%) | 17mo | $333,000 | $261 | 52 |
| 6806 Lakeland Blvd | 0.64mi | 3/2.0 (+1) | 1,263 (+6%) | 10mo | $313,000 | $248 | 47 |
| 5711 Killarney Ave | 0.74mi | 2/2.0 | 1,112 (-7%) | 11mo | $200,000 | $180 | 45 |
| 6604 Donlon | 0.55mi | 3/2.0 (+1) | 1,273 (+7%) | 15mo | $294,990 | $232 | 45 |
| 6905 Bayard Rd | 0.69mi | 2/2.0 | 1,075 (-10%) | 11mo | $305,000 | $284 | 42 |
| 11 Villa Del Norte | 0.67mi | 1/1.5 (-1) | 1,305 (+10%) | 7mo | $249,000 | $191 | 40 |
Match score weights: distance 35% · size 25% · config 20% · recency 20%. Top-matched comps best support the ARV.
Projected returns pro-forma
-3.0% appreciation · 3.0% rent growth · sell at horizon
- IRR
- -17.8%
- Equity multiple
- 0.37×
- Total profit
- $-44,507
- Equity at exit
- $37,825
- IRR
- -9.9%
- Equity multiple
- 0.39×
- Total profit
- $-43,044
- Equity at exit
- $21,934
Cash invested: $71,031 (down + closing). Projections, not guarantees.
Landlord ↔ Tenant lean methodology
- Overall (STATE)
- 87 Strongly Landlord-Friendly
- State Florida
- 87 Strongly Landlord-Friendly · R+3
- County
- — inherits STATE
- City
- — inherits STATE
ZIP-level market 34951
- Home prices YoY
- -23.6%
- Active inventory
- 292
- Price-to-rent
- 9.6×
Monthly cashflow live
- Estimated rent
- $2,151 high interval (Pro) →
- Mortgage (P&I)
- −$1,330
- Tax est. 1.5%
- −$317 /mo · $3,805/yr
- Insurance
- −$106
- HOA
- −$0
- Vacancy / Maint / Mgmt
- −$452
- Net cashflow
- $-54
Break-even live
Sensitivity live
| Price | -10% $121 | -5% $34 | +0% $-54 | +5% $-142 | +10% $-229 |
|---|---|---|---|---|---|
| Rent | -10% $-224 | -5% $-139 | +0% $-54 | +5% $31 | +10% $116 |
| Rate | -1.0pp $74 | -0.5pp $11 | base $-54 | +0.5pp $-120 | +1.0pp $-186 |
UW: 25.0% down · 7.5% · 30yr · 1.5% tax · 5.0% vac · 8.0% maint · 8.0% mgmt
Financing live
Cash to close
- Down payment
- $63,421
- Closing costs
- $7,610
- Reserves months
- —
- Total cash needed
- —
Loan-product check · same deal, 3 products live
Conventional
25% down · 7.5% · 30yr
- Down + closing
- —
- Monthly P&I
- —
- Monthly cashflow
- —
- DSCR
- —
- Eligible?
- —
Personal DTI + credit; lowest rate.
DSCR
20% down · 8.5% · 30yr
- Down + closing
- —
- Monthly P&I
- —
- Monthly cashflow
- —
- DSCR
- —
- Eligible?
- —
No personal income docs; deal must DSCR.
Hard money
10% down · 12.0% · 12mo
- Down + closing
- —
- Monthly P&I
- —
- Monthly cashflow
- —
- DSCR
- —
- Eligible?
- —
Short-term bridge; refi at stabilization.
Rent comps 8 comps
| Address | Beds | Baths | Sqft | Rent | $/sqft | DOM | Units | Dist |
|---|---|---|---|---|---|---|---|---|
| 5642 Sunberry Cir Fort Pierce, FL | 3.0 | 2.0 | 1377 | $1,950 | $1.42 | 24d | 1 | 0.50mi |
| 6906 Ocala Ave Fort Pierce, FL | 3.0 | 2.0 | 1175 | $1,955 | $1.66 | 14d | 1 | 0.70mi |
| 2450 8th Ave SW Vero Beach, FL | 3.0 | 2.0 | 1388 | $2,100 | $1.51 | 21d | 1 | 0.83mi |
| 7500 Pensacola Rd Fort Pierce, FL | 3.0 | 2.0 | 1125 | $2,150 | $1.91 | 14d | 1 | 0.99mi |
| 985 23rd Pl SW Vero Beach, FL | 3.0 | 2.0 | 1176 | $2,200 | $1.87 | 21d | 1 | 1.04mi |
| 7403 Winter Garden Pkwy Fort Pierce, FL | 3.0 | 2.0 | 1372 | $2,200 | $1.60 | 21d | 1 | 1.04mi |
| 7503 Paso Robles Blvd Fort Pierce, FL | 3.0 | 2.0 | 1260 | $2,000 | $1.59 | 24d | 1 | 1.06mi |
| 3766 Harborside Ave Fort Pierce, FL | 2.0 | 2.0 | 1308 | $2,160 | $1.65 | 14d | 1 | 1.26mi |
Listing history 16 events
-
2026-06-18days on market $246,990 Active 65 DOM
-
2026-06-17days on market $246,990 Active 64 DOM
-
2026-06-16days on market $246,990 Active 63 DOM
-
2026-06-15days on market $246,990 Active 62 DOM
-
2026-06-14days on market $246,990 Active 60 DOM
-
2026-06-13days on market $246,990 Active 59 DOM
-
2026-06-10days on market $246,990 Active 57 DOM
-
2026-06-09days on market $246,990 Active 56 DOM
-
2026-06-08days on market $246,990 Active 55 DOM
-
2026-06-07days on market $246,990 Active 54 DOM
-
2026-06-05days on market $246,990 Active 51 DOM
-
2026-06-03pricedays on market $246,990 Active 50 DOM
-
2026-06-02days on market $244,990 Active 49 DOM
-
2026-06-01days on market $244,990 Active 48 DOM
-
2026-05-31days on market $244,990 Active 47 DOM
-
2026-05-30days on market $244,990 Active 46 DOM
ⓘ Source: listings_history table (triggers on properties + properties_extension) + one-shot
backfill from property_details.listing_events for pre-trigger history.
Climate risk First Street
- Flood 3/10 Moderate FEMA zone X (unshaded) · 20% chance over 30 yrs
- Wildfire 4/10 Moderate
- Heat 10/10 Extreme 7 d/yr ≥107°F today · 25 d/yr by 30 yrs out
- Wind 10/10 Extreme 99% chance of damaging wind over 30 yrs
- Air quality 1/10 Low 0 unhealthy d/yr today · 0 by 30 yrs out
Nearby sold comps map
Loading sold comps map…
Walkable amenities ~0.75 mi
Loading nearby amenities…
Taxation est. · year 1
- Rental income
- $25,812
- − Mortgage interest
- −$14,210
- − Property taxes
- −$3,805
- − Insurance
- −$1,268
- − Repairs & maintenance
- −$2,065
- − Management
- −$2,065
- − Depreciation
- −$7,380
- Taxable loss
- −$4,982
- Est. tax savings @ 24.0%
- +$1,196
- After-tax cash flow
- $549/yr
For passive investors: Depreciation is non-cash, so a rental often shows a tax loss while cash-flowing — sheltering income. Rental losses are passive: they offset passive income freely, and up to $25,000/yr can offset ordinary (W-2) income if you actively participate and your MAGI is under $100k (phasing out to $0 by $150k); unused losses carry forward. On sale, claimed depreciation is recaptured at up to 25%, and gains may owe capital-gains tax (a 1031 exchange can defer both). Figures are a year-1 estimate at your 24.0% rate — not tax advice; consult a CPA.
Condition & rehab AI · 3 photos
The Sundance home is in good condition with a fresh exterior and interior. Minor updates to the exterior and interior paint would significantly enhance its curb appeal and value.
Value-add opportunities
- Both Paint exterior — Enhances curb appeal and value
- Both Paint interior walls — Fresh paint improves aesthetics and value
- Both Replace landscaping — Fresh landscaping enhances curb appeal and value
Renovation cost estimate screening
Value-add ROI direction
- Both Paint exterior — Enhances curb appeal and value ↑
- Both Paint interior walls — Fresh paint improves aesthetics and value ↑
- Both Replace landscaping — Fresh landscaping enhances curb appeal and value ↑
ⓘ Cost ranges are severity-bucket heuristics (US national rule-of-thumb). Get contractor quotes + a written scope before underwriting a rehab budget.
Schools (NCES district)
- District
- St. Lucie
- NCES district ID
- 1201770
- Math proficiency
- 40% ▼ -11.00%
- Reading proficiency
- 48% ▼ -4.00%
- Median HH income
- $44,737
- Composite
- 37.28/100
- National rank
- #4449
- State rank
- #51 of 73 in FL
Livability — Lakewood Park
- Score
- 63/100
- State rank
- #719
- US rank
- #15407
Category grades
Schools grade is shown separately in the Schools card above.
Census & demographics
- Census place
- Lakewood Park, FL
- County
- Saint Lucie County · 337,150 people
- Metro
- Port St. Lucie, FL
- Population (ZIP)
- 17,148
- Household income
- $63,122
- Rent vs Own
- Severe rent burden
- 140.0
Population outlook (St. Lucie County) Hauer SSP2
- Today (2025)
- 338,016 people
- By 2030
- 355,687 · +5.2%
- By 2040
- 385,521 · +14.1%
- By 2050
- 406,106 · +20.1%
- By 2075
- 441,054 · +30.5%
- By 2100
- 436,885 · +29.2%
Race, ethnicity, and origin ACS 2023
- Neighborhood character
- Predominantly White (74%)
- Race & ethnicity
- White 74% Black 13% Hispanic / Latino 8% Two or more races 7% Asian 2%
- Hispanic origin (detail)
- Mexican 2% Puerto Rican 2% Cuban 2%
- Common ancestry
- Romanian 3% Italian 2% Lithuanian 2%
- Foreign-born
- 10% · Canada, Jamaica, Vietnam
- Languages at home
- 88% English-only · Spanish 7% French/Haitian/Cajun 3% Vietnamese 1%
Political lean MEDSL · St. Lucie
- 2024 margin
- Lean R (+9.1) · D 45.1% · R 54.2%
- 2008→2024 swing
- -21.2pp toward R · 2008: 12.1pp · 2024: -9.1pp
- All cycles
- 2024: R+9.1 2020: R+1.6 2016: R+2.5 2012: D+7.9 2008: D+12.1
Not yet ingested
- Civics
- —
Market trends
- HPI YoY
- ▼ -106.06%
- Current HPI
- 343.1376
- Rent YoY
- —
- Metro
- Port St. Lucie, FL
- State GDP YoY
- ▲ 3.28%
- F500 in state
- 36
Industry mix (Fortune 500 HQ in FL)
| Industry | F500 HQs | Revenue |
|---|---|---|
| Industrial Technology | 2 | $29B |
|
||
| Insurance | 2 | $17B |
|
||
| Retail | 1 | $60B |
|
||
| Technology Distribution | 1 | $58B |
|
||
| Homebuilding | 1 | $35B |
|
||
| Technology Manufacturing | 1 | $35B |
|
||
Cash-flow waterfall
monthlySold comps — $/sqft
last 12 mo · ≤1 miLoading sold comps…