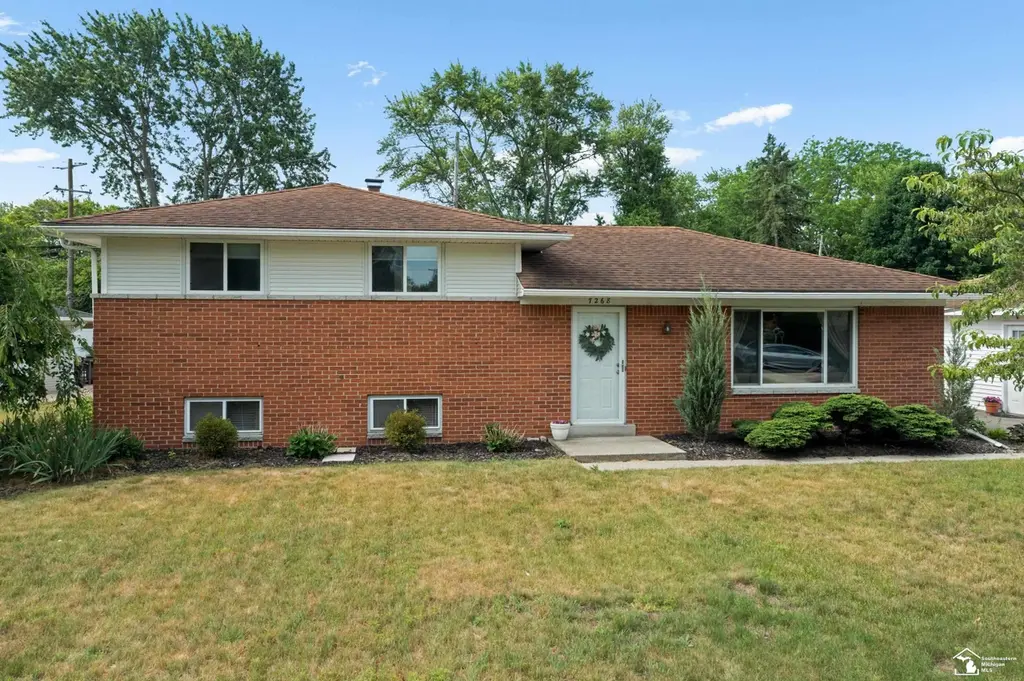
7268 Brookside Dr · Bedford, MI
Flood risk 1/10 · Minimal
- FEMA flood zone
- X (unshaded)
- Chance of flooding over 30 yrs
- 0.0%
- Est. flood insurance / yr
- $507 – $1,088
Fire risk 1/10 · Minimal
- Est. fire insurance / yr
- $784 – $1,456
Heat risk 3/10 · Minor
- Hot days now (above 101°F)
- 7 days/yr
- Hot days in 30 yrs
- 16 days/yr
Wind risk 2/10 · Minimal
- Chance of severe wind over 30 yrs
- —
Air-quality risk 2/10 · Minimal
- Unhealthy air days now
- 1 days/yr
- Unhealthy air days in 30 yrs
- 3 days/yr
Risk factors via First Street. Map © Google.
Why this score? — see what drove the C- grade
The composite is a weighted blend of 9 inputs, each scored 0–100. Each bar is that input's sub-score; the figure is the points it added to the 100-point composite (weight × sub-score).
- Cash flow +19.2/30.0
- ARV discount +9.7/15.0
- DSCR +6.1/10.0
- 1% rule +3.9/10.0
- Schools +3.8/10.0
- Rent growth +2.5/5.0
- Livability +2.5/5.0
- Condition / age +2.5/5.0
- Appreciation +0.0/10.0
$264,900
🖨 Deal sheet 📄 Offer letter ✓ Due diligence
Listing remarks MLS
Welcome to this beautifully maintained 3-bedroom, 1.5-bath home situated on a desirable corner lot in the Colonial Gardens neighborhood. This move-in-ready property offers numerous updates, including a new electrical panel (2020), furnace and central air conditioning (2021), pool liner (2025), appliances (2024), and a newly updated tub/shower combination (2026). The spacious interior provides comfortable living areas, while the finished basement is an entertainer's dream, featuring a custom bar area perfect for hosting family and friends. Outside, enjoy the benefits of the corner lot along with your private pool for summer relaxation and fun. With major mechanical updates already completed and pride of ownership evident throughout, this home is ready for its next owner to enjoy. Don't miss the opportunity to make this Colonial Gardens gem your own!
Key facts
- Custom bar area
- Appliances
- Finished basement
Tags
Property features AI
Finance
- HOA & community: Homeowners association present
Exterior
- Parking: Detached 1-car garage
- Utilities: Public water; Public sewer
- Home design: Single-family residence; Residential property
- Construction: Brick and vinyl siding exterior; Slab foundation; Built area: above grade and below grade finished areas available
- Exterior features: Corner lot; Above-ground pool
Interior
- Kitchen: Dishwasher; Microwave; Oven; Range
- Bathrooms: 1 full bathroom; 1 half bathroom
- Heating & cooling: Forced air heating (natural gas); Central air conditioning
- Interior features: Finished basement; Gas water heater; Dishwasher; Microwave; Oven; Range
Neighborhood map
What this means for you Summary
Snapshot
- This is a 3-bed/1.5-bath single-family listed at $265k.
Deal economics
- At list price, monthly cash flow is $286 ($3k/yr) — positive.
- The deal already cash-flows at list — no discount required.
- To meet the 1% rule (rent ≥ 1% of price), the offer needs to be $236k (10.8% below list).
- Recommended offer: $236k (10.8% below list) — sets the bar for 1% rule.
Location & tenants
- Location reads: area grade C — affects rentability + tenant quality, not the cash-flow math above.
- Bedford Public Schools (suburban): math 33% / reading 53% proficiency, ranked #150 of 540 in MI (top 28%) — families likely to look elsewhere, expect single-tenant / working-renter base with shorter leases; only 18% free/reduced lunch — higher-income household profile.
- Market conditions: 29 active listings in the ZIP; 3 comparable units currently listed for rent nearby; rentals at typical pace (median 14d on market — plan ~3-4 weeks tenant-placement turnaround); 264 units permitted in Monroe County in 2024 (40 in 5+ unit buildings).
Forward outlook
- Local home prices are declining (-3.0%/yr); year-one equity from $2k of loan paydown is wiped out by about $8k of value loss. Plan a longer hold.
- Monroe County population projected at -20% by 2050 — secular population decline; favor cash flow + early exit over multi-decade hold.
Negotiation context
- Only 1 days on market — expect competitive offers; lowballing is unlikely to land.
- 14 sale attempts since 21y ago with the ask held roughly flat each time — persistent listings suggest the price (not the market) is what's stuck; bring a comps-based counter.
- Current owner paid $158k; list at $265k implies a 68% gain — meaningful room to come down on a strong offer.
Questions for the listing agent
- Built in 1960 — when were the roof, HVAC, electrical panel, plumbing, and water heater last replaced?
- Is there a deadline driving the sale (1031 exchange, divorce, estate, relocation)? That informs how much negotiation room exists.
- What's the average days-on-market for RENTAL listings here right now (not sales)? A rising rental-DOM trend means longer vacancies and softer asking-rent achievability than the comps imply.
- What's the recent tenant-quality profile in this submarket — average credit score on applications, eviction rate, late-payment / NSF rate, and stable-employment percentage? A property-management company in the area should have these aggregated.
- How much new for-sale + rental construction is in the pipeline within 1–3 miles? Heavy new supply typically softens prices + rents 12–24 months out; constrained supply supports both.
Investment metrics
- 1% rule
- 0.89% ✗
- Cap rate
- 7.59%
- Cash-on-cash
- 4.62%
- DSCR
- 1.21
- GRM
- 9.3
CMA / ARV
- ARV (on-the-fly)
- $278,800
- Comps found
- 12
Show comp detail 12 sales within ~0.75 mi
| Address | Dist | Beds/Ba | Sqft | Sold | Price | $/sf | Match |
|---|---|---|---|---|---|---|---|
| 7060 Brookside Dr | 0.19mi | 3/1.5 | 1,640 (0%) | 2mo | $280,000 | $171 | 89 |
| 7076 Ridgedale Ln | 0.19mi | 3/1.5 | 1,640 (0%) | 4mo | $271,000 | $165 | 88 |
| 3739 Ridgedale Ln | 0.24mi | 3/1.5 | 1,640 (0%) | 1mo | $278,000 | $170 | 88 |
| 3714 Ridgedale Ln | 0.21mi | 3/2.0 | 1,595 (-3%) | 1mo | $288,500 | $181 | 82 |
| 7117 Ridgedale St | 0.15mi | 4/1.5 (+1) | 1,600 (-2%) | 10mo | $245,000 | $153 | 76 |
| 7303 Cranbrook Dr | 0.13mi | 3/1.0 | 1,493 (-9%) | 11mo | $222,500 | $149 | 68 |
| 3633 Essex St | 0.39mi | 3/1.0 | 1,576 (-4%) | 11mo | $225,000 | $143 | 64 |
| 3447 Woodmont Dr | 0.55mi | 3/2.0 | 1,748 (+7%) | 4mo | $297,500 | $170 | 58 |
| 7089 Cranbrook Ln | 0.20mi | 3/1.0 | 1,410 (-14%) | 10mo | $223,000 | $158 | 57 |
| 7656 Lucille Dr | 0.64mi | 4/2.0 (+1) | 1,752 (+7%) | 1mo | $330,000 | $188 | 51 |
| 3415 Woodmont Dr | 0.57mi | 4/2.0 (+1) | 1,848 (+13%) | 2mo | $289,900 | $157 | 44 |
| 6890 Summerlyn Lakes Dr | 0.64mi | 2/2.0 (-1) | 1,411 (-14%) | 5mo | $335,000 | $237 | 36 |
Match score weights: distance 35% · size 25% · config 20% · recency 20%. Top-matched comps best support the ARV.
Projected returns pro-forma
-3.0% appreciation · 3.0% rent growth · sell at horizon
- IRR
- -9.1%
- Equity multiple
- 0.66×
- Total profit
- $-24,859
- Equity at exit
- $39,497
- IRR
- 0.2%
- Equity multiple
- 1.02×
- Total profit
- $1,288
- Equity at exit
- $22,904
Cash invested: $74,172 (down + closing). Projections, not guarantees.
Landlord ↔ Tenant lean methodology
- Overall (STATE)
- 62 Landlord-Friendly
- State Michigan
- 62 Landlord-Friendly · EVEN
- County
- — inherits STATE
- City
- — inherits STATE
ZIP-level market 48144
- Active inventory
- 29
- Price-to-rent
- 9.3×
Monthly cashflow live
- Estimated rent
- $2,362 medium interval (Pro) →
- Mortgage (P&I)
- −$1,389
- Tax from tax record
- −$81 /mo · $968/yr
- Insurance
- −$110
- HOA
- −$0
- Vacancy / Maint / Mgmt
- −$496
- Net cashflow
- $286
Break-even live
UW: 25.0% down · 7.5% · 30yr · 1.5% tax · 5.0% vac · 8.0% maint · 8.0% mgmt
Financing live
Cash to close
- Down payment
- $66,225
- Closing costs
- $7,947
- Reserves months
- —
- Total cash needed
- —
Loan-product check · same deal, 3 products live
Conventional
25% down · 7.5% · 30yr
- Down + closing
- —
- Monthly P&I
- —
- Monthly cashflow
- —
- DSCR
- —
- Eligible?
- —
Personal DTI + credit; lowest rate.
DSCR
20% down · 8.5% · 30yr
- Down + closing
- —
- Monthly P&I
- —
- Monthly cashflow
- —
- DSCR
- —
- Eligible?
- —
No personal income docs; deal must DSCR.
Hard money
10% down · 12.0% · 12mo
- Down + closing
- —
- Monthly P&I
- —
- Monthly cashflow
- —
- DSCR
- —
- Eligible?
- —
Short-term bridge; refi at stabilization.
Rent comps 3 comps
| Address | Beds | Baths | Sqft | Rent | $/sqft | DOM | Units | Dist |
|---|---|---|---|---|---|---|---|---|
| 7076 Middlebury Dr Lambertville, MI | 3.0 | 2.0 | 1248 | $2,495 | $2.00 | 14d | 1 | 0.15mi |
| 3145 Brock Dr Toledo, OH | 3.0 | 2.0 | 1100 | $1,600 | $1.45 | 14d | 1 | 1.40mi |
| 6022 Clover Ln Toledo, OH | 3.0 | 2.0 | 1296 | $1,750 | $1.35 | 21d | 1 | 1.50mi |
Listing history 2 events
-
2026-06-18remarks 699-char remark
Show marketing remark (860 chars)
Welcome to this beautifully maintained 3-bedroom, 1.5-bath home situated on a desirable corner lot in the Colonial Gardens neighborhood. This move-in-ready property offers numerous updates, including a new electrical panel (2020), furnace and central air conditioning (2021), pool liner (2025), appliances (2024), and a newly updated tub/shower combination (2026). The spacious interior provides comfortable living areas, while the finished basement is an entertainer's dream, featuring a custom bar area perfect for hosting family and friends. Outside, enjoy the benefits of the corner lot along with your private pool for summer relaxation and fun. With major mechanical updates already completed and pride of ownership evident throughout, this home is ready for its next owner to enjoy. Don't miss the opportunity to make this Colonial Gardens gem your own!
-
2026-06-18$264,900 Active 1 DOM
Show marketing remark (860 chars)
Welcome to this beautifully maintained 3-bedroom, 1.5-bath home situated on a desirable corner lot in the Colonial Gardens neighborhood. This move-in-ready property offers numerous updates, including a new electrical panel (2020), furnace and central air conditioning (2021), pool liner (2025), appliances (2024), and a newly updated tub/shower combination (2026). The spacious interior provides comfortable living areas, while the finished basement is an entertainer's dream, featuring a custom bar area perfect for hosting family and friends. Outside, enjoy the benefits of the corner lot along with your private pool for summer relaxation and fun. With major mechanical updates already completed and pride of ownership evident throughout, this home is ready for its next owner to enjoy. Don't miss the opportunity to make this Colonial Gardens gem your own!
ⓘ Source: listings_history table (triggers on properties + properties_extension) + one-shot
backfill from property_details.listing_events for pre-trigger history.
Tax reassessment forecast MI · Partial reset (capped growth)
- Current annual tax
- $968 · $81/mo
- Projected year-2 tax
- $2,524 · $210/mo
- Expected delta
- +$1,556/yr (+$130/mo · 160.7%)
ⓘ Screening estimate from a state-policy table — verify with the county assessor before closing.
Climate risk First Street
- Flood 1/10 Low FEMA zone X (unshaded) · 0% chance over 30 yrs
- Wildfire 1/10 Low
- Heat 3/10 Moderate 7 d/yr ≥101°F today · 16 d/yr by 30 yrs out
- Wind 2/10 Low
- Air quality 2/10 Low 1 unhealthy d/yr today · 3 by 30 yrs out
Nearby sold comps map
Loading sold comps map…
Walkable amenities ~0.75 mi
Loading nearby amenities…
Taxation est. · year 1
- Rental income
- $28,340
- − Mortgage interest
- −$14,839
- − Property taxes
- −$968
- − Insurance
- −$1,324
- − Repairs & maintenance
- −$2,267
- − Management
- −$2,267
- − Depreciation
- −$7,706
- Taxable loss
- −$1,032
- Est. tax savings @ 24.0%
- +$248
- After-tax cash flow
- $3,674/yr
For passive investors: Depreciation is non-cash, so a rental often shows a tax loss while cash-flowing — sheltering income. Rental losses are passive: they offset passive income freely, and up to $25,000/yr can offset ordinary (W-2) income if you actively participate and your MAGI is under $100k (phasing out to $0 by $150k); unused losses carry forward. On sale, claimed depreciation is recaptured at up to 25%, and gains may owe capital-gains tax (a 1031 exchange can defer both). Figures are a year-1 estimate at your 24.0% rate — not tax advice; consult a CPA.
Schools (NCES district)
- District
- Bedford Public Schools
- NCES district ID
- 2604470
- Math proficiency
- 33% ▼ -14.00%
- Reading proficiency
- 53% ▼ -3.00%
- Median HH income
- $63,784
- Composite
- 38.22/100
- National rank
- #4252
- State rank
- #150 of 540 in MI
Livability — Bedford
No livability data for this city. (Only ~50 U.S. cities are tracked.)
Census & demographics
- Census place
- Lambertville, MI
- Population (ZIP)
- 10,275
Population outlook (Monroe County) Hauer SSP2
- Today (2025)
- 144,439 people
- By 2030
- 140,033 · -3.1%
- By 2040
- 128,408 · -11.1%
- By 2050
- 115,024 · -20.4%
- By 2075
- 87,273 · -39.6%
- By 2100
- 63,110 · -56.3%
Race, ethnicity, and origin ACS 2023
- Neighborhood character
- Predominantly White (87%)
- Race & ethnicity
- White 87% Two or more races 7% Hispanic / Latino 4% Black 2% Asian 2%
- Common ancestry
- Romanian 13% Lithuanian 5% Scotch-Irish 2%
- Foreign-born
- 4% · China, South Korea
- Languages at home
- 95% English-only · Tagalog/Filipino 2% Spanish 1% Arabic 1%
Political lean MEDSL · Monroe
- 2024 margin
- Strong R (+27.1) · D 35.7% · R 62.9% · Other 1.4%
- 2008→2024 swing
- -31.5pp toward R · 2008: 4.3pp · 2024: -27.1pp
- All cycles
- 2024: R+27.1 2020: R+22.6 2016: R+22.1 2012: D+1.0 2008: D+4.3
Not yet ingested
- Civics
- —
Market trends
- HPI YoY
- ▼ -116.72%
- Current HPI
- 163.3496
- Rent YoY
- —
- Metro
- —
- State GDP YoY
- ▲ 1.37%
- F500 in state
- 28
Industry mix (Fortune 500 HQ in MI)
| Industry | F500 HQs | Revenue |
|---|---|---|
| Automotive Parts | 3 | $48B |
|
||
| Automotive | 2 | $372B |
|
||
| Chemicals | 1 | $45B |
|
||
| Automotive Retail | 1 | $29B |
|
||
| Healthcare / Medical Devices | 1 | $23B |
|
||
| Automotive Technology | 1 | $20B |
|
||
Price history
+184.2% since first listed37 events — show timeline
- 2026-06-18 Listed $264,900 REALCOMP
- 2026-06-18 Listed $264,900 MiRealSource-MiMLS
- 2020-09-25 Sold (Public Records) $157,500 Public Records
- 2020-09-23 Sold (MLS) $157,500 MiRealSource-MiMLS
- 2020-09-23 Sold (MLS) $157,500 REALCOMP
- 2020-08-24 Pending — REALCOMP
- 2020-08-24 Pending — MiRealSource-MiMLS
- 2020-08-04 Price Changed $164,900 MiRealSource-MiMLS
- 2020-08-04 Price Changed $164,900 REALCOMP
- 2020-08-04 Relisted — REALCOMP
- 2020-08-04 Relisted — MiRealSource-MiMLS
- 2020-07-30 Pending — REALCOMP
- 2020-07-30 Pending — MiRealSource-MiMLS
- 2020-07-14 Price Changed $169,900 MiRealSource-MiMLS
- 2020-07-14 Price Changed $169,900 REALCOMP
- 2020-07-07 Relisted — REALCOMP
- 2020-07-07 Relisted — MiRealSource-MiMLS
- 2020-06-29 Pending — REALCOMP
- 2020-06-29 Pending — MiRealSource-MiMLS
- 2020-06-26 Listed $174,900 REALCOMP
- 2020-06-19 Coming Soon $174,900 REALCOMP
- 2020-06-19 Listed $174,900 MiRealSource-MiMLS
- 2009-07-25 Listing Removed — MiRealSource-MiMLS
- 2009-07-25 Listing Removed — REALCOMP
- 2007-02-07 Sold (Public Records) $142,000 Public Records
- 2007-02-01 Sold (MLS) $142,000 REALCOMP
- 2007-02-01 Sold (MLS) $142,000 MiRealSource-MiMLS
- 2006-12-30 Listing Removed — MiRealSource-MiMLS
- 2006-11-01 Listed $149,900 REALCOMP
- 2006-11-01 Listed $149,900 MiRealSource-MiMLS
- 2006-06-08 Listed $142,900 MiRealSource-MiMLS
- 2006-06-08 Listed $142,900 REALCOMP
- 2005-10-15 Listing Removed — REALCOMP
- 2005-10-15 Listing Removed — MiRealSource-MiMLS
- 2005-07-15 Listed $147,900 REALCOMP
- 2005-07-15 Listed $147,900 MiRealSource-MiMLS
- 1996-09-04 Sold (Public Records) $93,200 Public Records
Property tax history
-4.0%/yrLatest (2025): $968 · -57.7% YoY. Source: county tax records.
Cash-flow waterfall
monthlySold comps — $/sqft
last 12 mo · ≤1 miLoading sold comps…