185 Monarch Ln · Branson, MO
Flood risk 1/10 · Minimal
- FEMA flood zone
- X (unshaded)
- Chance of flooding over 30 yrs
- 0.0%
- Est. flood insurance / yr
- $473 – $860
Fire risk 4/10 · Minor
- Est. fire insurance / yr
- $1,054 – $1,958
Heat risk 5/10 · Moderate
- Hot days now (above 105°F)
- 7 days/yr
- Hot days in 30 yrs
- 20 days/yr
Wind risk 2/10 · Minimal
- Chance of severe wind over 30 yrs
- 0.0%
Air-quality risk 2/10 · Minimal
- Unhealthy air days now
- 0 days/yr
- Unhealthy air days in 30 yrs
- 1 days/yr
Risk factors via First Street. Map © Google.
Why this score? — see what drove the C- grade
The composite is a weighted blend of 9 inputs, each scored 0–100. Each bar is that input's sub-score; the figure is the points it added to the 100-point composite (weight × sub-score).
- Cash flow +19.1/30.0
- ARV discount +9.7/15.0
- 1% rule +6.0/10.0
- DSCR +6.0/10.0
- Schools +4.2/10.0
- Livability +3.9/5.0
- Rent growth +3.2/5.0
- Condition / age +2.5/5.0
- Appreciation +0.0/10.0
$94,000
🖨 Deal sheet (PDF) 📄 Offer letter ✓ Due diligence
Listing remarks MLS
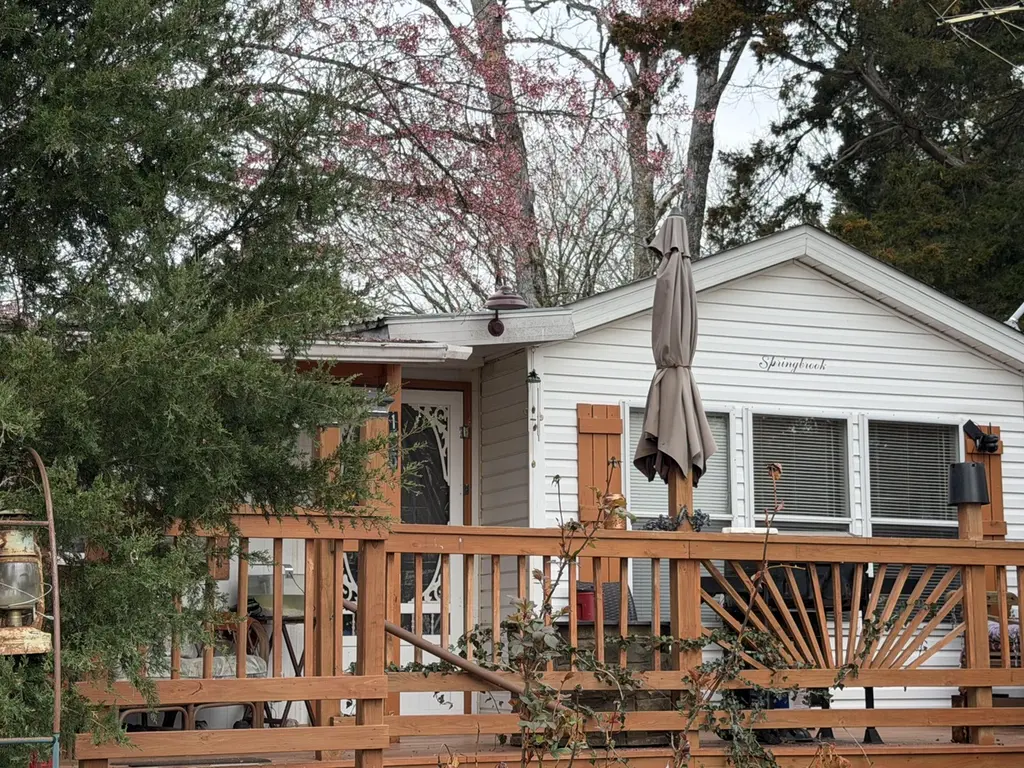
Charming 1 bedroom, 1 bathroom home located on the eastern outskirts of Branson, MO, offering a peaceful setting with convenient access to town. A fisherman's dream, this property sits within easy driving distance of three premier lakes--Lake Taneycomo (5.7 miles to boat ramp), Bull Shoals Lake (10 mi to ramp), and Table Rock Lake (14 mi to ramp)--providing endless opportunities for fishing and water recreation. The home features two comfortable living areas, a covered front porch perfect for relaxing, and beautifully maintained landscaping that blooms throughout the seasons. A spacious utility room doubles as a closet off the bedroom. A 10' x 20' carport and 10' x 10' storage shed are included, offering convenient parking and additional storage. Everyday conveniences like shopping, dining, and fuel are just minutes away at the Cross Creek Center near T Highway, and Holiday Hills Golf Course is less than five minutes away for those who enjoy time on the greens. A great opportunity for a full-time residence, weekend getaway, or investment property in the heart of the Ozarks.
Key facts
- Three premier lakes
- Covered front porch
- Carport
Tags
Neighborhood map
What this means for you Summary
Snapshot
- This is a 1-bed/1.0-bath other listed at $94k.
Deal economics
- At list price, monthly cash flow is $99 ($1k/yr) — positive.
- The deal already cash-flows at list — no discount required.
- Meets the 1% rule at list price ($1k rent vs $94k).
- Recommended offer: $86k (9.0% below list) — sets the bar for market timing.
- Cap rate 7.6% vs local median 2.5% in Branson — top-decile yield for the area; either an underpriced asset or a hidden risk that comps aren't pricing in. Stress-test before assuming the spread holds.
Location & tenants
- Location reads 77/100 on livability (#32 in MO, #2,940 nationally) — a middle-class / working-renter tenant base. Strengths: commute A+, cost of living A+, health & safety A+; Watch: employment C-, crime F.
- Branson R-IV (rural): math 48% / reading 52% proficiency, ranked #44 of 324 in MO (top 14%) — acceptable for families but not a draw, mixed tenant base, ~2y average lease.
- Market conditions: Rents rising (+2.9%/yr); 1048 active listings in the ZIP; 331 units permitted in Taney County in 2024 (50 in 5+ unit buildings).
Forward outlook
- Local home prices are declining (-3.0%/yr); year-one equity from $650 of loan paydown is wiped out by about $3k of value loss. Plan a longer hold.
- Taney County population projected at +17% by 2050 — long-run rental-demand tailwind backs the buy-and-hold thesis.
Negotiation context
- It's been on market 99 days — a 9% lower offer ($86k) is reasonable based on typical stale-listing flexibility.
- 2 sale attempts since 2y ago; this cycle's ask has dropped $6k (6%) from the opening price — seller is motivated, your offer sets the floor, not the list.
Risks & watch-outs
- Climate carrying-cost: extreme-heat days projected 7→20/yr by 2055 (HVAC capex compounding) — expect insurance premiums to compound above CPI over the hold.
Questions for the listing agent
- It's been on market 99 days. Have you received any prior offers? Is the seller open to a 9% concession, seller financing, or rate buy-down credit?
- What does the HOA fee cover, when was the last increase, and are there any pending special assessments or reserve-fund shortfalls?
- Why hasn't it sold? Are there any deal-killer items the seller is aware of (foundation, flood, title, zoning, code violations)?
- Is there a deadline driving the sale (1031 exchange, divorce, estate, relocation)? That informs how much negotiation room exists.
- Crime grade is F in this area — have there been break-ins, vandalism, or insurance claims at this property in the last 3 years? What carrier currently insures it and at what premium?
- What's the average days-on-market for RENTAL listings here right now (not sales)? A rising rental-DOM trend means longer vacancies and softer asking-rent achievability than the comps imply.
- What's the recent tenant-quality profile in this submarket — average credit score on applications, eviction rate, late-payment / NSF rate, and stable-employment percentage? A property-management company in the area should have these aggregated.
- How much new for-sale + rental construction is in the pipeline within 1–3 miles? Heavy new supply typically softens prices + rents 12–24 months out; constrained supply supports both.
Investment metrics
- 1% rule
- 1.10% ✓
- Cap rate
- 7.56%
- Cash-on-cash
- 4.52%
- DSCR
- 1.20
- GRM
- 7.6
CMA / ARV
- ARV (median comp)
- $98,900
- List price
- $94,000
- Delta
- -4.95%
- Verdict
- FAIR
- Comps
- 1 within 2.0 mi
Projected returns pro-forma
-3.0% appreciation · 2.9% rent growth · sell at horizon
- IRR
- -9.3%
- Equity multiple
- 0.66×
- Total profit
- $-8,961
- Equity at exit
- $14,016
- IRR
- 0.1%
- Equity multiple
- 1.01×
- Total profit
- $142
- Equity at exit
- $8,127
Cash invested: $26,320 (down + closing). Projections, not guarantees.
Landlord ↔ Tenant lean methodology
- Overall (STATE)
- 81 Strongly Landlord-Friendly
- State Missouri
- 81 Strongly Landlord-Friendly · R+10
- County
- — inherits STATE
- City
- — inherits STATE
ZIP-level market 65616
- Home prices YoY
- -24.3%
- Rents YoY
- 2.9%
- Active inventory
- 1048
- Price-to-rent
- 7.6×
Monthly cashflow live
- Estimated rent
- $1,036 medium interval (Pro) →
- Mortgage (P&I)
- −$493
- Tax est. 1.5%
- −$118 /mo · $1,410/yr
- Insurance
- −$39
- HOA
- −$70
- Vacancy / Maint / Mgmt
- −$218
- Net cashflow
- $99
Break-even live
Sensitivity live
| Price | -10% $164 | -5% $132 | +0% $99 | +5% $67 | +10% $34 |
|---|---|---|---|---|---|
| Rent | -10% $17 | -5% $58 | +0% $99 | +5% $140 | +10% $181 |
| Rate | -1.0pp $147 | -0.5pp $123 | base $99 | +0.5pp $75 | +1.0pp $50 |
UW: 25.0% down · 7.5% · 30yr · 1.5% tax · 5.0% vac · 8.0% maint · 8.0% mgmt
Financing live
Cash to close
- Down payment
- $23,500
- Closing costs
- $2,820
- Reserves months
- —
- Total cash needed
- —
Loan-product check · same deal, 3 products live
Conventional
25% down · 7.5% · 30yr
- Down + closing
- —
- Monthly P&I
- —
- Monthly cashflow
- —
- DSCR
- —
- Eligible?
- —
Personal DTI + credit; lowest rate.
DSCR
20% down · 8.5% · 30yr
- Down + closing
- —
- Monthly P&I
- —
- Monthly cashflow
- —
- DSCR
- —
- Eligible?
- —
No personal income docs; deal must DSCR.
Hard money
10% down · 12.0% · 12mo
- Down + closing
- —
- Monthly P&I
- —
- Monthly cashflow
- —
- DSCR
- —
- Eligible?
- —
Short-term bridge; refi at stabilization.
HOA detail
- Monthly dues
- $70 · $840/yr
- Likely covers
- waterlandscaping
Listing history 22 events
-
2026-06-19days on market $94,000 Active 99 DOM
-
2026-06-18days on market $94,000 Active 98 DOM
-
2026-06-17days on market $94,000 Active 97 DOM
-
2026-06-16days on market $94,000 Active 96 DOM
-
2026-06-15days on market $94,000 Active 95 DOM
-
2026-06-14days on market $94,000 Active 93 DOM
-
2026-06-12days on market $94,000 Active 92 DOM
-
2026-06-09days on market $94,000 Active 89 DOM
-
2026-06-08days on market $94,000 Active 88 DOM
-
2026-06-07days on market $94,000 Active 87 DOM
-
2026-06-03days on market $94,000 Active 83 DOM
-
2026-06-02days on market $94,000 Active 82 DOM
-
2026-06-01days on market $94,000 Active 81 DOM
-
2026-05-31days on market $94,000 Active 80 DOM
-
2026-05-30days on market $94,000 Active 79 DOM
-
2026-03-27price $94,000 1090-char remark
Show marketing remark (1090 chars)
Charming 1 bedroom, 1 bathroom home located on the eastern outskirts of Branson, MO, offering a peaceful setting with convenient access to town. A fisherman's dream, this property sits within easy driving distance of three premier lakes--Lake Taneycomo (5.7 miles to boat ramp), Bull Shoals Lake (10 mi to ramp), and Table Rock Lake (14 mi to ramp)--providing endless opportunities for fishing and water recreation. The home features two comfortable living areas, a covered front porch perfect for relaxing, and beautifully maintained landscaping that blooms throughout the seasons. A spacious utility room doubles as a closet off the bedroom. A 10' x 20' carport and 10' x 10' storage shed are included, offering convenient parking and additional storage. Everyday conveniences like shopping, dining, and fuel are just minutes away at the Cross Creek Center near T Highway, and Holiday Hills Golf Course is less than five minutes away for those who enjoy time on the greens. A great opportunity for a full-time residence, weekend getaway, or investment property in the heart of the Ozarks.
-
2026-03-12$99,900 Active 1090-char remark
Show marketing remark (1090 chars)
Charming 1 bedroom, 1 bathroom home located on the eastern outskirts of Branson, MO, offering a peaceful setting with convenient access to town. A fisherman's dream, this property sits within easy driving distance of three premier lakes--Lake Taneycomo (5.7 miles to boat ramp), Bull Shoals Lake (10 mi to ramp), and Table Rock Lake (14 mi to ramp)--providing endless opportunities for fishing and water recreation. The home features two comfortable living areas, a covered front porch perfect for relaxing, and beautifully maintained landscaping that blooms throughout the seasons. A spacious utility room doubles as a closet off the bedroom. A 10' x 20' carport and 10' x 10' storage shed are included, offering convenient parking and additional storage. Everyday conveniences like shopping, dining, and fuel are just minutes away at the Cross Creek Center near T Highway, and Holiday Hills Golf Course is less than five minutes away for those who enjoy time on the greens. A great opportunity for a full-time residence, weekend getaway, or investment property in the heart of the Ozarks.
-
2024-12-02$140,000 Active
-
2009-09-18soldstatus
-
2008-11-25soldstatus
-
2005-11-14soldstatus
-
1995-03-29soldstatus
ⓘ Source: listings_history table (triggers on properties + properties_extension) + one-shot
backfill from property_details.listing_events for pre-trigger history.
Climate risk First Street
- Flood 1/10 Low FEMA zone X (unshaded) · 0% chance over 30 yrs
- Wildfire 4/10 Moderate
- Heat 5/10 Major 7 d/yr ≥105°F today · 20 d/yr by 30 yrs out
- Wind 2/10 Low 0% chance of damaging wind over 30 yrs
- Air quality 2/10 Low 0 unhealthy d/yr today · 1 by 30 yrs out
Nearby sold comps map
Loading sold comps map…
Walkable amenities ~0.75 mi
Loading nearby amenities…
Taxation est. · year 1
- Rental income
- $12,437
- − Mortgage interest
- −$5,265
- − Property taxes
- −$1,410
- − Insurance
- −$470
- − Repairs & maintenance
- −$995
- − Management
- −$995
- − HOA
- −$840
- − Depreciation
- −$2,735
- Taxable loss
- −$273
- Est. tax savings @ 24.0%
- +$65
- After-tax cash flow
- $1,256/yr
For passive investors: Depreciation is non-cash, so a rental often shows a tax loss while cash-flowing — sheltering income. Rental losses are passive: they offset passive income freely, and up to $25,000/yr can offset ordinary (W-2) income if you actively participate and your MAGI is under $100k (phasing out to $0 by $150k); unused losses carry forward. On sale, claimed depreciation is recaptured at up to 25%, and gains may owe capital-gains tax (a 1031 exchange can defer both). Figures are a year-1 estimate at your 24.0% rate — not tax advice; consult a CPA.
Schools (NCES district)
- District
- Branson R-IV
- NCES district ID
- 2905760
- Math proficiency
- 48% ▼ -6.00%
- Reading proficiency
- 52% ▼ -3.00%
- Median HH income
- $41,473
- Composite
- 41.96/100
- National rank
- #3347
- State rank
- #44 of 324 in MO
Livability — Branson
- Score
- 77/100
- State rank
- #32
- US rank
- #2940
Category grades
Schools grade is shown separately in the Schools card above.
Census & demographics
- County
- Taney County · 28,460 people
- City population
- 28,460
- Metro
- Branson, MO
- Population (ZIP)
- 28,460
- Household income
- $60,489
- Rent vs Own
- Severe rent burden
- 1065.0
Population outlook (Taney County) Hauer SSP2
- Today (2025)
- 59,017 people
- By 2030
- 61,235 · +3.8%
- By 2040
- 65,225 · +10.5%
- By 2050
- 68,842 · +16.6%
- By 2075
- 77,705 · +31.7%
- By 2100
- 82,002 · +38.9%
Race, ethnicity, and origin ACS 2023
- Neighborhood character
- Predominantly White (82%)
- Race & ethnicity
- White 82% Two or more races 10% Hispanic / Latino 10% Black 2% Asian 2%
- Hispanic origin (detail)
- Mexican 6% Puerto Rican 2%
- Common ancestry
- Italian 4% Lithuanian 3% Slovak 2%
- Foreign-born
- 5% · Canada
- Languages at home
- 89% English-only · Spanish 7% Other Indo-European 1% Russian/Polish/Slavic 1%
Political lean MEDSL · Taney
- 2024 margin
- Solid R (+59.3) · D 19.9% · R 79.2%
- 2008→2024 swing
- -22.2pp toward R · 2008: -37.2pp · 2024: -59.3pp
- All cycles
- 2024: R+59.3 2020: R+57.7 2016: R+59.3 2012: R+47.4 2008: R+37.2
Not yet ingested
- Civics
- —
Market trends
- HPI YoY
- ▼ -64.45%
- Current HPI
- 200.8392
- Rent YoY
- ▲ 2.90%
- Metro
- Branson, MO
- State GDP YoY
- ▲ 1.84%
- F500 in state
- 20
Industry mix (Fortune 500 HQ in MO)
| Industry | F500 HQs | Revenue |
|---|---|---|
| Healthcare | 1 | $163B |
|
||
| Insurance | 1 | $21B |
|
||
| Industrial Technology | 1 | $17B |
|
||
| Retail | 1 | $16B |
|
||
| Industrial Distribution | 1 | $10B |
|
||
| Utilities | 1 | $9B |
|
||
Price history
-32.9% since first listed7 events — show timeline
- 2026-03-27 Price Changed $94,000 SOMO
- 2026-03-12 Listed $99,900 SOMO
- 2024-12-02 Listed $140,000 SOMO
- 2009-09-18 Sold (Public Records) — Public Records
- 2008-11-25 Sold (Public Records) — Public Records
- 2005-11-14 Sold (Public Records) — Public Records
- 1995-03-29 Sold (Public Records) — Public Records
Property tax history
+2.4%/yrLatest (2025): $130 · -0.9% YoY. Source: county tax records.
Cash-flow waterfall
monthlySold comps — $/sqft
last 12 mo · ≤1 miLoading sold comps…