 🏷️ Likely Rental
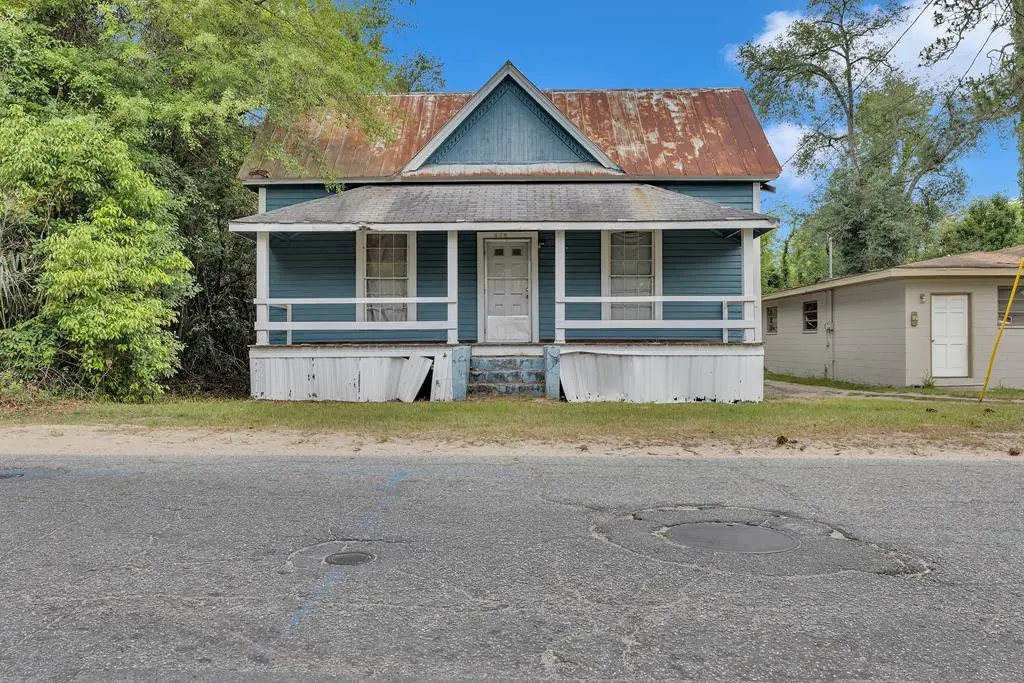
418 West St · Valdosta, GA
Flood risk 1/10 · Minimal
- FEMA flood zone
- X (unshaded)
- Chance of flooding over 30 yrs
- 0.0%
- Est. flood insurance / yr
- $507 – $1,088
Fire risk 5/10 · Moderate
- Est. fire insurance / yr
- $963 – $1,789
Heat risk 8/10 · Major
- Hot days now (above 108°F)
- 7 days/yr
- Hot days in 30 yrs
- 19 days/yr
Wind risk 9/10 · Severe
- Chance of severe wind over 30 yrs
- 99.0%
Air-quality risk 6/10 · Moderate
- Unhealthy air days now
- 11 days/yr
- Unhealthy air days in 30 yrs
- 12 days/yr
Risk factors via First Street. Map © Google.
Why this score? — see what drove the B+ grade
The composite is a weighted blend of 9 inputs, each scored 0–100. Each bar is that input's sub-score; the figure is the points it added to the 100-point composite (weight × sub-score).
- Cash flow +30.0/30.0
- ARV discount +15.0/15.0
- 1% rule +10.0/10.0
- DSCR +10.0/10.0
- Rent growth +4.6/5.0
- Livability +3.0/5.0
- Condition / age +2.5/5.0
- Schools +1.5/10.0
- Appreciation +0.0/10.0
$33,000
🖨 Deal sheet (PDF) 📄 Offer letter ✓ Due diligence
Listing remarks
Discover your next investment opportunity in the heart of Valdosta. This vacant, Sold-As-Is property is perfectly positioned for investors seeking their next rental, flip, or long-term hold. With immediate access at closing and no tenant delays, renovation crews can begin work without interruption. The bonus room offers flexibility—add a closet if you need a 3rd bedroom to maximize rental potential and resale value. Located in a high-demand rental corridor surrounded by active revitalization, this property offers strong potential for value-add strategies. Whether you're expanding your portfolio or securing your next project, this home delivers a straightforward path to your investment
Key facts
- 8,276 sq ft lot
- Built 1953
- Listed 47 days
Property features AI
Exterior
- Utilities: Public water; Public sewer
- Home design: Single-family residence; One-story
- Construction: Wood siding exterior; Metal roof
- Exterior features: Covered patio/porch
Interior
- Flooring: Carpet; Tile
- Bathrooms: 1 full bathroom
- Interior features: Carpet flooring; Tile flooring
Neighborhood map
What this means for you Summary
Snapshot
- This is a 2-bed/1.0-bath single-family listed at $33k.
Deal economics
- At list price, monthly cash flow is $590 ($7k/yr) — positive.
- The deal already cash-flows at list — no discount required.
- Meets the 1% rule at list price ($1k rent vs $33k).
- Recommended offer: $32k (3.0% below list) — sets the bar for market timing.
- Cap rate 27.8% vs local median 4.3% in Valdosta — top-decile yield for the area; either an underpriced asset or a hidden risk that comps aren't pricing in. Stress-test before assuming the spread holds.
Location & tenants
- Location reads 60/100 on livability (#392 in GA) — a middle-class / working-renter tenant base. Strengths: cost of living A+, health & safety A+, housing A-; Watch: crime F, amenities F, commute F.
- Valdosta City (urban): math 15% / reading 22% proficiency, ranked #149 of 174 in GA (top 86%) — low school quality limits family demand, transient renter base, plan for 1-2y turnover; 74% free/reduced lunch — lower-income household profile, screen leases tightly.
- Zoned schools: S.L. Mason Elementary School (math 24% / reading 22%, grade F, #797 of 1,228 statewide, top 65%, 887 students, 92% FRL); Valdosta Middle School (math 17% / reading 32%, grade F, #301 of 470 statewide, top 66%, 1,060 students, 95% FRL); Valdosta High School (math 7% / reading 24%, grade F, #290 of 424 statewide, top 69%, 2,381 students, 95% FRL) — zoned schools average 94% FRL vs 74% district-wide (20 pts higher); higher-poverty schools than district average — tighter screening recommended.
- Market conditions: Rents rising fast (+8.3%/yr); 201 active listings in the ZIP; 36 comparable units currently listed for rent nearby; rentals at typical pace (median 23d on market — plan ~3-4 weeks tenant-placement turnaround); lower-income renter base — watch delinquency; 896 units permitted in Lowndes County in 2024 (0 in 5+ unit buildings).
- This rent runs 33% of the median local income ($36k/yr) — at the standard rent-burdened threshold; future hikes will face affordability resistance.
Forward outlook
- Local home prices are declining (-3.0%/yr); year-one equity from $228 of loan paydown is wiped out by about $990 of value loss. Plan a longer hold.
- Lowndes County population projected at +10% by 2050 — modest demand growth; plan on rents tracking national, not racing it.
- At projected returns (-3.0% appreciation + 8.0% rent growth), your $9k cash investment doubles in ~2 years — after that, you're playing with house money.
Negotiation context
- It's been on market 47 days — a 3% lower offer ($32k) is reasonable based on typical stale-listing flexibility.
Risks & watch-outs
- Watch-outs: built in 1953 — expect roof / HVAC / electrical / plumbing capex.
- Climate carrying-cost: severe wind risk, 99% chance of damaging wind over 30y; moderate wildfire risk; extreme-heat days projected 7→19/yr by 2055 (HVAC capex compounding) — expect insurance premiums to compound above CPI over the hold.
Questions for the listing agent
- It's been on market 47 days. Have you received any prior offers? Is the seller open to a 3% concession, seller financing, or rate buy-down credit?
- Built in 1953 — when were the roof, HVAC, electrical panel, plumbing, and water heater last replaced?
- Is there a deadline driving the sale (1031 exchange, divorce, estate, relocation)? That informs how much negotiation room exists.
- Schools are F-rated, which usually means shorter tenancies and higher turnover. Who's the typical renter profile here, and what's been the actual vacancy rate?
- Crime grade is F in this area — have there been break-ins, vandalism, or insurance claims at this property in the last 3 years? What carrier currently insures it and at what premium?
- What's the average days-on-market for RENTAL listings here right now (not sales)? A rising rental-DOM trend means longer vacancies and softer asking-rent achievability than the comps imply.
- What's the recent tenant-quality profile in this submarket — average credit score on applications, eviction rate, late-payment / NSF rate, and stable-employment percentage? A property-management company in the area should have these aggregated.
- How much new for-sale + rental construction is in the pipeline within 1–3 miles? Heavy new supply typically softens prices + rents 12–24 months out; constrained supply supports both.
Investment metrics
- 1% rule
- 3.04% ✓
- Cap rate
- 27.76%
- Cash-on-cash
- 76.67%
- DSCR
- 4.41
- GRM
- 2.7
CMA / ARV
- ARV (median comp)
- $52,990
- List price
- $33,000
- Delta
- -37.72%
- Verdict
- UNDERPRICED
- Comps
- 20 within 1.0 mi
Show comp detail 7 sales within ~0.75 mi
| Address | Dist | Beds/Ba | Sqft | Sold | Price | $/sf | Match |
|---|---|---|---|---|---|---|---|
| 410 West Adair St | 0.40mi | 2/1.0 | 894 (-13%) | 2mo | $15,000 | $17 | 59 |
| 1007 Nicholas Dr | 0.45mi | 3/1.0 (+1) | 994 (-3%) | 13mo | $75,000 | $75 | 59 |
| 210 Walnut St | 0.20mi | 2/2.0 | 953 (-7%) | 22mo | $25,000 | $26 | 57 |
| 1218 Dunwoody Dr | 0.63mi | 3/1.0 (+1) | 1,009 (-1%) | 12mo | $71,500 | $71 | 53 |
| 211/217 Eugene | 0.39mi | 2/2.0 | 1,059 (+4%) | 23mo | $38,000 | $36 | 53 |
| 1012 W Gordon St | 0.63mi | 3/2.0 (+1) | 1,118 (+9%) | 16mo | $75,000 | $67 | 33 |
| 1200 Melissa Dr | 0.70mi | 3/2.0 (+1) | 1,161 (+14%) | 14mo | $136,000 | $117 | 24 |
Match score weights: distance 35% · size 25% · config 20% · recency 20%. Top-matched comps best support the ARV.
Projected returns pro-forma
-3.0% appreciation · 8.0% rent growth · sell at horizon
- IRR
- 82.1%
- Equity multiple
- 5.06×
- Total profit
- $37,548
- Equity at exit
- $4,920
- IRR
- 86.6%
- Equity multiple
- 12.39×
- Total profit
- $105,210
- Equity at exit
- $2,853
Cash invested: $9,240 (down + closing). Projections, not guarantees.
Landlord ↔ Tenant lean methodology
- Overall (STATE)
- 90 Strongly Landlord-Friendly
- State Georgia
- 90 Strongly Landlord-Friendly · R+3
- County
- — inherits STATE
- City
- — inherits STATE
ZIP-level market 31601
- Home prices YoY
- -31.2%
- Rents YoY
- 8.3%
- Active inventory
- 201
- Price-to-rent
- 2.7×
Monthly cashflow live
- Estimated rent
- $1,002 high interval (Pro) →
- Mortgage (P&I)
- −$173
- Tax from tax record
- −$14 /mo · $173/yr
- Insurance
- −$14
- HOA
- −$0
- Vacancy / Maint / Mgmt
- −$210
- Net cashflow
- $590
Break-even live
Sensitivity live
| Price | -10% $609 | -5% $600 | +0% $590 | +5% $581 | +10% $572 |
|---|---|---|---|---|---|
| Rent | -10% $511 | -5% $551 | +0% $590 | +5% $630 | +10% $670 |
| Rate | -1.0pp $607 | -0.5pp $599 | base $590 | +0.5pp $582 | +1.0pp $573 |
UW: 25.0% down · 7.5% · 30yr · 1.5% tax · 5.0% vac · 8.0% maint · 8.0% mgmt
Financing live
Cash to close
- Down payment
- $8,250
- Closing costs
- $990
- Reserves months
- —
- Total cash needed
- —
Loan-product check · same deal, 3 products live
Conventional
25% down · 7.5% · 30yr
- Down + closing
- —
- Monthly P&I
- —
- Monthly cashflow
- —
- DSCR
- —
- Eligible?
- —
Personal DTI + credit; lowest rate.
DSCR
20% down · 8.5% · 30yr
- Down + closing
- —
- Monthly P&I
- —
- Monthly cashflow
- —
- DSCR
- —
- Eligible?
- —
No personal income docs; deal must DSCR.
Hard money
10% down · 12.0% · 12mo
- Down + closing
- —
- Monthly P&I
- —
- Monthly cashflow
- —
- DSCR
- —
- Eligible?
- —
Short-term bridge; refi at stabilization.
Rent comps 36 comps
| Address | Beds | Baths | Sqft | Rent | $/sqft | DOM | Units | Dist |
|---|---|---|---|---|---|---|---|---|
| 808 Lilly St Apt B Valdosta, GA | 3.0 | 1.0 | 872 | $895 | $1.03 | 45d | 1 | 0.53mi |
| 200 W Adair St Unit A9 Valdosta, GA | 1.0 | 1.0 | 900 | $895 | $0.99 | 22d | 1 | 0.55mi |
| 1004 N Oak St Valdosta, GA | 1.0–2.0 | 1.0 | 866 | $750 | $0.87 | 22d | 3 | 0.59mi |
| 1029 Johnson St Valdosta, GA | 2.0 | 1.0 | 986 | $900 | $0.91 | 45d | 1 | 0.60mi |
| 1005 N Oak St Valdosta, GA | 3.0 | 1.0 | 1087 | $795 | $0.73 | 45d | 1 | 0.61mi |
| 1010 N Toombs St Valdosta, GA | 2.0 | 1.5 | 1056 | $1,000 | $0.95 | 22d | 3 | 0.65mi |
| 205 E Adair St Unit 4 Valdosta, GA | 1.0 | 1.0 | 700 | $550 | $0.79 | 45d | 1 | 0.79mi |
| 1400 W Magnolia St Valdosta, GA | 1.0–2.0 | 1.0–2.0 | 1180 | $1,600 | $1.36 | 22d | 1 | 0.81mi |
| 707 Baytree Dr Apt 1 Valdosta, GA | 3.0 | 3.0 | 1222 | $675 | $0.55 | 45d | 1 | 0.96mi |
| 1505 Lankford Dr Valdosta, GA | 2.0–3.0 | 2.0–3.0 | 1166 | $1,137 | $0.97 | 22d | 1 | 1.03mi |
| 1400 Baytree Dr Valdosta, GA | 2.0–4.0 | 2.0–4.0 | 1277 | $549 | $0.43 | 45d | 1 | 1.07mi |
| 507 Roberts St Apt B Valdosta, GA | 2.0 | 2.0 | 1114 | $1,200 | $1.08 | 22d | 1 | 1.12mi |
| 1314 Hastings Dr Apt A2 Valdosta, GA | 2.0 | 2.5 | 1100 | $995 | $0.90 | 22d | 1 | 1.12mi |
| 1314 Hastings Dr Unit C4 Valdosta, GA | 2.0 | 2.5 | 1200 | $1,095 | $0.91 | 45d | 1 | 1.12mi |
| 1307 Melody Ln Valdosta, GA | 2.0 | 1.0 | 1025 | $1,050 | $1.02 | 22d | 1 | 1.16mi |
| 1531 Woodard St Apt C3 Valdosta, GA | 2.0 | 2.5 | 900 | $995 | $1.11 | 22d | 1 | 1.17mi |
| 522 Green St Valdosta, GA | 2.0 | 1.0 | 1020 | $900 | $0.88 | 22d | 1 | 1.19mi |
| 1469 Green St Valdosta, GA | 2.0 | 2.5 | 1139 | $1,000 | $0.88 | 22d | 1 | 1.19mi |
| 1537 Woodard St Unit B Valdosta, GA | 2.0 | 1.5 | 1020 | $900 | $0.88 | 22d | 1 | 1.19mi |
| 1455 Green St Unit A Valdosta, GA | 2.0 | 1.5 | 1048 | $900 | $0.86 | 22d | 1 | 1.20mi |
| 1506 Slater St Unit 7 Valdosta, GA | 2.0 | 1.5 | 1037 | $695 | $0.67 | 45d | 1 | 1.24mi |
| 1612 Garland Pl Valdosta, GA | 3.0 | 2.0 | 1268 | $1,295 | $1.02 | 45d | 1 | 1.26mi |
| 1709 Azalea Dr Apt B Valdosta, GA | 2.0 | 1.0 | 775 | $1,250 | $1.61 | 22d | 1 | 1.26mi |
| 607 Parker Mathis Dr Valdosta, GA | 3.0 | 1.5 | 1395 | $1,495 | $1.07 | 45d | 1 | 1.28mi |
| 807 Cherokee Ave Unit A Valdosta, GA | 2.0 | 2.5 | 1200 | $2,000 | $1.67 | 45d | 1 | 1.28mi |
| 1603 Victory St Valdosta, GA | 2.0 | 2.0 | 874 | $795 | $0.91 | 22d | 6 | 1.30mi |
| 1018 Cherokee St Valdosta, GA | 3.0 | 1.5 | 1225 | $1,375 | $1.12 | 22d | 1 | 1.30mi |
| 1509 Pine St Valdosta, GA | 2.0 | 1.0–1.5 | 950 | $1,140 | $1.20 | 22d | 2 | 1.32mi |
| 1602 Victory St Unit 1602 C Valdosta, GA | 2.0 | 2.0 | 865 | $795 | $0.92 | 22d | 1 | 1.33mi |
| 604 E Brookwood Dr Valdosta, GA | 2.0 | 1.0 | 720 | $995 | $1.38 | 45d | 1 | 1.33mi |
| 1755 Poplar St Unit B Valdosta, GA | 2.0 | 1.0 | 840 | $950 | $1.13 | 22d | 1 | 1.42mi |
| 207 E Moore St Unit L Valdosta, GA | 1.0 | 1.0 | 850 | $700 | $0.82 | 22d | 1 | 1.42mi |
| 207 E Moore St Unit J Valdosta, GA | 1.0 | 1.0 | 850 | $700 | $0.82 | 45d | 1 | 1.42mi |
| 1704 N Patterson St Unit 4 Valdosta, GA | 2.0 | 2.0 | 1100 | $950 | $0.86 | 45d | 1 | 1.44mi |
| 805 Harmon Dr Valdosta, GA | 2.0–3.0 | 2.0–3.0 | 1100 | $1,425 | $1.30 | 22d | 6 | 1.49mi |
| 1609 Marion St Unit B Valdosta, GA | 2.0 | 1.0 | 945 | $895 | $0.95 | 22d | 1 | 1.50mi |
Listing history 20 events
-
2026-06-21days on market $33,000 Active 47 DOM
-
2026-06-19days on market $33,000 Active 45 DOM
-
2026-06-18days on market $33,000 Active 44 DOM
-
2026-06-17days on market $33,000 Active 43 DOM
-
2026-06-16days on market $33,000 Active 42 DOM
-
2026-06-15days on market $33,000 Active 41 DOM
-
2026-06-14days on market $33,000 Active 39 DOM
-
2026-06-13pricedays on market $33,000 Active 38 DOM
-
2026-06-10days on market $39,900 Active 36 DOM
-
2026-06-09days on market $39,900 Active 35 DOM
-
2026-06-08days on market $39,900 Active 34 DOM
-
2026-06-07days on market $39,900 Active 33 DOM
-
2026-06-05days on market $39,900 Active 30 DOM
-
2026-06-03days on market $39,900 Active 29 DOM
-
2026-06-02days on market $39,900 Active 28 DOM
-
2026-06-01days on market $39,900 Active 27 DOM
-
2026-05-31days on market $39,900 Active 26 DOM
-
2026-05-30days on market $39,900 Active 25 DOM
-
2026-05-08price $45,000 598-char remark
-
2026-05-05$54,900 Active 598-char remark
ⓘ Source: listings_history table (triggers on properties + properties_extension) + one-shot
backfill from property_details.listing_events for pre-trigger history.
Tax reassessment forecast GA · Resets to sale price
- Current annual tax
- $173 · $14/mo
- Projected year-2 tax
- $304 · $25/mo
- Expected delta
- +$130/yr (+$11/mo · 75.1%)
ⓘ Screening estimate from a state-policy table — verify with the county assessor before closing.
Climate risk First Street
- Flood 1/10 Low FEMA zone X (unshaded) · 0% chance over 30 yrs
- Wildfire 5/10 Major
- Heat 8/10 Severe 7 d/yr ≥108°F today · 19 d/yr by 30 yrs out
- Wind 9/10 Extreme 99% chance of damaging wind over 30 yrs
- Air quality 6/10 Major 11 unhealthy d/yr today · 12 by 30 yrs out
Nearby sold comps map
Loading sold comps map…
Walkable amenities ~0.75 mi
Loading nearby amenities…
Taxation est. · year 1
- Rental income
- $12,025
- − Mortgage interest
- −$1,849
- − Property taxes
- −$173
- − Insurance
- −$165
- − Repairs & maintenance
- −$962
- − Management
- −$962
- − Depreciation
- −$960
- Taxable income
- $6,954
- Est. tax owed @ 24.0%
- −$1,669
- After-tax cash flow
- $5,415/yr
For passive investors: Depreciation is non-cash, so a rental often shows a tax loss while cash-flowing — sheltering income. Rental losses are passive: they offset passive income freely, and up to $25,000/yr can offset ordinary (W-2) income if you actively participate and your MAGI is under $100k (phasing out to $0 by $150k); unused losses carry forward. On sale, claimed depreciation is recaptured at up to 25%, and gains may owe capital-gains tax (a 1031 exchange can defer both). Figures are a year-1 estimate at your 24.0% rate — not tax advice; consult a CPA.
Schools (NCES district)
- District
- Valdosta City
- NCES district ID
- 1305310
- Math proficiency
- 15% ▼ -12.00%
- Reading proficiency
- 22% ▼ -7.00%
- Median HH income
- $30,634
- Composite
- 14.79/100
- National rank
- #9388
- State rank
- #149 of 174 in GA
Livability — Valdosta
- Score
- 60/100
- State rank
- #392
- US rank
- #19544
Category grades
Schools grade is shown separately in the Schools card above.
Census & demographics
- Census place
- Valdosta, GA
- County
- Lowndes County · 107,801 people
- City population
- 91,859
- Metro
- Valdosta, GA
- Population (ZIP)
- 31,302
- Household income
- $36,111
- Rent vs Own
- Severe rent burden
- 2016.0
Population outlook (Lowndes County) Hauer SSP2
- Today (2025)
- 120,348 people
- By 2030
- 123,469 · +2.6%
- By 2040
- 128,482 · +6.8%
- By 2050
- 131,907 · +9.6%
- By 2075
- 139,080 · +15.6%
- By 2100
- 133,649 · +11.1%
Race, ethnicity, and origin ACS 2023
- Neighborhood character
- Diverse neighborhood (Simpson 0.57)
- Race & ethnicity
- Black 57% White 31% Hispanic / Latino 8% Two or more races 4% Asian 1%
- Hispanic origin (detail)
- Mexican 4%
- Common ancestry
- Slovak 1% Italian 1%
- Foreign-born
- 4% · Canada, South Korea
- Languages at home
- 92% English-only · Spanish 7% Korean 1%
Political lean MEDSL · Lowndes
- 2024 margin
- R (+18.0) · D 40.8% · R 58.8%
- 2008→2024 swing
- -8.6pp toward R · 2008: -9.4pp · 2024: -18.0pp
- All cycles
- 2024: R+18.0 2020: R+12.0 2016: R+18.2 2012: R+10.5 2008: R+9.4
Not yet ingested
- Civics
- —
Market trends
- HPI YoY
- ▼ -55.12%
- Current HPI
- 121.5948
- Rent YoY
- ▲ 8.34%
- Metro
- Valdosta, GA
- State GDP YoY
- ▲ 2.66%
- F500 in state
- 28
Industry mix (Fortune 500 HQ in GA)
| Industry | F500 HQs | Revenue |
|---|---|---|
| Paper / Packaging | 2 | $29B |
|
||
| Retail | 1 | $160B |
|
||
| Transportation / Logistics | 1 | $91B |
|
||
| Airlines | 1 | $62B |
|
||
| Consumer Goods | 1 | $47B |
|
||
| Utilities | 1 | $25B |
|
||
Price history
-39.9% since first listed4 events — show timeline
- 2026-06-12 Price Changed $33,000 SGMLS
- 2026-05-26 Price Changed $39,900 SGMLS
- 2026-05-08 Price Changed $45,000 SGMLS
- 2026-05-05 Listed $54,900 SGMLS
Property tax history
+1.9%/yrLatest (2025): $173 · +7.9% YoY. Source: county tax records.
Cash-flow waterfall
monthlySold comps — $/sqft
last 12 mo · ≤1 miLoading sold comps…