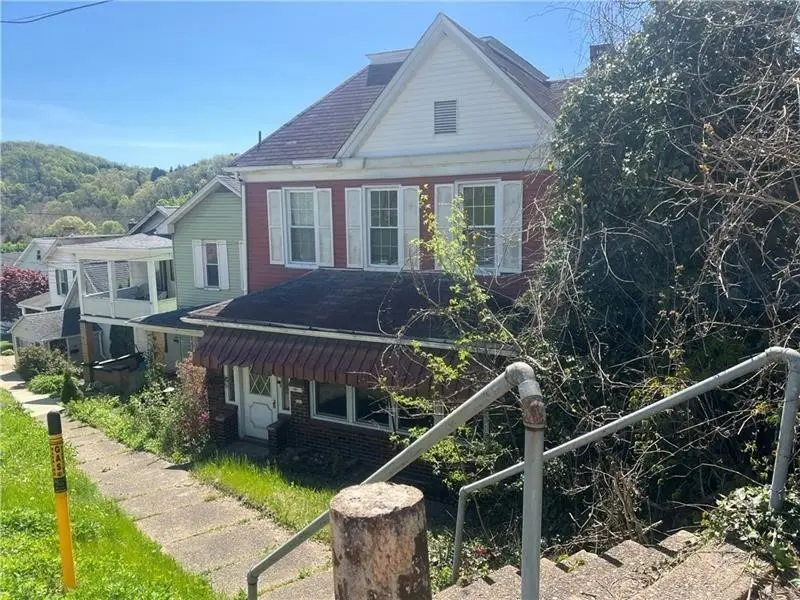
327 3rd St · Leechburg, PA
Flood risk 1/10 · Minimal
- FEMA flood zone
- X (unshaded)
- Chance of flooding over 30 yrs
- 0.0%
- Est. flood insurance / yr
- $507 – $1,088
Fire risk 1/10 · Minimal
- Est. fire insurance / yr
- $511 – $949
Heat risk 4/10 · Minor
- Hot days now (above 97°F)
- 7 days/yr
- Hot days in 30 yrs
- 18 days/yr
Wind risk 2/10 · Minimal
- Chance of severe wind over 30 yrs
- —
Air-quality risk 3/10 · Minor
- Unhealthy air days now
- 3 days/yr
- Unhealthy air days in 30 yrs
- 5 days/yr
Risk factors via First Street. Map © Google.
Why this score? — see what drove the C grade
The composite is a weighted blend of 9 inputs, each scored 0–100. Each bar is that input's sub-score; the figure is the points it added to the 100-point composite (weight × sub-score).
- Cash flow +15.0/30.0
- Appreciation +10.0/10.0
- ARV discount +7.5/15.0
- 1% rule +5.0/10.0
- DSCR +5.0/10.0
- Livability +3.9/5.0
- Schools +3.7/10.0
- Rent growth +2.5/5.0
- Condition / age +2.5/5.0
$24,000
🖨 Deal sheet (PDF) 📄 Offer letter ✓ Due diligence
Listing remarks MLS
* * Investor Special * * This spacious property is set up like a duplex and offers flexible options — finish it into a true two-unit investment property, or restore it into a stunning single-family home with incredible space and charm. Whether you’re looking for rental income or a grand residence, the potential here is endless. Bring your vision and make it yours! Cash or rehab loans only. Property needs renovations. Bring your contractor. Property being sold as-is.
Key facts
- 3,310 sq ft lot
- Built 1890
- Listed 65 days
Neighborhood map
What this means for you Summary
Snapshot
- This is a 3-bed/1.0-bath single-family listed at $24k.
Deal economics
- At list price, monthly cash flow is $897 ($11k/yr) — positive.
- The deal already cash-flows at list — no discount required.
- Meets the 1% rule at list price ($1k rent vs $24k).
- Recommended offer: $23k (6.0% below list) — sets the bar for market timing.
Location & tenants
- Location reads 78/100 on livability (#294 in PA, #2,608 nationally) — a middle-class / working-renter tenant base. Strengths: crime A+, cost of living A+, housing A+; Watch: amenities D, employment D, commute F.
- Leechburg Area SD (suburban): math 33% / reading 53% proficiency, ranked #303 of 539 in PA (top 56%) — families likely to look elsewhere, expect single-tenant / working-renter base with shorter leases.
- Market conditions: 33 active listings in the ZIP; 58 units permitted in Armstrong County in 2024 (20 in 5+ unit buildings).
Forward outlook
- In year one you build about $3k of equity ($166 loan paydown + $2k appreciation (10.0% local appreciation)).
- Armstrong County population projected at -27% by 2050 — secular population decline; favor cash flow + early exit over multi-decade hold.
- At projected returns (10.0% appreciation + 3.0% rent growth), your $7k cash investment doubles in ~1 year — after that, you're playing with house money.
- By year 10, paydown + projected appreciation supports a ~$31k cash-out refi (75% LTV) — recoverable capital for the next deal without selling this one.
Negotiation context
- It's been on market 65 days — a 6% lower offer ($23k) is reasonable based on typical stale-listing flexibility.
- 9 sale attempts since 15y ago with the ask held roughly flat each time — persistent listings suggest the price (not the market) is what's stuck; bring a comps-based counter.
- Current owner paid $14k; list at $24k implies a 67% gain — meaningful room to come down on a strong offer.
Risks & watch-outs
- Watch-outs: built in 1890 — expect roof / HVAC / electrical / plumbing capex.
Questions for the listing agent
- It's been on market 65 days. Have you received any prior offers? Is the seller open to a 6% concession, seller financing, or rate buy-down credit?
- Built in 1890 — when were the roof, HVAC, electrical panel, plumbing, and water heater last replaced?
- Why hasn't it sold? Are there any deal-killer items the seller is aware of (foundation, flood, title, zoning, code violations)?
- Is there a deadline driving the sale (1031 exchange, divorce, estate, relocation)? That informs how much negotiation room exists.
- Schools are B-rated — typically a magnet for longer-tenancy family renters. What's the average tenant stay here, and is there a school-zone premium baked into asking?
- What's the average days-on-market for RENTAL listings here right now (not sales)? A rising rental-DOM trend means longer vacancies and softer asking-rent achievability than the comps imply.
- What's the recent tenant-quality profile in this submarket — average credit score on applications, eviction rate, late-payment / NSF rate, and stable-employment percentage? A property-management company in the area should have these aggregated.
- How much new for-sale + rental construction is in the pipeline within 1–3 miles? Heavy new supply typically softens prices + rents 12–24 months out; constrained supply supports both.
Investment metrics
- 1% rule
- 5.60% ✓
- Cap rate
- 51.13%
- Cash-on-cash
- 160.13%
- DSCR
- 8.13
- GRM
- 1.5
CMA / ARV
- ARV (median comp)
- $106,705
- List price
- $24,000
- Delta
- -77.51%
- Verdict
- UNDERPRICED
- Comps
- 20 within 1.0 mi
Show comp detail 12 sales within ~0.75 mi
| Address | Dist | Beds/Ba | Sqft | Sold | Price | $/sf | Match |
|---|---|---|---|---|---|---|---|
| 214 Floral Ave | 0.15mi | 3/1.0 | 1,487 (+3%) | 18mo | $155,000 | $104 | 72 |
| 428 2nd St | 0.17mi | 3/2.0 | 1,444 (+0%) | 19mo | $50,000 | $35 | 72 |
| 61 Kiski Ave | 0.13mi | 3/1.5 | 1,368 (-5%) | 15mo | $33,000 | $24 | 71 |
| 420 Washington Ave | 0.37mi | 3/1.5 | 1,409 (-2%) | 11mo | $175,000 | $124 | 67 |
| 434 2nd St | 0.18mi | 3/2.0 | 1,296 (-10%) | 8mo | $180,000 | $139 | 65 |
| 1653 Main St | 0.54mi | 2/1.0 (-1) | 1,382 (-4%) | 0mo | $117,000 | $85 | 63 |
| 347 Madison Ave | 0.52mi | 3/1.5 | 1,430 (-1%) | 12mo | $195,000 | $136 | 63 |
| 419 Washington Ave | 0.38mi | 3/1.5 | 1,536 (+7%) | 9mo | $140,000 | $91 | 62 |
| 485 Evergreen Rd | 0.38mi | 3/1.0 | 1,512 (+5%) | 19mo | $36,000 | $24 | 58 |
| 208 Beale Ave | 0.30mi | 3/1.5 | 1,242 (-14%) | 10mo | $159,000 | $128 | 52 |
| 372 Lincoln Ave | 0.36mi | 3/1.5 | 1,550 (+8%) | 21mo | $134,900 | $87 | 51 |
| 371 Washington Ave | 0.34mi | 3/2.5 | 1,608 (+12%) | 20mo | $155,000 | $96 | 42 |
Match score weights: distance 35% · size 25% · config 20% · recency 20%. Top-matched comps best support the ARV.
Projected returns pro-forma
10.0% appreciation · 3.0% rent growth · sell at horizon
- IRR
- —
- Equity multiple
- 11.45×
- Total profit
- $70,206
- Equity at exit
- $21,621
- IRR
- —
- Equity multiple
- 25.09×
- Total profit
- $161,870
- Equity at exit
- $46,627
Cash invested: $6,720 (down + closing). Projections, not guarantees.
Landlord ↔ Tenant lean methodology
- Overall (STATE)
- 62 Landlord-Friendly
- State Pennsylvania
- 62 Landlord-Friendly · EVEN
- County
- — inherits STATE
- City
- — inherits STATE
ZIP-level market 15656
- Home prices YoY
- 9.1%
- Active inventory
- 33
- Price-to-rent
- 1.5×
Monthly cashflow live
- Estimated rent
- $1,345 medium interval (Pro) →
- Mortgage (P&I)
- −$126
- Tax est. 1.5%
- −$30 /mo · $360/yr
- Insurance
- −$10
- HOA
- −$0
- Vacancy / Maint / Mgmt
- −$282
- Net cashflow
- $897
Break-even live
Sensitivity live
| Price | -10% $913 | -5% $905 | +0% $897 | +5% $888 | +10% $880 |
|---|---|---|---|---|---|
| Rent | -10% $790 | -5% $844 | +0% $897 | +5% $950 | +10% $1,003 |
| Rate | -1.0pp $909 | -0.5pp $903 | base $897 | +0.5pp $891 | +1.0pp $884 |
UW: 25.0% down · 7.5% · 30yr · 1.5% tax · 5.0% vac · 8.0% maint · 8.0% mgmt
Financing live
Cash to close
- Down payment
- $6,000
- Closing costs
- $720
- Reserves months
- —
- Total cash needed
- —
Loan-product check · same deal, 3 products live
Conventional
25% down · 7.5% · 30yr
- Down + closing
- —
- Monthly P&I
- —
- Monthly cashflow
- —
- DSCR
- —
- Eligible?
- —
Personal DTI + credit; lowest rate.
DSCR
20% down · 8.5% · 30yr
- Down + closing
- —
- Monthly P&I
- —
- Monthly cashflow
- —
- DSCR
- —
- Eligible?
- —
No personal income docs; deal must DSCR.
Hard money
10% down · 12.0% · 12mo
- Down + closing
- —
- Monthly P&I
- —
- Monthly cashflow
- —
- DSCR
- —
- Eligible?
- —
Short-term bridge; refi at stabilization.
Listing history 50 events
-
2026-06-21days on market $24,000 Active 65 DOM
-
2026-06-18days on market $24,000 Active 63 DOM
-
2026-06-17price $24,000 Active 62 DOM
-
2026-06-17days on market $25,000 Active 62 DOM
-
2026-06-16days on market $25,000 Active 61 DOM
-
2026-06-15days on market $25,000 Active 60 DOM
-
2026-06-13days on market $25,000 Active 58 DOM
-
2026-06-12days on market $25,000 Active 57 DOM
-
2026-06-09days on market $25,000 Active 54 DOM
-
2026-06-08days on market $25,000 Active 53 DOM
-
2026-06-08days on market $25,000 Active 52 DOM
-
2026-06-05days on market $25,000 Active 50 DOM
-
2026-06-04days on market $25,000 Active 48 DOM
-
2026-06-02days on market $25,000 Active 47 DOM
-
2026-06-01days on market $25,000 Active 46 DOM
-
2026-05-31days on market $25,000 Active 45 DOM
-
2026-04-16$25,000 Active 490-char remark
Show marketing remark (490 chars)
* * Investor Special * * This spacious property is set up like a duplex and offers flexible options — finish it into a true two-unit investment property, or restore it into a stunning single-family home with incredible space and charm. Whether you’re looking for rental income or a grand residence, the potential here is endless. Bring your vision and make it yours! Cash or rehab loans only. Property needs renovations. Bring your contractor. Property being sold as-is.
-
2026-04-13price $24,400 490-char remark
Show marketing remark (490 chars)
* * Investor Special * * This spacious property is set up like a duplex and offers flexible options — finish it into a true two-unit investment property, or restore it into a stunning single-family home with incredible space and charm. Whether you’re looking for rental income or a grand residence, the potential here is endless. Bring your vision and make it yours! Cash or rehab loans only. Property needs renovations. Bring your contractor. Property being sold as-is.
-
2026-01-22price $34,400 490-char remark
Show marketing remark (490 chars)
* * Investor Special * * This spacious property is set up like a duplex and offers flexible options — finish it into a true two-unit investment property, or restore it into a stunning single-family home with incredible space and charm. Whether you’re looking for rental income or a grand residence, the potential here is endless. Bring your vision and make it yours! Cash or rehab loans only. Property needs renovations. Bring your contractor. Property being sold as-is.
-
2025-11-26$34,900 Active 490-char remark
Show marketing remark (490 chars)
* * Investor Special * * This spacious property is set up like a duplex and offers flexible options — finish it into a true two-unit investment property, or restore it into a stunning single-family home with incredible space and charm. Whether you’re looking for rental income or a grand residence, the potential here is endless. Bring your vision and make it yours! Cash or rehab loans only. Property needs renovations. Bring your contractor. Property being sold as-is.
-
2025-07-08price $34,900
-
2025-07-08price $34,900
-
2025-05-28price $39,900
-
2025-05-28price $39,900
-
2025-04-28$49,900 Active
-
2025-04-28$49,900 Active
-
2023-11-17historical Expired
-
2023-11-17historical Expired
-
2023-11-01price $69,900
-
2023-11-01price $69,900
-
2023-10-21price $76,000
-
2023-10-21price $76,000
-
2023-10-11price $77,000
-
2023-10-11price $77,000
-
2023-10-03price $82,000
-
2023-10-03price $82,000
-
2023-09-27price $83,000
-
2023-09-27price $83,000
-
2023-09-19price $84,000
-
2023-09-19price $84,000
-
2023-09-11price $85,000
-
2023-09-11price $85,000
-
2023-09-05price $88,000
-
2023-09-05price $88,000
-
2023-09-01price $89,000
-
2023-09-01price $89,000
-
2023-08-28price $90,000
-
2023-08-28price $90,000
-
2023-08-23$95,000 Active
-
2023-08-23$95,000 Active
ⓘ Source: listings_history table (triggers on properties + properties_extension) + one-shot
backfill from property_details.listing_events for pre-trigger history.
Climate risk First Street
- Flood 1/10 Low FEMA zone X (unshaded) · 0% chance over 30 yrs
- Wildfire 1/10 Low
- Heat 4/10 Moderate 7 d/yr ≥97°F today · 18 d/yr by 30 yrs out
- Wind 2/10 Low
- Air quality 3/10 Moderate 3 unhealthy d/yr today · 5 by 30 yrs out
Nearby sold comps map
Loading sold comps map…
Walkable amenities ~0.75 mi
Loading nearby amenities…
Taxation est. · year 1
- Rental income
- $16,141
- − Mortgage interest
- −$1,344
- − Property taxes
- −$360
- − Insurance
- −$120
- − Repairs & maintenance
- −$1,291
- − Management
- −$1,291
- − Depreciation
- −$698
- Taxable income
- $11,036
- Est. tax owed @ 24.0%
- −$2,649
- After-tax cash flow
- $8,112/yr
For passive investors: Depreciation is non-cash, so a rental often shows a tax loss while cash-flowing — sheltering income. Rental losses are passive: they offset passive income freely, and up to $25,000/yr can offset ordinary (W-2) income if you actively participate and your MAGI is under $100k (phasing out to $0 by $150k); unused losses carry forward. On sale, claimed depreciation is recaptured at up to 25%, and gains may owe capital-gains tax (a 1031 exchange can defer both). Figures are a year-1 estimate at your 24.0% rate — not tax advice; consult a CPA.
Schools (NCES district)
- District
- Leechburg Area SD
- NCES district ID
- 4213470
- Math proficiency
- 33% ▼ -13.00%
- Reading proficiency
- 53% ▼ -12.00%
- Median HH income
- $47,241
- Composite
- 36.64/100
- National rank
- #4618
- State rank
- #303 of 539 in PA
Livability — Leechburg
- Score
- 78/100
- State rank
- #294
- US rank
- #2608
Category grades
Schools grade is shown separately in the Schools card above.
Census & demographics
- Census place
- Leechburg, PA
- Population (ZIP)
- 9,766
Population outlook (Armstrong County) Hauer SSP2
- Today (2025)
- 62,513 people
- By 2030
- 59,579 · -4.7%
- By 2040
- 52,890 · -15.4%
- By 2050
- 45,904 · -26.6%
- By 2075
- 32,023 · -48.8%
- By 2100
- 20,415 · -67.3%
Race, ethnicity, and origin ACS 2023
- Neighborhood character
- Predominantly White (95%)
- Race & ethnicity
- White 95% Two or more races 3% Black 2%
- Common ancestry
- Romanian 11% Serbian 2% Lithuanian 1%
- Foreign-born
- 1% · Canada
- Languages at home
- 98% English-only · Other Indo-European 1% Spanish 1%
Political lean MEDSL · Armstrong
- 2024 margin
- Solid R (+53.2) · D 23.0% · R 76.2%
- 2008→2024 swing
- -28.6pp toward R · 2008: -24.6pp · 2024: -53.2pp
- All cycles
- 2024: R+53.2 2020: R+52.3 2016: R+52.0 2012: R+37.2 2008: R+24.6
Not yet ingested
- Civics
- —
Market trends
- HPI YoY
- ▲ 21.11%
- Current HPI
- 252.6103
- Rent YoY
- —
- Metro
- —
- State GDP YoY
- ▲ 1.68%
- F500 in state
- 34
Industry mix (Fortune 500 HQ in PA)
| Industry | F500 HQs | Revenue |
|---|---|---|
| Healthcare | 2 | $309B |
|
||
| Insurance | 2 | $27B |
|
||
| Telecommunications / Media | 1 | $124B |
|
||
| Industrial Distribution | 1 | $22B |
|
||
| Financial Services | 1 | $20B |
|
||
| Chemicals / Materials | 1 | $18B |
|
||
Price history
-58.3% since first listed43 events — show timeline
- 2026-04-16 Listed $25,000 West Penn MLS
- 2026-04-13 Price Changed $24,400 West Penn MLS
- 2026-01-22 Price Changed $34,400 West Penn MLS
- 2025-11-26 Listed $34,900 West Penn MLS
- 2025-07-08 Price Changed $34,900 West Penn MLS
- 2025-07-08 Price Changed $34,900 West Penn MLS
- 2025-05-28 Price Changed $39,900 West Penn MLS
- 2025-05-28 Price Changed $39,900 West Penn MLS
- 2025-04-28 Listed $49,900 West Penn MLS
- 2025-04-28 Listed $49,900 West Penn MLS
- 2023-11-17 Delisted — West Penn MLS
- 2023-11-17 Delisted — West Penn MLS
- 2023-11-01 Price Changed $69,900 West Penn MLS
- 2023-11-01 Price Changed $69,900 West Penn MLS
- 2023-10-21 Price Changed $76,000 West Penn MLS
- 2023-10-21 Price Changed $76,000 West Penn MLS
- 2023-10-11 Price Changed $77,000 West Penn MLS
- 2023-10-11 Price Changed $77,000 West Penn MLS
- 2023-10-03 Price Changed $82,000 West Penn MLS
- 2023-10-03 Price Changed $82,000 West Penn MLS
- 2023-09-27 Price Changed $83,000 West Penn MLS
- 2023-09-27 Price Changed $83,000 West Penn MLS
- 2023-09-19 Price Changed $84,000 West Penn MLS
- 2023-09-19 Price Changed $84,000 West Penn MLS
- 2023-09-11 Price Changed $85,000 West Penn MLS
- 2023-09-11 Price Changed $85,000 West Penn MLS
- 2023-09-05 Price Changed $88,000 West Penn MLS
- 2023-09-05 Price Changed $88,000 West Penn MLS
- 2023-09-01 Price Changed $89,000 West Penn MLS
- 2023-09-01 Price Changed $89,000 West Penn MLS
- 2023-08-28 Price Changed $90,000 West Penn MLS
- 2023-08-28 Price Changed $90,000 West Penn MLS
- 2023-08-23 Listed $95,000 West Penn MLS
- 2023-08-23 Listed $95,000 West Penn MLS
- 2021-06-16 Price Changed $15,000 West Penn MLS
- 2021-06-15 Sold (MLS) $14,400 West Penn MLS
- 2021-05-05 Pending — West Penn MLS
- 2020-11-04 Listed $30,000 West Penn MLS
- 2013-03-14 Sold (Public Records) $34,000 Public Records
- 2013-03-12 Sold (MLS) $34,000 West Penn MLS
- 2013-03-12 Price Changed $39,900 West Penn MLS
- 2012-04-06 Listed $34,000 West Penn MLS
- 2011-04-18 Listed $59,900 West Penn MLS
Property tax history
+1.3%/yrLatest (2026): $2,505 · +1.0% YoY. Source: county tax records.
Cash-flow waterfall
monthlySold comps — $/sqft
last 12 mo · ≤1 miLoading sold comps…