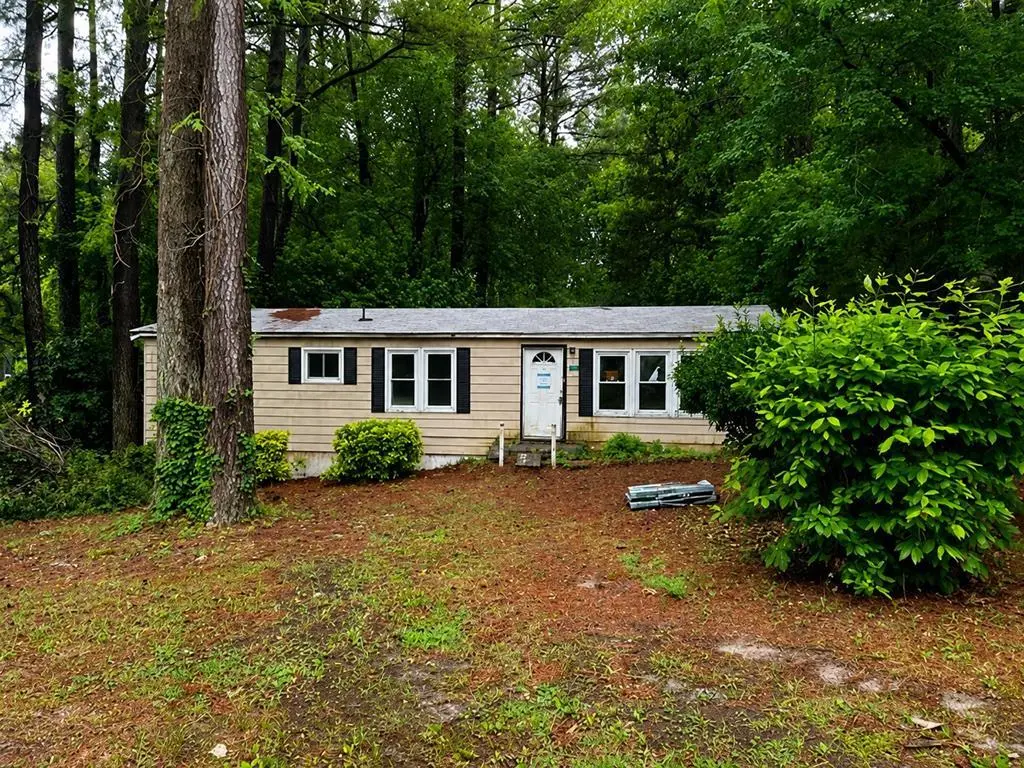
81 Wiggins Ave · Kilmarnock, VA
Flood risk 1/10 · Minimal
- FEMA flood zone
- X (unshaded)
- Chance of flooding over 30 yrs
- 0.0%
- Est. flood insurance / yr
- $507 – $1,088
Fire risk 3/10 · Minor
- Est. fire insurance / yr
- $666 – $1,236
Heat risk 9/10 · Severe
- Hot days now (above 103°F)
- 7 days/yr
- Hot days in 30 yrs
- 18 days/yr
Wind risk 8/10 · Major
- Chance of severe wind over 30 yrs
- 80.0%
Air-quality risk 1/10 · Minimal
- Unhealthy air days now
- 0 days/yr
- Unhealthy air days in 30 yrs
- 0 days/yr
Risk factors via First Street. Map © Google.
Why this score? — see what drove the B+ grade
The composite is a weighted blend of 9 inputs, each scored 0–100. Each bar is that input's sub-score; the figure is the points it added to the 100-point composite (weight × sub-score).
- Cash flow +30.0/30.0
- 1% rule +10.0/10.0
- DSCR +10.0/10.0
- ARV discount +7.5/15.0
- Appreciation +6.7/10.0
- Schools +3.3/10.0
- Livability +3.1/5.0
- Rent growth +2.5/5.0
- Condition / age +2.5/5.0
$59,950
🖨 Deal sheet (PDF) 📄 Offer letter ✓ Due diligence
Listing remarks
Great investment property, needs work and will not pass regular financing. Cash or rehab loans only. All appliances have been removed. Kitchen cabinets, countertops and sink removed. Portions of walls have been cut open & exposed wiring present.
Key facts
- 0.41 acre lot
- Built 1974
- Listed 15 days
Property features AI
Finance
- Other: Information not provided
- Financial info: Information not provided
- HOA & community: Information not provided
Exterior
- Parking: Information not provided
- Security: Information not provided
- Utilities: Public water; Public sewer
- Home design: Single-story residential property; Non-waterfront residential
- Construction: Aluminum siding
- Exterior features: Lot in the Kilmarnock subdivision; Zoned R-1
Interior
- Kitchen: Information not provided
- Bedrooms: Information not provided
- Flooring: Vinyl
- Bathrooms: 1 full bathroom; 1 half bathroom
- Heating & cooling: Information not provided
- Interior features: Vinyl flooring; 5 total rooms
- Laundry & utility: Information not provided
Neighborhood map
What this means for you Summary
Snapshot
- This is a 3-bed/1.5-bath single-family listed at $60k.
Deal economics
- At list price, monthly cash flow is $1k ($14k/yr) — positive.
- The deal already cash-flows at list — no discount required.
- Meets the 1% rule at list price ($2k rent vs $60k).
- Recommended offer: $59k (1.5% below list) — sets the bar for market timing.
- Cap rate 29.8% vs local median 2.8% in Kilmarnock — top-decile yield for the area; either an underpriced asset or a hidden risk that comps aren't pricing in. Stress-test before assuming the spread holds.
Location & tenants
- Location reads 62/100 on livability (#407 in VA) — a middle-class / working-renter tenant base. Strengths: cost of living A+; Watch: crime D+, employment D, amenities F.
- Lancaster County Public School District (rural): math 27% / reading 49% proficiency, ranked #125 of 131 in VA (top 95%) — families likely to look elsewhere, expect single-tenant / working-renter base with shorter leases; 64% free/reduced lunch — lower-income household profile, screen leases tightly.
- Market conditions: 95 active listings in the ZIP; 127 units permitted in Lancaster County in 2024 (0 in 5+ unit buildings).
Forward outlook
- In year one you build about $2k of equity ($414 loan paydown + $2k appreciation (3.3% local appreciation)).
- Lancaster County population projected at -34% by 2050 — secular population decline; favor cash flow + early exit over multi-decade hold.
- At projected returns (3.3% appreciation + 3.0% rent growth), your $17k cash investment doubles in ~2 years — after that, you're playing with house money.
Negotiation context
- It's been on market 15 days — a 2% lower offer ($59k) is reasonable based on typical stale-listing flexibility.
Risks & watch-outs
- Climate carrying-cost: severe wind risk, 80% chance of damaging wind over 30y; extreme-heat days projected 7→18/yr by 2055 (HVAC capex compounding) — expect insurance premiums to compound above CPI over the hold.
Questions for the listing agent
- Built in 1974 — when were the roof, HVAC, electrical panel, plumbing, and water heater last replaced?
- Is there a deadline driving the sale (1031 exchange, divorce, estate, relocation)? That informs how much negotiation room exists.
- Crime grade is D in this area — have there been break-ins, vandalism, or insurance claims at this property in the last 3 years? What carrier currently insures it and at what premium?
- What's the average days-on-market for RENTAL listings here right now (not sales)? A rising rental-DOM trend means longer vacancies and softer asking-rent achievability than the comps imply.
- What's the recent tenant-quality profile in this submarket — average credit score on applications, eviction rate, late-payment / NSF rate, and stable-employment percentage? A property-management company in the area should have these aggregated.
- How much new for-sale + rental construction is in the pipeline within 1–3 miles? Heavy new supply typically softens prices + rents 12–24 months out; constrained supply supports both.
Investment metrics
- 1% rule
- 3.30% ✓
- Cap rate
- 29.79%
- Cash-on-cash
- 83.92%
- DSCR
- 4.73
- GRM
- 2.5
CMA / ARV
- ARV (on-the-fly)
- $253,920
- Comps found
- 8
Show comp detail 8 sales within ~0.75 mi
| Address | Dist | Beds/Ba | Sqft | Sold | Price | $/sf | Match |
|---|---|---|---|---|---|---|---|
| 19 Bay Ct | 0.30mi | 2/2.0 (-1) | 1,168 (+6%) | 2mo | $225,000 | $193 | 68 |
| 230 Roseneath Ave | 0.29mi | 2/2.0 (-1) | 1,050 (-5%) | 5mo | $260,000 | $248 | 67 |
| 162 Hatton Ave | 0.48mi | 3/1.0 | 1,000 (-9%) | 3mo | $219,000 | $219 | 57 |
| 223 Roseneath Ave | 0.25mi | 3/2.0 | 1,232 (+12%) | 13mo | $295,000 | $239 | 56 |
| 25 Dogwood Ln | 0.45mi | 2/2.0 (-1) | 1,080 (-2%) | 18mo | $239,000 | $221 | 54 |
| 46 3rd Ave | 0.35mi | 2/1.0 (-1) | 1,000 (-9%) | 13mo | $195,000 | $195 | 50 |
| 36 Roseneath Ave | 0.27mi | 2/2.0 (-1) | 944 (-14%) | 10mo | $240,000 | $254 | 48 |
| 40 Oakland Street St | 0.51mi | 2/1.0 (-1) | 1,239 (+12%) | 18mo | $285,000 | $230 | 34 |
Match score weights: distance 35% · size 25% · config 20% · recency 20%. Top-matched comps best support the ARV.
Projected returns pro-forma
3.34% appreciation · 3.0% rent growth · sell at horizon
- IRR
- 88.5%
- Equity multiple
- 5.95×
- Total profit
- $83,093
- Equity at exit
- $28,115
- IRR
- 87.9%
- Equity multiple
- 12.30×
- Total profit
- $189,719
- Equity at exit
- $44,252
Cash invested: $16,786 (down + closing). Projections, not guarantees.
Landlord ↔ Tenant lean methodology
- Overall (STATE)
- 55 Moderately Landlord-Leaning
- State Virginia
- 55 Moderately Landlord-Leaning · D+2
- County
- — inherits STATE
- City
- — inherits STATE
ZIP-level market 22482
- Home prices YoY
- 1.5%
- Active inventory
- 95
- Price-to-rent
- 2.5×
Monthly cashflow live
- Estimated rent
- $1,980 medium interval (Pro) →
- Mortgage (P&I)
- −$314
- Tax from tax record
- −$51 /mo · $614/yr
- Insurance
- −$25
- HOA
- −$0
- Vacancy / Maint / Mgmt
- −$416
- Net cashflow
- $1,174
Break-even live
Sensitivity live
| Price | -10% $1,208 | -5% $1,191 | +0% $1,174 | +5% $1,157 | +10% $1,140 |
|---|---|---|---|---|---|
| Rent | -10% $1,017 | -5% $1,096 | +0% $1,174 | +5% $1,252 | +10% $1,330 |
| Rate | -1.0pp $1,204 | -0.5pp $1,189 | base $1,174 | +0.5pp $1,158 | +1.0pp $1,143 |
UW: 25.0% down · 7.5% · 30yr · 1.5% tax · 5.0% vac · 8.0% maint · 8.0% mgmt
Financing live
Cash to close
- Down payment
- $14,988
- Closing costs
- $1,798
- Reserves months
- —
- Total cash needed
- —
Loan-product check · same deal, 3 products live
Conventional
25% down · 7.5% · 30yr
- Down + closing
- —
- Monthly P&I
- —
- Monthly cashflow
- —
- DSCR
- —
- Eligible?
- —
Personal DTI + credit; lowest rate.
DSCR
20% down · 8.5% · 30yr
- Down + closing
- —
- Monthly P&I
- —
- Monthly cashflow
- —
- DSCR
- —
- Eligible?
- —
No personal income docs; deal must DSCR.
Hard money
10% down · 12.0% · 12mo
- Down + closing
- —
- Monthly P&I
- —
- Monthly cashflow
- —
- DSCR
- —
- Eligible?
- —
Short-term bridge; refi at stabilization.
Listing history 12 events
-
2026-06-21days on market $59,950 Active 15 DOM
-
2026-06-18days on market $59,950 Active 13 DOM
-
2026-06-17days on market $59,950 Active 12 DOM
-
2026-06-16days on market $59,950 Active 11 DOM
-
2026-06-15days on market $59,950 Active 10 DOM
-
2026-06-15days on market $59,950 Active 9 DOM
-
2026-06-13days on market $59,950 Active 8 DOM
-
2026-06-12days on market $59,950 Active 7 DOM
-
2026-06-09days on market $59,950 Active 4 DOM
-
2026-06-08days on market $59,950 Active 3 DOM
-
2026-06-08remarks 247-char remark
-
2026-06-08$59,950 Active 2 DOM
ⓘ Source: listings_history table (triggers on properties + properties_extension) + one-shot
backfill from property_details.listing_events for pre-trigger history.
Tax reassessment forecast VA · Resets to sale price
- Current annual tax
- $614 · $51/mo
- Projected year-2 tax
- $614 · $51/mo
- Expected delta
- $0/yr ($0/mo · 0.0%)
ⓘ Screening estimate from a state-policy table — verify with the county assessor before closing.
Climate risk First Street
- Flood 1/10 Low FEMA zone X (unshaded) · 0% chance over 30 yrs
- Wildfire 3/10 Moderate
- Heat 9/10 Extreme 7 d/yr ≥103°F today · 18 d/yr by 30 yrs out
- Wind 8/10 Severe 80% chance of damaging wind over 30 yrs
- Air quality 1/10 Low 0 unhealthy d/yr today · 0 by 30 yrs out
Nearby sold comps map
Loading sold comps map…
Walkable amenities ~0.75 mi
Loading nearby amenities…
Taxation est. · year 1
- Rental income
- $23,763
- − Mortgage interest
- −$3,358
- − Property taxes
- −$614
- − Insurance
- −$300
- − Repairs & maintenance
- −$1,901
- − Management
- −$1,901
- − Depreciation
- −$1,744
- Taxable income
- $13,945
- Est. tax owed @ 24.0%
- −$3,347
- After-tax cash flow
- $10,740/yr
For passive investors: Depreciation is non-cash, so a rental often shows a tax loss while cash-flowing — sheltering income. Rental losses are passive: they offset passive income freely, and up to $25,000/yr can offset ordinary (W-2) income if you actively participate and your MAGI is under $100k (phasing out to $0 by $150k); unused losses carry forward. On sale, claimed depreciation is recaptured at up to 25%, and gains may owe capital-gains tax (a 1031 exchange can defer both). Figures are a year-1 estimate at your 24.0% rate — not tax advice; consult a CPA.
Schools (NCES district)
- District
- Lancaster County Public School District
- NCES district ID
- 5102160
- Math proficiency
- 27% ▼ -44.00%
- Reading proficiency
- 49% ▼ -20.00%
- Median HH income
- $48,210
- Composite
- 32.58/100
- National rank
- #5680
- State rank
- #125 of 131 in VA
Livability — Kilmarnock
- Score
- 62/100
- State rank
- #407
- US rank
- #17011
Category grades
Schools grade is shown separately in the Schools card above.
Census & demographics
- Census place
- Kilmarnock, VA
- Population (ZIP)
- 3,171
Population outlook (Lancaster County) Hauer SSP2
- Today (2025)
- 9,870 people
- By 2030
- 9,172 · -7.1%
- By 2040
- 7,719 · -21.8%
- By 2050
- 6,551 · -33.6%
- By 2075
- 5,110 · -48.2%
- By 2100
- 3,884 · -60.6%
Race, ethnicity, and origin ACS 2023
- Neighborhood character
- Predominantly White (75%)
- Race & ethnicity
- White 75% Black 21% Two or more races 3%
- Common ancestry
- Italian 4% Serbian 4% Slovak 2%
- Foreign-born
- 2% · South Korea
- Languages at home
- 96% English-only · French/Haitian/Cajun 2% Spanish 1% Other Indo-European 1%
Political lean MEDSL · Lancaster
- 2024 margin
- Lean R (+7.0) · D 46.1% · R 53.1%
- 2008→2024 swing
- -1.1pp toward R · 2008: -5.9pp · 2024: -7.0pp
- All cycles
- 2024: R+7.0 2020: R+4.6 2016: R+10.0 2012: R+8.6 2008: R+5.9
Not yet ingested
- Civics
- —
Market trends
- HPI YoY
- ▲ 3.34%
- Current HPI
- 232.4115
- Rent YoY
- —
- Metro
- —
- State GDP YoY
- ▲ 2.40%
- F500 in state
- 50
Industry mix (Fortune 500 HQ in VA)
| Industry | F500 HQs | Revenue |
|---|---|---|
| Aerospace / Defense | 4 | $236B |
|
||
| Technology / Defense | 3 | $32B |
|
||
| Financial Services | 2 | $176B |
|
||
| Utilities | 2 | $27B |
|
||
| Insurance | 2 | $25B |
|
||
| Technology | 2 | $15B |
|
||
Price history
1 event — show timeline
- 2026-06-05 Listed $59,950 NNAR
Property tax history
+4.3%/yrLatest (2025): $614 · +0.0% YoY. Source: county tax records.
Cash-flow waterfall
monthlySold comps — $/sqft
last 12 mo · ≤1 miLoading sold comps…