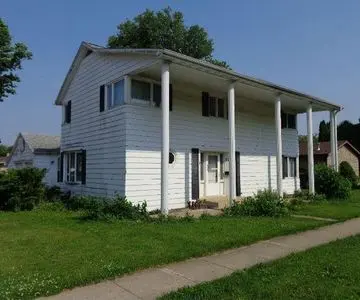
927 N 9th St · Rochelle, IL
Flood risk 1/10 · Minimal
- FEMA flood zone
- X (unshaded)
- Chance of flooding over 30 yrs
- 0.0%
- Est. flood insurance / yr
- $473 – $860
Fire risk 1/10 · Minimal
- Est. fire insurance / yr
- $804 – $1,492
Heat risk 3/10 · Minor
- Hot days now (above 102°F)
- 7 days/yr
- Hot days in 30 yrs
- 15 days/yr
Wind risk 2/10 · Minimal
- Chance of severe wind over 30 yrs
- 0.0%
Air-quality risk 2/10 · Minimal
- Unhealthy air days now
- 1 days/yr
- Unhealthy air days in 30 yrs
- 2 days/yr
Risk factors via First Street. Map © Google.
Why this score? — see what drove the B- grade
The composite is a weighted blend of 9 inputs, each scored 0–100. Each bar is that input's sub-score; the figure is the points it added to the 100-point composite (weight × sub-score).
- Cash flow +28.5/30.0
- 1% rule +10.0/10.0
- DSCR +10.0/10.0
- ARV discount +7.5/15.0
- Livability +3.3/5.0
- Rent growth +2.5/5.0
- Schools +2.5/10.0
- Condition / age +2.5/5.0
- Appreciation +0.0/10.0
$100,000
🖨 Deal sheet (PDF) 📄 Offer letter ✓ Due diligence
Listing remarks
Investment Property Home is available AS IS. Home experienced a fire in the master bedroom. Entire home has smoke damage. 2nd floor has Fire damage in Master bedroom Smoke and Firefighter damage in other rooms. Home needs all new windows. First floor has water damage in living room smoke damage on first floor other rooms. Basement partially finished- light water damage smoke damage possible. Exterior siding is aluminum. Furnace and central air were working as they should at time of fire. February 2026 First floor Dinning room/ Entryway Kitchen - Gutted to studs Living room Bathroom Laundry Closet area 2nd floor Bedroom 1 Bedroom 2 Bedroom 3 Master Bedroom Full bath Garage is 2 car w
Key facts
- Built 1950
- Listed 30 days
Neighborhood map
What this means for you Summary
Snapshot
- This is a 4-bed/2.0-bath single-family listed at $100k.
Deal economics
- At list price, monthly cash flow is $326 ($4k/yr) — positive.
- The deal already cash-flows at list — no discount required.
- Meets the 1% rule at list price ($2k rent vs $100k).
- Recommended offer: $98k (1.5% below list) — sets the bar for market timing.
Location & tenants
- Location reads 66/100 on livability (#588 in IL) — a middle-class / working-renter tenant base. Strengths: cost of living A+, housing A+, health & safety A+; Watch: amenities F, commute F, employment D-.
- Rochelle Twp Hsd 212 (rural): math 25% / reading 25% proficiency, ranked #608 of 919 in IL (top 66%) — low school quality limits family demand, transient renter base, plan for 1-2y turnover.
- Zoned schools: Rochelle Middle School (math 12% / reading 24%, grade F, #444 of 665 statewide, top 67%, 474 students, 0% FRL); Rochelle Twp High School (math 22% / reading 22%, grade F, #319 of 693 statewide, top 50%, 863 students, 0% FRL).
- Market conditions: 44 active listings in the ZIP; 113 units permitted in Ogle County in 2024 (67 in 5+ unit buildings).
Forward outlook
- Local home prices are declining (-3.0%/yr); year-one equity from $691 of loan paydown is wiped out by about $3k of value loss. Plan a longer hold.
- Ogle County population projected at -24% by 2050 — secular population decline; favor cash flow + early exit over multi-decade hold.
- At projected returns (-3.0% appreciation + 3.0% rent growth), your $28k cash investment doubles in ~9 years — after that, you're playing with house money.
Negotiation context
- It's been on market 30 days — a 2% lower offer ($98k) is reasonable based on typical stale-listing flexibility.
Risks & watch-outs
- Watch-outs: property tax is 4.1% of price; built in 1950 — expect roof / HVAC / electrical / plumbing capex.
Questions for the listing agent
- Built in 1950 — when were the roof, HVAC, electrical panel, plumbing, and water heater last replaced?
- Property tax is high relative to price — has the assessment been appealed recently, and will the sale trigger a re-assessment?
- Is there a deadline driving the sale (1031 exchange, divorce, estate, relocation)? That informs how much negotiation room exists.
- Schools are F-rated, which usually means shorter tenancies and higher turnover. Who's the typical renter profile here, and what's been the actual vacancy rate?
- What's the average days-on-market for RENTAL listings here right now (not sales)? A rising rental-DOM trend means longer vacancies and softer asking-rent achievability than the comps imply.
- What's the recent tenant-quality profile in this submarket — average credit score on applications, eviction rate, late-payment / NSF rate, and stable-employment percentage? A property-management company in the area should have these aggregated.
- How much new for-sale + rental construction is in the pipeline within 1–3 miles? Heavy new supply typically softens prices + rents 12–24 months out; constrained supply supports both.
Investment metrics
- 1% rule
- 1.56% ✓
- Cap rate
- 10.20%
- Cash-on-cash
- 13.96%
- DSCR
- 1.62
- GRM
- 5.4
CMA / ARV
- ARV (on-the-fly)
- $214,720
- Comps found
- 12
Show comp detail 12 sales within ~0.75 mi
| Address | Dist | Beds/Ba | Sqft | Sold | Price | $/sf | Match |
|---|---|---|---|---|---|---|---|
| 1038 N 8th St | 0.09mi | 4/2.0 | 1,626 (-8%) | 13mo | $185,000 | $114 | 72 |
| 1050 N 8th St | 0.12mi | 3/1.5 (-1) | 1,912 (+9%) | 11mo | $270,000 | $141 | 64 |
| 425 N 10th St | 0.40mi | 3/2.5 (-1) | 1,810 (+3%) | 13mo | $169,900 | $94 | 59 |
| 1020 N 8th St | 0.07mi | 3/1.5 (-1) | 1,497 (-15%) | 11mo | $185,000 | $124 | 56 |
| 1022 1st Ave | 0.69mi | 3/3.0 (-1) | 1,730 (-2%) | 2mo | $152,000 | $88 | 54 |
| 826 N 3rd St | 0.36mi | 4/1.5 | 1,499 (-15%) | 4mo | $170,000 | $113 | 53 |
| 206 Joanne Ln | 0.42mi | 3/2.0 (-1) | 1,554 (-12%) | 7mo | $257,900 | $166 | 50 |
| 1210 Lincoln Ave | 0.58mi | 3/1.5 (-1) | 1,545 (-12%) | 8mo | $165,000 | $107 | 39 |
| 1117 Mccall Ct | 0.64mi | 3/3.0 (-1) | 1,895 (+8%) | 13mo | $285,000 | $150 | 37 |
| 1002 W 1st Ave | 0.69mi | 3/2.0 (-1) | 1,526 (-13%) | 6mo | $148,470 | $97 | 36 |
| 1309 Crest Ln | 0.74mi | 4/2.0 | 2,000 (+14%) | 15mo | $243,900 | $122 | 30 |
| 323 Northknoll Dr | 0.71mi | 3/2.0 (-1) | 1,980 (+12%) | 14mo | $290,000 | $146 | 29 |
Match score weights: distance 35% · size 25% · config 20% · recency 20%. Top-matched comps best support the ARV.
Projected returns pro-forma
-3.0% appreciation · 3.0% rent growth · sell at horizon
- IRR
- 4.3%
- Equity multiple
- 1.17×
- Total profit
- $4,700
- Equity at exit
- $14,910
- IRR
- 13.9%
- Equity multiple
- 2.12×
- Total profit
- $31,437
- Equity at exit
- $8,646
Cash invested: $28,000 (down + closing). Projections, not guarantees.
Landlord ↔ Tenant lean methodology
- Overall (STATE)
- 43 Moderately Tenant-Leaning
- State Illinois
- 43 Moderately Tenant-Leaning · D+7
- County
- — inherits STATE
- City
- — inherits STATE
ZIP-level market 61068
- Active inventory
- 44
- Price-to-rent
- 5.4×
Monthly cashflow live
- Estimated rent
- $1,556 medium interval (Pro) →
- Mortgage (P&I)
- −$524
- Tax from tax record
- −$338 /mo · $4,051/yr
- Insurance
- −$42
- HOA
- −$0
- Vacancy / Maint / Mgmt
- −$327
- Net cashflow
- $326
Break-even live
Sensitivity live
| Price | -10% $382 | -5% $354 | +0% $326 | +5% $297 | +10% $269 |
|---|---|---|---|---|---|
| Rent | -10% $203 | -5% $264 | +0% $326 | +5% $387 | +10% $449 |
| Rate | -1.0pp $376 | -0.5pp $351 | base $326 | +0.5pp $300 | +1.0pp $274 |
UW: 25.0% down · 7.5% · 30yr · 1.5% tax · 5.0% vac · 8.0% maint · 8.0% mgmt
Financing live
Cash to close
- Down payment
- $25,000
- Closing costs
- $3,000
- Reserves months
- —
- Total cash needed
- —
Loan-product check · same deal, 3 products live
Conventional
25% down · 7.5% · 30yr
- Down + closing
- —
- Monthly P&I
- —
- Monthly cashflow
- —
- DSCR
- —
- Eligible?
- —
Personal DTI + credit; lowest rate.
DSCR
20% down · 8.5% · 30yr
- Down + closing
- —
- Monthly P&I
- —
- Monthly cashflow
- —
- DSCR
- —
- Eligible?
- —
No personal income docs; deal must DSCR.
Hard money
10% down · 12.0% · 12mo
- Down + closing
- —
- Monthly P&I
- —
- Monthly cashflow
- —
- DSCR
- —
- Eligible?
- —
Short-term bridge; refi at stabilization.
Listing history 15 events
-
2026-06-16status $100,000 Under Contract 30 DOM
-
2026-06-15days on market $100,000 Active 30 DOM
-
2026-06-13days on market $100,000 Active 28 DOM
-
2026-06-12days on market $100,000 Active 27 DOM
-
2026-06-09days on market $100,000 Active 24 DOM
-
2026-06-08days on market $100,000 Active 23 DOM
-
2026-06-07days on market $100,000 Active 22 DOM
-
2026-06-07days on market $100,000 Active 21 DOM
-
2026-06-04days on market $100,000 Active 18 DOM
-
2026-06-02days on market $100,000 Active 17 DOM
-
2026-06-01days on market $100,000 Active 16 DOM
-
2026-05-31days on market $100,000 Active 15 DOM
-
2026-05-31days on market $100,000 Active 14 DOM
-
2026-05-16$100,000 Active
-
2007-10-17soldstatus $148,900
ⓘ Source: listings_history table (triggers on properties + properties_extension) + one-shot
backfill from property_details.listing_events for pre-trigger history.
Tax reassessment forecast IL · Partial reset (capped growth)
- Current annual tax
- $4,051 · $338/mo
- Projected year-2 tax
- $4,051 · $338/mo
- Expected delta
- $0/yr ($0/mo · 0.0%)
ⓘ Screening estimate from a state-policy table — verify with the county assessor before closing.
Climate risk First Street
- Flood 1/10 Low FEMA zone X (unshaded) · 0% chance over 30 yrs
- Wildfire 1/10 Low
- Heat 3/10 Moderate 7 d/yr ≥102°F today · 15 d/yr by 30 yrs out
- Wind 2/10 Low 0% chance of damaging wind over 30 yrs
- Air quality 2/10 Low 1 unhealthy d/yr today · 2 by 30 yrs out
Nearby sold comps map
Loading sold comps map…
Walkable amenities ~0.75 mi
Loading nearby amenities…
Taxation est. · year 1
- Rental income
- $18,675
- − Mortgage interest
- −$5,602
- − Property taxes
- −$4,051
- − Insurance
- −$500
- − Repairs & maintenance
- −$1,494
- − Management
- −$1,494
- − Depreciation
- −$2,909
- Taxable income
- $2,626
- Est. tax owed @ 24.0%
- −$630
- After-tax cash flow
- $3,279/yr
For passive investors: Depreciation is non-cash, so a rental often shows a tax loss while cash-flowing — sheltering income. Rental losses are passive: they offset passive income freely, and up to $25,000/yr can offset ordinary (W-2) income if you actively participate and your MAGI is under $100k (phasing out to $0 by $150k); unused losses carry forward. On sale, claimed depreciation is recaptured at up to 25%, and gains may owe capital-gains tax (a 1031 exchange can defer both). Figures are a year-1 estimate at your 24.0% rate — not tax advice; consult a CPA.
Schools (NCES district)
- District
- Rochelle Twp Hsd 212
- NCES district ID
- 1734290
- Math proficiency
- 25% ▬ 0.00%
- Reading proficiency
- 25% ▼ -5.00%
- Median HH income
- $48,343
- Composite
- 24.94/100
- National rank
- #12981
- State rank
- #608 of 919 in IL
Livability — Rochelle
- Score
- 66/100
- State rank
- #588
- US rank
- #12244
Category grades
Schools grade is shown separately in the Schools card above.
Census & demographics
- Census place
- Rochelle, IL
- Population (ZIP)
- 15,076
Population outlook (Ogle County) Hauer SSP2
- Today (2025)
- 48,390 people
- By 2030
- 46,346 · -4.2%
- By 2040
- 41,772 · -13.7%
- By 2050
- 36,911 · -23.7%
- By 2075
- 27,130 · -43.9%
- By 2100
- 18,627 · -61.5%
Race, ethnicity, and origin ACS 2023
- Neighborhood character
- Predominantly White (68%)
- Race & ethnicity
- White 68% Hispanic / Latino 26% Two or more races 15% Black 3% Native American 1%
- Hispanic origin (detail)
- Mexican 23% Puerto Rican 2%
- Common ancestry
- Portuguese 3% Romanian 2% Slovak 2%
- Foreign-born
- 9% · Canada
- Languages at home
- 83% English-only · Spanish 17%
Political lean MEDSL · Ogle
- 2024 margin
- Strong R (+29.4) · D 34.5% · R 63.9% · Other 1.6%
- 2008→2024 swing
- -21.8pp toward R · 2008: -7.6pp · 2024: -29.4pp
- All cycles
- 2024: R+29.4 2020: R+25.9 2016: R+26.6 2012: R+16.7 2008: R+7.6
Not yet ingested
- Civics
- —
Market trends
- HPI YoY
- ▼ -150.85%
- Current HPI
- 150.4419
- Rent YoY
- —
- Metro
- —
- State GDP YoY
- ▲ 1.59%
- F500 in state
- 60
Industry mix (Fortune 500 HQ in IL)
| Industry | F500 HQs | Revenue |
|---|---|---|
| Insurance | 4 | $201B |
|
||
| Consumer Goods | 4 | $87B |
|
||
| Industrial Machinery | 3 | $64B |
|
||
| Healthcare | 2 | $55B |
|
||
| Retail / Pharmacy | 1 | $148B |
|
||
| Agriculture / Food | 1 | $86B |
|
||
Price history
-32.8% since first listed2 events — show timeline
- 2026-05-16 Listed $100,000 FSBO.com
- 2007-10-17 Sold (Public Records) $148,900 Public Records
Property tax history
+3.9%/yrLatest (2024): $4,051 · +7.7% YoY. Source: county tax records.
Cash-flow waterfall
monthlySold comps — $/sqft
last 12 mo · ≤1 miLoading sold comps…