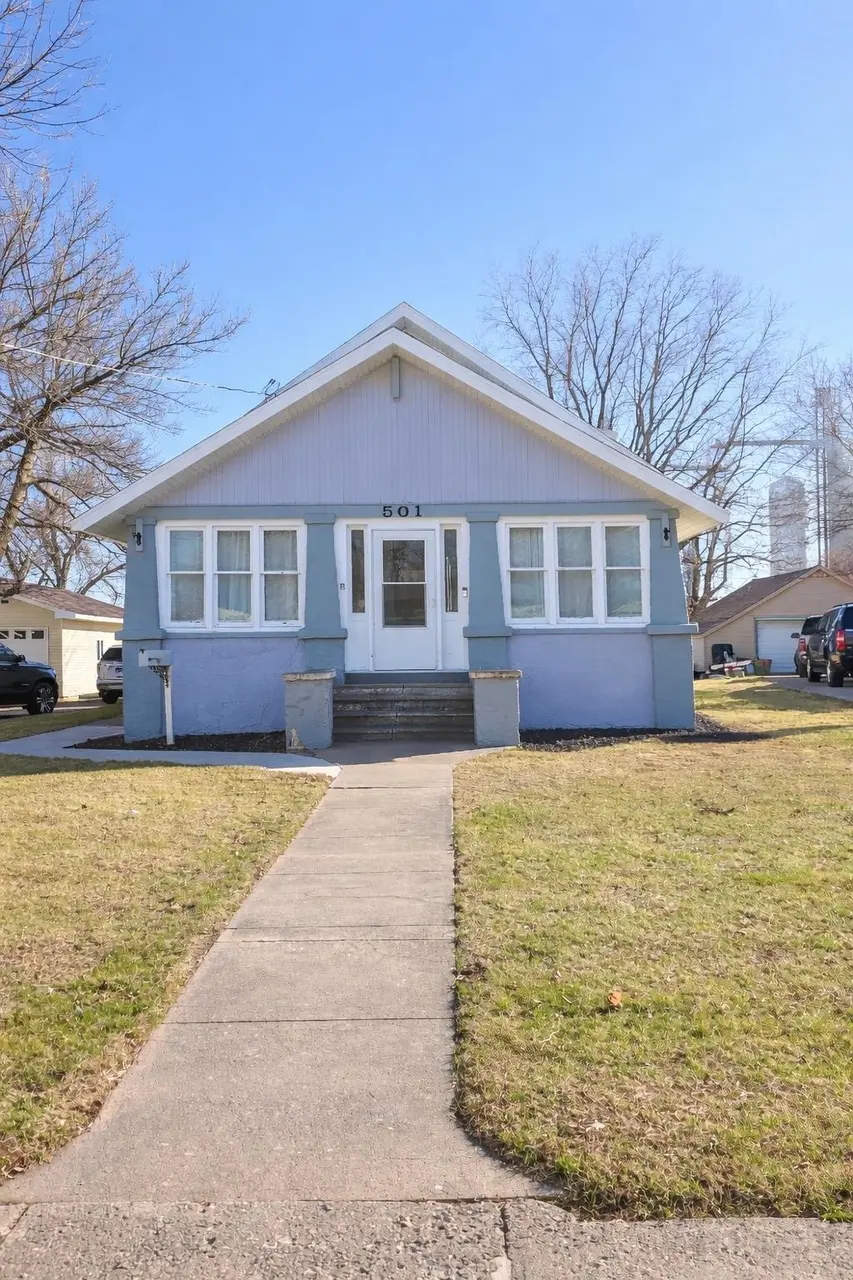
501 1st St SE · Hartley, IA
Flood risk 1/10 · Minimal
- FEMA flood zone
- X (unshaded)
- Chance of flooding over 30 yrs
- 0.0%
- Est. flood insurance / yr
- $473 – $860
Fire risk 1/10 · Minimal
- Est. fire insurance / yr
- $902 – $1,676
Heat risk 3/10 · Minor
- Hot days now (above 100°F)
- 7 days/yr
- Hot days in 30 yrs
- 15 days/yr
Wind risk 2/10 · Minimal
- Chance of severe wind over 30 yrs
- —
Air-quality risk 1/10 · Minimal
- Unhealthy air days now
- 0 days/yr
- Unhealthy air days in 30 yrs
- 0 days/yr
Risk factors via First Street. Map © Google.
Why this score? — see what drove the C- grade
The composite is a weighted blend of 9 inputs, each scored 0–100. Each bar is that input's sub-score; the figure is the points it added to the 100-point composite (weight × sub-score).
- Cash flow +20.3/30.0
- ARV discount +7.9/15.0
- DSCR +6.4/10.0
- Schools +6.1/10.0
- 1% rule +4.7/10.0
- Livability +3.9/5.0
- Rent growth +2.5/5.0
- Condition / age +2.5/5.0
- Appreciation +0.0/10.0
$105,000
🖨 Deal sheet (PDF) 📄 Offer letter ✓ Due diligence
Listing remarks MLS
Here is a well-cared-for Craftsman home located on a beautiful street in a great neighborhood! This 3 bedroom, 1 bathroom home features an inviting sunporch, updated kitchen, stunning original woodwork, and natural hardwood floors throughout. Many electrical and plumbing updates have already been completed, making this charming home move-in ready and easy to enjoy.
Key facts
- Plumbing updates
- Sunporch
- Electrical updates
Tags
Neighborhood map
What this means for you Summary
Snapshot
- This is a 3-bed/1.0-bath single-family listed at $105k.
Deal economics
- At list price, monthly cash flow is $134 ($2k/yr) — positive.
- The deal already cash-flows at list — no discount required.
- To meet the 1% rule (rent ≥ 1% of price), the offer needs to be $101k (3.5% below list).
- Recommended offer: $99k (6.0% below list) — sets the bar for market timing.
Location & tenants
- Location reads 77/100 on livability (#177 in IA, #3,188 nationally) — a middle-class / working-renter tenant base. Strengths: crime A+, cost of living A+, housing A+; Watch: employment D, amenities F, commute F.
- Hartley-Melvin-Sanborn Community School District (rural): math 72% / reading 73% proficiency, ranked #111 of 289 in IA (top 38%) — strong family-tenant draw, lease renewals of 3-5y typical.
- Market conditions: 13 active listings in the ZIP; 13 units permitted in O'Brien County in 2024 (0 in 5+ unit buildings).
Forward outlook
- Local home prices are declining (-3.0%/yr); year-one equity from $726 of loan paydown is wiped out by about $3k of value loss. Plan a longer hold.
- O'Brien County population projected at -11% by 2050 — secular population decline; favor cash flow + early exit over multi-decade hold.
Negotiation context
- It's been on market 84 days — a 6% lower offer ($99k) is reasonable based on typical stale-listing flexibility.
- Current owner paid $66k; list at $105k implies a 58% gain — meaningful room to come down on a strong offer.
Risks & watch-outs
- Watch-outs: built in 1910 — expect roof / HVAC / electrical / plumbing capex.
Questions for the listing agent
- It's been on market 84 days. Have you received any prior offers? Is the seller open to a 6% concession, seller financing, or rate buy-down credit?
- Built in 1910 — when were the roof, HVAC, electrical panel, plumbing, and water heater last replaced?
- Why hasn't it sold? Are there any deal-killer items the seller is aware of (foundation, flood, title, zoning, code violations)?
- Is there a deadline driving the sale (1031 exchange, divorce, estate, relocation)? That informs how much negotiation room exists.
- Schools are B-rated — typically a magnet for longer-tenancy family renters. What's the average tenant stay here, and is there a school-zone premium baked into asking?
- What's the average days-on-market for RENTAL listings here right now (not sales)? A rising rental-DOM trend means longer vacancies and softer asking-rent achievability than the comps imply.
- What's the recent tenant-quality profile in this submarket — average credit score on applications, eviction rate, late-payment / NSF rate, and stable-employment percentage? A property-management company in the area should have these aggregated.
- How much new for-sale + rental construction is in the pipeline within 1–3 miles? Heavy new supply typically softens prices + rents 12–24 months out; constrained supply supports both.
Investment metrics
- 1% rule
- 0.97% ✗
- Cap rate
- 7.83%
- Cash-on-cash
- 5.47%
- DSCR
- 1.24
- GRM
- 8.6
CMA / ARV
- ARV (median comp)
- $106,045
- List price
- $105,000
- Delta
- -0.99%
- Verdict
- FAIR
- Comps
- 20 within 1.0 mi
Show comp detail 8 sales within ~0.75 mi
| Address | Dist | Beds/Ba | Sqft | Sold | Price | $/sf | Match |
|---|---|---|---|---|---|---|---|
| 140 N 1st Ave E | 0.31mi | 3/1.0 | 1,248 (+6%) | 4mo | $138,000 | $111 | 72 |
| 160 N 1st Ave W | 0.43mi | 3/2.0 | 1,140 (-3%) | 9mo | $75,000 | $66 | 64 |
| 160 N Central Ave | 0.38mi | 3/2.0 | 1,276 (+8%) | 8mo | $152,000 | $119 | 58 |
| 151 N 3rd Avenue Ave W | 0.58mi | 2/2.0 (-1) | 1,254 (+7%) | 1mo | $192,000 | $153 | 52 |
| 50 E 1st Street St NE | 0.32mi | 3/2.0 | 1,024 (-13%) | 19mo | $129,900 | $127 | 44 |
| 432 W Maple Dr | 0.64mi | 2/1.0 (-1) | 1,040 (-12%) | 5mo | $100,500 | $97 | 42 |
| 420 N 3rd Ave W | 0.65mi | 4/2.0 (+1) | 1,264 (+8%) | 10mo | $215,000 | $170 | 40 |
| 410 W Maple Dr | 0.60mi | 3/2.5 | 1,028 (-13%) | 11mo | $182,900 | $178 | 36 |
Match score weights: distance 35% · size 25% · config 20% · recency 20%. Top-matched comps best support the ARV.
Projected returns pro-forma
-3.0% appreciation · 3.0% rent growth · sell at horizon
- IRR
- -7.8%
- Equity multiple
- 0.71×
- Total profit
- $-8,493
- Equity at exit
- $15,656
- IRR
- 1.7%
- Equity multiple
- 1.12×
- Total profit
- $3,519
- Equity at exit
- $9,078
Cash invested: $29,400 (down + closing). Projections, not guarantees.
Landlord ↔ Tenant lean methodology
- Overall (STATE)
- 83 Strongly Landlord-Friendly
- State Iowa
- 83 Strongly Landlord-Friendly · R+6
- County
- — inherits STATE
- City
- — inherits STATE
ZIP-level market 51346
- Home prices YoY
- -20.4%
- Active inventory
- 13
- Price-to-rent
- 8.6×
Monthly cashflow live
- Estimated rent
- $1,014 medium interval (Pro) →
- Mortgage (P&I)
- −$551
- Tax from tax record
- −$72 /mo · $868/yr
- Insurance
- −$44
- HOA
- −$0
- Vacancy / Maint / Mgmt
- −$213
- Net cashflow
- $134
Break-even live
Sensitivity live
| Price | -10% $194 | -5% $164 | +0% $134 | +5% $104 | +10% $75 |
|---|---|---|---|---|---|
| Rent | -10% $54 | -5% $94 | +0% $134 | +5% $174 | +10% $214 |
| Rate | -1.0pp $187 | -0.5pp $161 | base $134 | +0.5pp $107 | +1.0pp $79 |
UW: 25.0% down · 7.5% · 30yr · 1.5% tax · 5.0% vac · 8.0% maint · 8.0% mgmt
Financing live
Cash to close
- Down payment
- $26,250
- Closing costs
- $3,150
- Reserves months
- —
- Total cash needed
- —
Loan-product check · same deal, 3 products live
Conventional
25% down · 7.5% · 30yr
- Down + closing
- —
- Monthly P&I
- —
- Monthly cashflow
- —
- DSCR
- —
- Eligible?
- —
Personal DTI + credit; lowest rate.
DSCR
20% down · 8.5% · 30yr
- Down + closing
- —
- Monthly P&I
- —
- Monthly cashflow
- —
- DSCR
- —
- Eligible?
- —
No personal income docs; deal must DSCR.
Hard money
10% down · 12.0% · 12mo
- Down + closing
- —
- Monthly P&I
- —
- Monthly cashflow
- —
- DSCR
- —
- Eligible?
- —
Short-term bridge; refi at stabilization.
Listing history 21 events
-
2026-06-21days on market $105,000 Active 84 DOM
-
2026-06-18days on market $105,000 Active 82 DOM
-
2026-06-17days on market $105,000 Active 81 DOM
-
2026-06-16days on market $105,000 Active 80 DOM
-
2026-06-15days on market $105,000 Active 79 DOM
-
2026-06-13days on market $105,000 Active 77 DOM
-
2026-06-12days on market $105,000 Active 76 DOM
-
2026-06-09days on market $105,000 Active 73 DOM
-
2026-06-09price $105,000 Active 72 DOM
-
2026-06-08days on market $112,000 Active 72 DOM
-
2026-06-07days on market $112,000 Active 71 DOM
-
2026-06-07days on market $112,000 Active 70 DOM
-
2026-06-04days on market $112,000 Active 67 DOM
-
2026-06-02days on market $112,000 Active 66 DOM
-
2026-06-01days on market $112,000 Active 65 DOM
-
2026-05-31days on market $112,000 Active 64 DOM
-
2026-05-31days on market $112,000 Active 63 DOM
-
2026-05-11price $124,900 367-char remark
Show marketing remark (367 chars)
Here is a well-cared-for Craftsman home located on a beautiful street in a great neighborhood! This 3 bedroom, 1 bathroom home features an inviting sunporch, updated kitchen, stunning original woodwork, and natural hardwood floors throughout. Many electrical and plumbing updates have already been completed, making this charming home move-in ready and easy to enjoy.
-
2026-04-20price $127,900 367-char remark
Show marketing remark (367 chars)
Here is a well-cared-for Craftsman home located on a beautiful street in a great neighborhood! This 3 bedroom, 1 bathroom home features an inviting sunporch, updated kitchen, stunning original woodwork, and natural hardwood floors throughout. Many electrical and plumbing updates have already been completed, making this charming home move-in ready and easy to enjoy.
-
2026-03-27$134,900 Active 367-char remark
Show marketing remark (367 chars)
Here is a well-cared-for Craftsman home located on a beautiful street in a great neighborhood! This 3 bedroom, 1 bathroom home features an inviting sunporch, updated kitchen, stunning original woodwork, and natural hardwood floors throughout. Many electrical and plumbing updates have already been completed, making this charming home move-in ready and easy to enjoy.
-
2022-06-06soldstatus $66,500
ⓘ Source: listings_history table (triggers on properties + properties_extension) + one-shot
backfill from property_details.listing_events for pre-trigger history.
Tax reassessment forecast IA · Partial reset (capped growth)
- Current annual tax
- $868 · $72/mo
- Projected year-2 tax
- $1,258 · $105/mo
- Expected delta
- +$390/yr (+$33/mo · 45.0%)
ⓘ Screening estimate from a state-policy table — verify with the county assessor before closing.
Climate risk First Street
- Flood 1/10 Low FEMA zone X (unshaded) · 0% chance over 30 yrs
- Wildfire 1/10 Low
- Heat 3/10 Moderate 7 d/yr ≥100°F today · 15 d/yr by 30 yrs out
- Wind 2/10 Low
- Air quality 1/10 Low 0 unhealthy d/yr today · 0 by 30 yrs out
Nearby sold comps map
Loading sold comps map…
Walkable amenities ~0.75 mi
Loading nearby amenities…
Taxation est. · year 1
- Rental income
- $12,165
- − Mortgage interest
- −$5,882
- − Property taxes
- −$868
- − Insurance
- −$525
- − Repairs & maintenance
- −$973
- − Management
- −$973
- − Depreciation
- −$3,055
- Taxable loss
- −$111
- Est. tax savings @ 24.0%
- +$27
- After-tax cash flow
- $1,636/yr
For passive investors: Depreciation is non-cash, so a rental often shows a tax loss while cash-flowing — sheltering income. Rental losses are passive: they offset passive income freely, and up to $25,000/yr can offset ordinary (W-2) income if you actively participate and your MAGI is under $100k (phasing out to $0 by $150k); unused losses carry forward. On sale, claimed depreciation is recaptured at up to 25%, and gains may owe capital-gains tax (a 1031 exchange can defer both). Figures are a year-1 estimate at your 24.0% rate — not tax advice; consult a CPA.
Schools (NCES district)
- District
- Hartley-Melvin-Sanborn Community School District
- NCES district ID
- 1913660
- Math proficiency
- 72% ▲ 1.00%
- Reading proficiency
- 73% ▲ 4.00%
- Median HH income
- $46,177
- Composite
- 61.08/100
- National rank
- #790
- State rank
- #111 of 289 in IA
Livability — Hartley
- Score
- 77/100
- State rank
- #177
- US rank
- #3188
Category grades
Schools grade is shown separately in the Schools card above.
Census & demographics
- Census place
- Hartley, IA
- Population (ZIP)
- 2,211
Population outlook (O'Brien County) Hauer SSP2
- Today (2025)
- 13,353 people
- By 2030
- 13,040 · -2.3%
- By 2040
- 12,422 · -7.0%
- By 2050
- 11,887 · -11.0%
- By 2075
- 11,132 · -16.6%
- By 2100
- 10,176 · -23.8%
Race, ethnicity, and origin ACS 2023
- Neighborhood character
- Predominantly White (92%)
- Race & ethnicity
- White 92% Hispanic / Latino 5% Two or more races 3%
- Hispanic origin (detail)
- Mexican 5%
- Common ancestry
- Iranian 16% Portuguese 7% Lithuanian 2%
- Foreign-born
- 3% · Canada
- Languages at home
- 95% English-only · Spanish 3% German/W. Germanic 2%
Political lean MEDSL · O'Brien
- 2024 margin
- Solid R (+60.9) · D 19.0% · R 80.0% · Other 1.0%
- 2008→2024 swing
- -26.1pp toward R · 2008: -34.9pp · 2024: -60.9pp
- All cycles
- 2024: R+60.9 2020: R+56.8 2016: R+60.2 2012: R+45.2 2008: R+34.9
Not yet ingested
- Civics
- —
Market trends
- HPI YoY
- ▼ -41.28%
- Current HPI
- 160.6681
- Rent YoY
- —
- Metro
- —
- State GDP YoY
- ▲ 2.48%
- F500 in state
- 4
Industry mix (Fortune 500 HQ in IA)
| Industry | F500 HQs | Revenue |
|---|---|---|
| Financial Services | 1 | $16B |
|
||
| Retail / Convenience | 1 | $15B |
|
||
Price history
+87.8% since first listed4 events — show timeline
- 2026-05-11 Price Changed $124,900 Iowa Great Lakes BOR
- 2026-04-20 Price Changed $127,900 Iowa Great Lakes BOR
- 2026-03-27 Listed $134,900 Iowa Great Lakes BOR
- 2022-06-06 Sold (Public Records) $66,500 Public Records
Property tax history
+5.2%/yrLatest (2025): $868 · +3.1% YoY. Source: county tax records.
Cash-flow waterfall
monthlySold comps — $/sqft
last 12 mo · ≤1 miLoading sold comps…