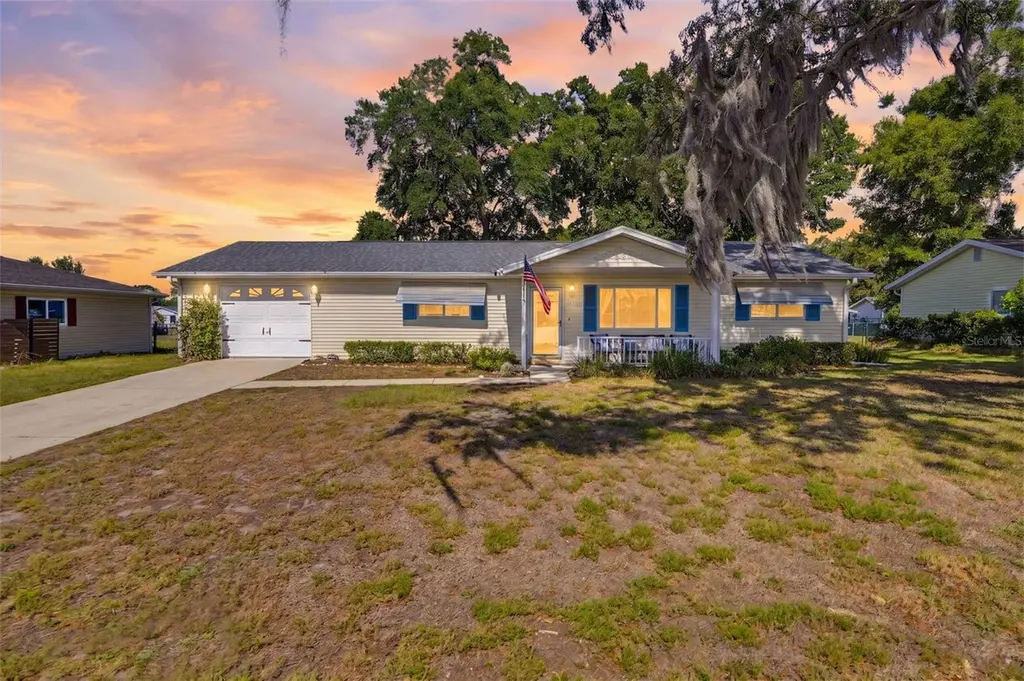
10952 SW 75th Ave · Liberty Triangle, FL
Flood risk 1/10 · Minimal
- FEMA flood zone
- X (unshaded)
- Chance of flooding over 30 yrs
- 0.0%
- Est. flood insurance / yr
- $507 – $1,088
Fire risk 4/10 · Minor
- Est. fire insurance / yr
- $947 – $1,759
Heat risk 8/10 · Major
- Hot days now (above 107°F)
- 6 days/yr
- Hot days in 30 yrs
- 19 days/yr
Wind risk 9/10 · Severe
- Chance of severe wind over 30 yrs
- 99.0%
Air-quality risk 2/10 · Minimal
- Unhealthy air days now
- 2 days/yr
- Unhealthy air days in 30 yrs
- 2 days/yr
Risk factors via First Street. Map © Google.
Why this score? — see what drove the D+ grade
The composite is a weighted blend of 9 inputs, each scored 0–100. Each bar is that input's sub-score; the figure is the points it added to the 100-point composite (weight × sub-score).
- Cash flow +17.6/30.0
- ARV discount +11.9/15.0
- DSCR +5.5/10.0
- 1% rule +4.6/10.0
- Schools +3.6/10.0
- Livability +2.5/5.0
- Condition / age +2.5/5.0
- Rent growth +1.9/5.0
- Appreciation +0.0/10.0
$182,900
🖨 Deal sheet (PDF) 📄 Offer letter ✓ Due diligence
Listing remarks
* * * BRAND NEW ROOF 2025 * * * Welcome to this charming and beautifully maintained 2-bedroom, 2-bath home situated on an oversized 10,000 sq ft lot — the largest lot in the neighborhood! Offering plenty of outdoor space, this property provides endless possibilities for entertaining, gardening, pets, or future additions. Inside, you’ll find a comfortable and functional layout filled with natural light and inviting living spaces perfect for everyday living or seasonal enjoyment. The spacious backyard creates a rare opportunity to enjoy privacy and room to spread out, something not often found in this community. This is a 55+ Community. Conveniently located in the heart of O
Key facts
- Spacious backyard
- Natural light
- Oversized lot
Tags
Property features AI
Finance
- Other: Lot is approximately 0.23 acres with asphalt road access; Zoned B2; Property is homesteaded; Universal property ID available
- Financial info: Annual taxes listed (2025); No lease restrictions indicated
- HOA & community: Monthly HOA fee of $123 (required); Association name: Robert Lapolt; Senior community; Pets allowed
Exterior
- Parking: 1-car garage
- Utilities: Public water; Public sewer; Electricity connected and available; Water connected and available; Sewer connected; Cable available
- Home design: Single family residence; One story; Faces east
- Construction: Vinyl siding and frame construction; Other roof type; Slab foundation; Built with a total living area of 1,424 and building area of 1,424 (public records)
- Exterior features: Other exterior features
Interior
- Kitchen: Cooktop; Dishwasher; Disposal; Microwave; Refrigerator; Electric water heater
- Bedrooms: 2 bedrooms
- Flooring: Wood flooring
- Bathrooms: 2 full bathrooms
- Heating & cooling: Heat pump heating; Central air conditioning
- Interior features: Ceiling fans
- Laundry & utility: Laundry room; Washer; Dryer
Neighborhood map
What this means for you Summary
Snapshot
- This is a 2-bed/2.0-bath single-family listed at $183k.
Deal economics
- At list price, monthly cash flow is $143 ($2k/yr) — positive.
- The deal already cash-flows at list — no discount required.
- To meet the 1% rule (rent ≥ 1% of price), the offer needs to be $175k (4.4% below list).
- Recommended offer: $175k (4.4% below list) — sets the bar for 1% rule.
- Cap rate 7.2% vs local median 4.5% in Liberty Triangle — top-decile yield for the area; either an underpriced asset or a hidden risk that comps aren't pricing in. Stress-test before assuming the spread holds.
Location & tenants
- Location reads: area grade D — affects rentability + tenant quality, not the cash-flow math above.
- Marion (rural): math 42% / reading 43% proficiency, ranked #61 of 73 in FL (top 84%) — families likely to look elsewhere, expect single-tenant / working-renter base with shorter leases; 61% free/reduced lunch — lower-income household profile, screen leases tightly.
- Zoned schools: Marion Oaks Elementary School (math 38% / reading 39%, grade F, #1,575 of 2,144 statewide, top 74%, 939 students, 65% FRL); Liberty Middle School (math 40% / reading 41%, grade F, #360 of 571 statewide, top 64%, 1,365 students, 54% FRL); West Port High School (math 34% / reading 52%, grade F, #255 of 667 statewide, top 39%, 2,906 students, 52% FRL) — zoned schools at 57% FRL track the district average.
- Market conditions: Rents soft (-2.6%/yr); 858 active listings in the ZIP; 16 comparable units currently listed for rent nearby; rentals at typical pace (median 23d on market — plan ~3-4 weeks tenant-placement turnaround); 7,071 units permitted in Marion County in 2024 (534 in 5+ unit buildings).
- This rent runs 32% of the median local income ($66k/yr) — at the standard rent-burdened threshold; future hikes will face affordability resistance.
Forward outlook
- Local home prices are declining (-3.0%/yr); year-one equity from $1k of loan paydown is wiped out by about $5k of value loss. Plan a longer hold.
- Marion County population projected at +13% by 2050 — modest demand growth; plan on rents tracking national, not racing it.
Negotiation context
- It's been on market 41 days — a 3% lower offer ($177k) is reasonable based on typical stale-listing flexibility.
- Current owner paid $72k; list at $183k implies a 155% gain — meaningful room to come down on a strong offer.
Risks & watch-outs
- Climate carrying-cost: severe wind risk, 99% chance of damaging wind over 30y; extreme-heat days projected 6→19/yr by 2055 (HVAC capex compounding) — expect insurance premiums to compound above CPI over the hold.
Questions for the listing agent
- It's been on market 41 days. Have you received any prior offers? Is the seller open to a 4% concession, seller financing, or rate buy-down credit?
- What does the HOA fee cover, when was the last increase, and are there any pending special assessments or reserve-fund shortfalls?
- Is there a deadline driving the sale (1031 exchange, divorce, estate, relocation)? That informs how much negotiation room exists.
- The area grade is low — what's the realistic commute time and amenity access for the typical tenant pool here? Any planned neighborhood developments (good or bad) we should know about?
- What's the average days-on-market for RENTAL listings here right now (not sales)? A rising rental-DOM trend means longer vacancies and softer asking-rent achievability than the comps imply.
- What's the recent tenant-quality profile in this submarket — average credit score on applications, eviction rate, late-payment / NSF rate, and stable-employment percentage? A property-management company in the area should have these aggregated.
- How much new for-sale + rental construction is in the pipeline within 1–3 miles? Heavy new supply typically softens prices + rents 12–24 months out; constrained supply supports both.
Investment metrics
- 1% rule
- 0.96% ✗
- Cap rate
- 7.23%
- Cash-on-cash
- 3.35%
- DSCR
- 1.15
- GRM
- 8.7
CMA / ARV
- ARV (median comp)
- $202,847
- List price
- $182,900
- Delta
- -9.83%
- Verdict
- FAIR
- Comps
- 20 within 1.0 mi
Show comp detail 12 sales within ~0.75 mi
| Address | Dist | Beds/Ba | Sqft | Sold | Price | $/sf | Match |
|---|---|---|---|---|---|---|---|
| 10696 SW 74th Ter | 0.24mi | 3/2.0 (+1) | 1,485 (+4%) | 2mo | $225,000 | $152 | 75 |
| 7536 SW 107th Ln | 0.17mi | 3/2.0 (+1) | 1,545 (+8%) | 4mo | $288,615 | $187 | 70 |
| 11268 SW 75 Ter | 0.33mi | 2/2.0 | 1,292 (-9%) | 1mo | $135,000 | $104 | 68 |
| 10804 SW 81st Court Rd | 0.66mi | 2/2.0 | 1,421 (-0%) | 1mo | $229,900 | $162 | 68 |
| 11027 SW 75th Ave | 0.08mi | 3/2.0 (+1) | 1,625 (+14%) | 1mo | $235,000 | $145 | 67 |
| 6870 SW 112th St | 0.73mi | 2/2.0 | 1,425 (+0%) | 5mo | $210,500 | $148 | 62 |
| 11233 SW 73rd Cir | 0.35mi | 2/2.0 | 1,637 (+15%) | 4mo | $245,000 | $150 | 55 |
| 6899 SW 111th Loop | 0.66mi | 2/2.0 | 1,568 (+10%) | 4mo | $280,000 | $179 | 50 |
| 10806 SW 81st Court Rd | 0.67mi | 2/2.0 | 1,262 (-11%) | 1mo | $192,500 | $153 | 49 |
| 8013 SW 108th Loop | 0.73mi | 2/2.0 | 1,271 (-11%) | 2mo | $179,900 | $142 | 47 |
| 11248 SW 78th Ct | 0.45mi | 3/2.0 (+1) | 1,226 (-14%) | 7mo | $185,000 | $151 | 45 |
| 11601 SW 77th Cir | 0.72mi | 2/2.0 | 1,227 (-14%) | 4mo | $198,500 | $162 | 40 |
Match score weights: distance 35% · size 25% · config 20% · recency 20%. Top-matched comps best support the ARV.
Projected returns pro-forma
-3.0% appreciation · 0.0% rent growth · sell at horizon
- IRR
- -14.4%
- Equity multiple
- 0.50×
- Total profit
- $-25,637
- Equity at exit
- $27,271
- IRR
- -11.4%
- Equity multiple
- 0.41×
- Total profit
- $-30,348
- Equity at exit
- $15,814
Cash invested: $51,212 (down + closing). Projections, not guarantees.
Landlord ↔ Tenant lean methodology
- Overall (STATE)
- 87 Strongly Landlord-Friendly
- State Florida
- 87 Strongly Landlord-Friendly · R+3
- County
- — inherits STATE
- City
- — inherits STATE
ZIP-level market 34476
- Rents YoY
- -2.6%
- Active inventory
- 858
- Price-to-rent
- 8.7×
Monthly cashflow live
- Estimated rent
- $1,749 high interval (Pro) →
- Mortgage (P&I)
- −$959
- Tax from tax record
- −$80 /mo · $959/yr
- Insurance
- −$76
- HOA
- −$123
- Vacancy / Maint / Mgmt
- −$367
- Net cashflow
- $143
Break-even live
Sensitivity live
| Price | -10% $247 | -5% $195 | +0% $143 | +5% $91 | +10% $40 |
|---|---|---|---|---|---|
| Rent | -10% $5 | -5% $74 | +0% $143 | +5% $212 | +10% $281 |
| Rate | -1.0pp $235 | -0.5pp $190 | base $143 | +0.5pp $96 | +1.0pp $48 |
UW: 25.0% down · 7.5% · 30yr · 1.5% tax · 5.0% vac · 8.0% maint · 8.0% mgmt
Financing live
Cash to close
- Down payment
- $45,725
- Closing costs
- $5,487
- Reserves months
- —
- Total cash needed
- —
Loan-product check · same deal, 3 products live
Conventional
25% down · 7.5% · 30yr
- Down + closing
- —
- Monthly P&I
- —
- Monthly cashflow
- —
- DSCR
- —
- Eligible?
- —
Personal DTI + credit; lowest rate.
DSCR
20% down · 8.5% · 30yr
- Down + closing
- —
- Monthly P&I
- —
- Monthly cashflow
- —
- DSCR
- —
- Eligible?
- —
No personal income docs; deal must DSCR.
Hard money
10% down · 12.0% · 12mo
- Down + closing
- —
- Monthly P&I
- —
- Monthly cashflow
- —
- DSCR
- —
- Eligible?
- —
Short-term bridge; refi at stabilization.
Rent comps 16 comps
| Address | Beds | Baths | Sqft | Rent | $/sqft | DOM | Units | Dist |
|---|---|---|---|---|---|---|---|---|
| 8130 SW 108th Street Rd Ocala, FL | 2.0 | 2.0 | 1084 | $1,975 | $1.82 | 23d | 1 | 0.65mi |
| 7867 SW 115th Loop Ocala, FL | 3.0 | 2.0 | 1462 | $1,600 | $1.09 | 23d | 1 | 0.74mi |
| 10819 SW 83rd Ct Ocala, FL | 3.0 | 2.0 | 1601 | $1,495 | $0.93 | 23d | 1 | 0.85mi |
| 7750 SW 100th St Ocala, FL | 3.0 | 2.0 | 1805 | $1,750 | $0.97 | 15d | 1 | 0.93mi |
| 7750 SW 100th St Ocala, FL | 3.0 | 2.0 | 1805 | $1,795 | $0.99 | 23d | 1 | 0.93mi |
| 10912 SW 69th Cir Ocala, FL | 2.0 | 2.0 | 1169 | $1,600 | $1.37 | 23d | 1 | 1.02mi |
| 8669 SW 108th Ln Ocala, FL | 2.0 | 1.0 | 1152 | $1,250 | $1.09 | 23d | 1 | 1.17mi |
| 8287 SW 116th St Ocala, FL | 2.0 | 2.0 | 1181 | $1,550 | $1.31 | 23d | 1 | 1.19mi |
| 6345 SW 115th Street Rd Ocala, FL | 2.0 | 2.0 | 1008 | $1,400 | $1.39 | 23d | 1 | 1.20mi |
| 10441 SW 85th Ct Ocala, FL | 2.0 | 2.0 | 1090 | $1,495 | $1.37 | 23d | 1 | 1.20mi |
| 8744 SW 108th Lane Rd Ocala, FL | 3.0 | 2.0 | 1614 | $2,200 | $1.36 | 23d | 1 | 1.22mi |
| 11302 SW 62nd Cir Ocala, FL | 3.0 | 2.0 | 1526 | $2,095 | $1.37 | 23d | 1 | 1.29mi |
| 6367 SW 117th Street Rd Ocala, FL | 3.0 | 2.0 | 1602 | $2,650 | $1.65 | 23d | 1 | 1.34mi |
| 8947 SW 108th Pl Ocala, FL | 2.0 | 2.0 | 1096 | $1,500 | $1.37 | 23d | 1 | 1.46mi |
| 8942 SW 109th Ln Ocala, FL | 2.0 | 2.0 | 960 | $1,450 | $1.51 | 23d | 1 | 1.47mi |
| 14173 SW 60th Ter Unit 2 Ocala, FL | 2.0 | 2.0 | 1127 | $1,450 | $1.29 | 23d | 1 | 1.48mi |
HOA detail
- Monthly dues
- $123 · $1,476/yr
Listing history 19 events
-
2026-06-21days on market $182,900 Active 41 DOM
-
2026-06-18price $182,900 Active 38 DOM
-
2026-06-18days on market $185,400 Active 38 DOM
-
2026-06-17days on market $185,400 Active 37 DOM
-
2026-06-16days on market $185,400 Active 36 DOM
-
2026-06-15days on market $185,400 Active 35 DOM
-
2026-06-14days on market $185,400 Active 33 DOM
-
2026-06-13pricedays on market $185,400 Active 32 DOM
-
2026-06-10days on market $187,900 Active 30 DOM
-
2026-06-09days on market $187,900 Active 29 DOM
-
2026-06-08days on market $187,900 Active 28 DOM
-
2026-06-07days on market $187,900 Active 27 DOM
-
2026-06-03days on market $187,900 Active 23 DOM
-
2026-06-02days on market $187,900 Active 22 DOM
-
2026-06-01days on market $187,900 Active 21 DOM
-
2026-05-31days on market $187,900 Active 20 DOM
-
2026-05-30days on market $187,900 Active 19 DOM
-
2026-05-11$187,900 Active 1034-char remark
-
1989-09-01soldstatus $71,700
ⓘ Source: listings_history table (triggers on properties + properties_extension) + one-shot
backfill from property_details.listing_events for pre-trigger history.
Tax reassessment forecast FL · Resets to sale price
- Current annual tax
- $959 · $80/mo
- Projected year-2 tax
- $1,518 · $127/mo
- Expected delta
- +$559/yr (+$47/mo · 58.3%)
ⓘ Screening estimate from a state-policy table — verify with the county assessor before closing.
Climate risk First Street
- Flood 1/10 Low FEMA zone X (unshaded) · 0% chance over 30 yrs
- Wildfire 4/10 Moderate
- Heat 8/10 Severe 6 d/yr ≥107°F today · 19 d/yr by 30 yrs out
- Wind 9/10 Extreme 99% chance of damaging wind over 30 yrs
- Air quality 2/10 Low 2 unhealthy d/yr today · 2 by 30 yrs out
Nearby sold comps map
Loading sold comps map…
Walkable amenities ~0.75 mi
Loading nearby amenities…
Taxation est. · year 1
- Rental income
- $20,983
- − Mortgage interest
- −$10,245
- − Property taxes
- −$959
- − Insurance
- −$914
- − Repairs & maintenance
- −$1,679
- − Management
- −$1,679
- − HOA
- −$1,476
- − Depreciation
- −$5,321
- Taxable loss
- −$1,290
- Est. tax savings @ 24.0%
- +$310
- After-tax cash flow
- $2,027/yr
For passive investors: Depreciation is non-cash, so a rental often shows a tax loss while cash-flowing — sheltering income. Rental losses are passive: they offset passive income freely, and up to $25,000/yr can offset ordinary (W-2) income if you actively participate and your MAGI is under $100k (phasing out to $0 by $150k); unused losses carry forward. On sale, claimed depreciation is recaptured at up to 25%, and gains may owe capital-gains tax (a 1031 exchange can defer both). Figures are a year-1 estimate at your 24.0% rate — not tax advice; consult a CPA.
Schools (NCES district)
- District
- Marion
- NCES district ID
- 1201260
- Math proficiency
- 42% ▼ -7.00%
- Reading proficiency
- 43% ▼ -4.00%
- Median HH income
- $40,015
- Composite
- 35.61/100
- National rank
- #4890
- State rank
- #61 of 73 in FL
Livability — Liberty Triangle
No livability data for this city. (Only ~50 U.S. cities are tracked.)
Census & demographics
- Census place
- Liberty Triangle, FL
- County
- Marion County · 315,796 people
- City population
- 26,397
- Metro
- Ocala, FL
- Population (ZIP)
- 28,997
- Household income
- $65,860
- Rent vs Own
- Severe rent burden
- 204.0
Population outlook (Marion County) Hauer SSP2
- Today (2025)
- 365,905 people
- By 2030
- 376,768 · +3.0%
- By 2040
- 396,555 · +8.4%
- By 2050
- 412,723 · +12.8%
- By 2075
- 446,090 · +21.9%
- By 2100
- 436,193 · +19.2%
Race, ethnicity, and origin ACS 2023
- Neighborhood character
- Diverse neighborhood (Simpson 0.55)
- Race & ethnicity
- White 63% Hispanic / Latino 18% Black 13% Two or more races 10% Asian 1%
- Hispanic origin (detail)
- Mexican 3% Puerto Rican 8% Cuban 3%
- Common ancestry
- Romanian 3% Slovak 3% Lithuanian 3%
- Foreign-born
- 15% · Canada, Jamaica, Dominican Republic
- Languages at home
- 83% English-only · Spanish 14% Other Indo-European 1% German/W. Germanic 1%
Political lean MEDSL · Marion
- 2024 margin
- Solid R (+31.6) · D 33.8% · R 65.5%
- 2008→2024 swing
- -20.0pp toward R · 2008: -11.6pp · 2024: -31.6pp
- All cycles
- 2024: R+31.6 2020: R+25.9 2016: R+26.2 2012: R+16.2 2008: R+11.6
Not yet ingested
- Civics
- —
Market trends
- HPI YoY
- ▼ -105.22%
- Current HPI
- 189.0869
- Rent YoY
- ▼ -2.57%
- Metro
- Ocala, FL
- State GDP YoY
- ▲ 3.28%
- F500 in state
- 36
Industry mix (Fortune 500 HQ in FL)
| Industry | F500 HQs | Revenue |
|---|---|---|
| Industrial Technology | 2 | $29B |
|
||
| Insurance | 2 | $17B |
|
||
| Retail | 1 | $60B |
|
||
| Technology Distribution | 1 | $58B |
|
||
| Homebuilding | 1 | $35B |
|
||
| Technology Manufacturing | 1 | $35B |
|
||
Price history
+158.6% since first listed3 events — show timeline
- 2026-06-10 Price Changed $185,400 Stellar MLS as Distributed by MLS Grid
- 2026-05-11 Listed $187,900 Stellar MLS as Distributed by MLS Grid
- 1989-09-01 Sold (Public Records) $71,700 Public Records
Property tax history
+2.9%/yrLatest (2025): $959 · +29.6% YoY. Source: county tax records.
Cash-flow waterfall
monthlySold comps — $/sqft
last 12 mo · ≤1 miLoading sold comps…