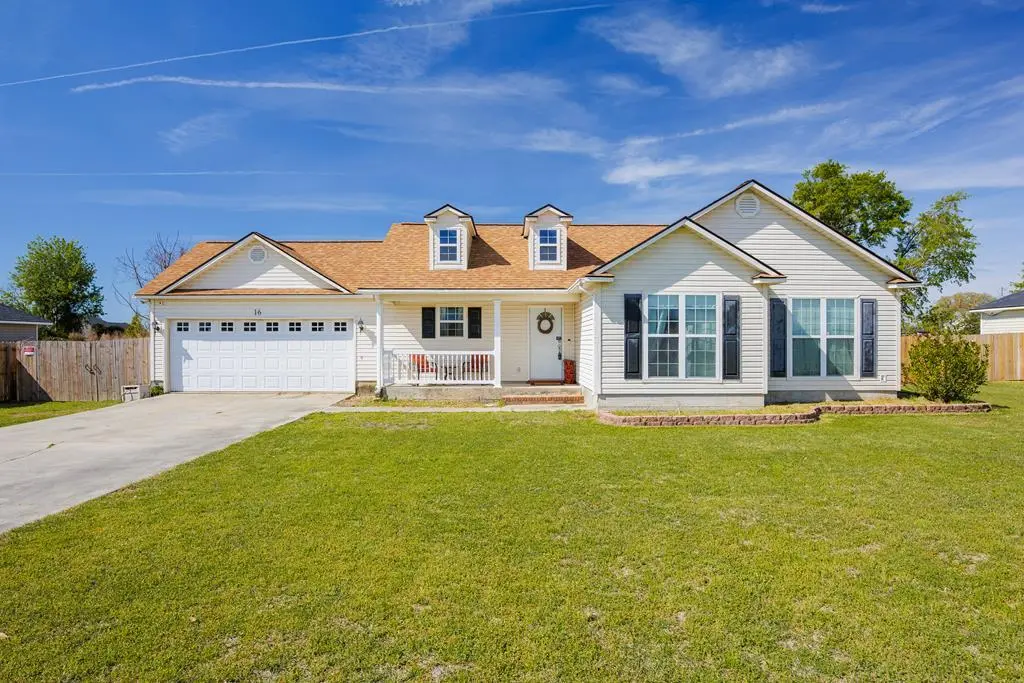
16 Jacobs Walk · Lakeland, GA
Flood risk 1/10 · Minimal
- FEMA flood zone
- X (unshaded)
- Chance of flooding over 30 yrs
- 0.0%
- Est. flood insurance / yr
- $507 – $1,088
Fire risk 7/10 · Major
- Est. fire insurance / yr
- $963 – $1,789
Heat risk 8/10 · Major
- Hot days now (above 108°F)
- 7 days/yr
- Hot days in 30 yrs
- 20 days/yr
Wind risk 8/10 · Major
- Chance of severe wind over 30 yrs
- 99.0%
Air-quality risk 6/10 · Moderate
- Unhealthy air days now
- 10 days/yr
- Unhealthy air days in 30 yrs
- 11 days/yr
Risk factors via First Street. Map © Google.
Why this score? — see what drove the D grade
The composite is a weighted blend of 9 inputs, each scored 0–100. Each bar is that input's sub-score; the figure is the points it added to the 100-point composite (weight × sub-score).
- Cash flow +9.6/30.0
- ARV discount +7.2/15.0
- Appreciation +7.2/10.0
- Schools +3.0/10.0
- Livability +3.0/5.0
- DSCR +2.7/10.0
- Rent growth +2.5/5.0
- Condition / age +2.5/5.0
- 1% rule +2.3/10.0
$225,000
🖨 Deal sheet 📄 Offer letter ✓ Due diligence
Listing remarks
If you've been trying to find a home with land, extra storage, and no major repairs waiting on you take a look at this one. 16 Jacobs Walk in Lakeland sits on a half-acre lot and offers a clean, functional setup that's getting harder to come by. Inside, you've got a 3-bedroom, 2-bath layout with around 1,425 square feet that actually works. Open living space where you need it, with enough separation to make it livable day to day. The biggest win here is already handled — a new roof installed in 2023. That's one of the main concerns buyers walk in with, and it's already off the table. Step out back and you'll find a spacious screened-in porch — the kind of space you'll actually u
Key facts
- 10x12 outbuilding
- Half-acre lot
- Screened-in porch
Tags
Neighborhood map
What this means for you Summary
Snapshot
- This is a 3-bed/2.0-bath single-family listed at $225k.
Deal economics
- At list price, monthly cash flow is $-152 ($-2k/yr) — negative.
- To cash-flow at today's rent, offer at most $198k (11.9% below list).
- To meet the 1% rule (rent ≥ 1% of price), the offer needs to be $165k (26.7% below list).
- Recommended offer: $165k (26.7% below list) — sets the bar for 1% rule.
Location & tenants
- Location reads 60/100 on livability (#379 in GA) — a middle-class / working-renter tenant base. Strengths: cost of living A+, crime B+, housing B+; Watch: health & safety D, schools D-, amenities F.
- Lanier County (rural): math 33% / reading 38% proficiency, ranked #67 of 174 in GA (top 38%) — families likely to look elsewhere, expect single-tenant / working-renter base with shorter leases; 65% free/reduced lunch — lower-income household profile, screen leases tightly.
- Market conditions: 67 active listings in the ZIP; 35 units permitted in Lanier County in 2024 (0 in 5+ unit buildings).
Forward outlook
- In year one you build about $12k of equity ($2k loan paydown + $10k appreciation (4.4% local appreciation)).
- By year 4, paydown + projected appreciation supports a ~$39k cash-out refi (75% LTV) — recoverable capital for the next deal without selling this one.
Negotiation context
- Only 13 days on market — expect competitive offers; lowballing is unlikely to land.
- 3 sale attempts since 5y ago with the ask held roughly flat each time — persistent listings suggest the price (not the market) is what's stuck; bring a comps-based counter.
- Current owner paid $176k; 27% above their basis — modest negotiation headroom, anchor on the comps not their cost.
Risks & watch-outs
- Climate carrying-cost: severe wind risk, 99% chance of damaging wind over 30y; major wildfire risk; extreme-heat days projected 7→20/yr by 2055 (HVAC capex compounding) — expect insurance premiums to compound above CPI over the hold.
Questions for the listing agent
- What do current leases actually rent for vs. the listed asking? Can we see a recent rent roll and the last 12 months of T-12 income?
- Is there a deadline driving the sale (1031 exchange, divorce, estate, relocation)? That informs how much negotiation room exists.
- Schools are D-rated, which usually means shorter tenancies and higher turnover. Who's the typical renter profile here, and what's been the actual vacancy rate?
- The area grade is low — what's the realistic commute time and amenity access for the typical tenant pool here? Any planned neighborhood developments (good or bad) we should know about?
- What's the average days-on-market for RENTAL listings here right now (not sales)? A rising rental-DOM trend means longer vacancies and softer asking-rent achievability than the comps imply.
- What's the recent tenant-quality profile in this submarket — average credit score on applications, eviction rate, late-payment / NSF rate, and stable-employment percentage? A property-management company in the area should have these aggregated.
- How much new for-sale + rental construction is in the pipeline within 1–3 miles? Heavy new supply typically softens prices + rents 12–24 months out; constrained supply supports both.
Investment metrics
- 1% rule
- 0.73% ✗
- Cap rate
- 5.48%
- Cash-on-cash
- -2.89%
- DSCR
- 0.87
- GRM
- 11.4
CMA / ARV
- ARV (on-the-fly)
- $223,725
- Comps found
- 12
Show comp detail 12 sales within ~0.75 mi
| Address | Dist | Beds/Ba | Sqft | Sold | Price | $/sf | Match |
|---|---|---|---|---|---|---|---|
| 16 Jacobs Walk | 0.00mi | 3/2.0 | 1,425 (0%) | 1mo | $225,000 | $158 | 99 |
| 16 Ridge Rd | 0.09mi | 3/2.0 | 1,416 (-1%) | 6mo | $208,000 | $147 | 89 |
| 44 Jacobs Walk | 0.15mi | 3/2.0 | 1,453 (+2%) | 0mo | $195,000 | $134 | 89 |
| 44 Jacobs Walk #12 | 0.15mi | 3/2.0 | 1,453 (+2%) | 0mo | $195,000 | $134 | 89 |
| 38 Jacob's Walk | 0.11mi | 3/2.0 | 1,435 (+1%) | 10mo | $226,000 | $157 | 85 |
| 25 Smith Dairy Rd | 0.31mi | 3/2.0 | 1,416 (-1%) | 1mo | $245,000 | $173 | 83 |
| 25 Smith Dairy Rd | 0.31mi | 3/2.0 | 1,416 (-1%) | 1mo | $245,000 | $173 | 83 |
| 20 Ridge Rd | 0.10mi | 3/2.0 | 1,556 (+9%) | 2mo | $239,150 | $154 | 78 |
| 9 Smith Dairy Rd | 0.21mi | 3/2.0 | 1,523 (+7%) | 2mo | $257,000 | $169 | 77 |
| 531 Boyette Rd | 0.27mi | 3/2.0 | 1,638 (+15%) | 3mo | $245,000 | $150 | 60 |
| 5 Ridge Rd | 0.15mi | 3/2.0 | 1,595 (+12%) | 22mo | $219,000 | $137 | 55 |
| 47 Ridge Rd | 0.20mi | 3/2.0 | 1,238 (-13%) | 23mo | $205,000 | $166 | 50 |
Match score weights: distance 35% · size 25% · config 20% · recency 20%. Top-matched comps best support the ARV.
Projected returns pro-forma
4.42% appreciation · 3.0% rent growth · sell at horizon
- IRR
- 8.9%
- Equity multiple
- 1.55×
- Total profit
- $34,796
- Equity at exit
- $119,683
- IRR
- 10.7%
- Equity multiple
- 2.86×
- Total profit
- $117,243
- Equity at exit
- $200,362
Cash invested: $63,000 (down + closing). Projections, not guarantees.
Landlord ↔ Tenant lean methodology
- Overall (STATE)
- 90 Strongly Landlord-Friendly
- State Georgia
- 90 Strongly Landlord-Friendly · R+3
- County
- — inherits STATE
- City
- — inherits STATE
ZIP-level market 31635
- Home prices YoY
- 2.2%
- Active inventory
- 67
- Price-to-rent
- 11.4×
Monthly cashflow live
- Estimated rent
- $1,649 medium interval (Pro) →
- Mortgage (P&I)
- −$1,180
- Tax from tax record
- −$181 /mo · $2,175/yr
- Insurance
- −$94
- HOA
- −$0
- Vacancy / Maint / Mgmt
- −$346
- Net cashflow
- $-152
Break-even live
UW: 25.0% down · 7.5% · 30yr · 1.5% tax · 5.0% vac · 8.0% maint · 8.0% mgmt
Financing live
Cash to close
- Down payment
- $56,250
- Closing costs
- $6,750
- Reserves months
- —
- Total cash needed
- —
Loan-product check · same deal, 3 products live
Conventional
25% down · 7.5% · 30yr
- Down + closing
- —
- Monthly P&I
- —
- Monthly cashflow
- —
- DSCR
- —
- Eligible?
- —
Personal DTI + credit; lowest rate.
DSCR
20% down · 8.5% · 30yr
- Down + closing
- —
- Monthly P&I
- —
- Monthly cashflow
- —
- DSCR
- —
- Eligible?
- —
No personal income docs; deal must DSCR.
Hard money
10% down · 12.0% · 12mo
- Down + closing
- —
- Monthly P&I
- —
- Monthly cashflow
- —
- DSCR
- —
- Eligible?
- —
Short-term bridge; refi at stabilization.
Listing history 7 events
-
2026-04-08status Pending
-
2026-04-02status Active
-
2026-03-26status Pending
-
2026-03-19$225,000 Active
-
2022-01-19soldstatus $176,500
-
2022-01-14soldstatus $176,500
-
2021-11-04$169,900
ⓘ Source: listings_history table (triggers on properties + properties_extension) + one-shot
backfill from property_details.listing_events for pre-trigger history.
Tax reassessment forecast GA · Resets to sale price
- Current annual tax
- $2,175 · $181/mo
- Projected year-2 tax
- $2,175 · $181/mo
- Expected delta
- $0/yr ($0/mo · 0.0%)
ⓘ Screening estimate from a state-policy table — verify with the county assessor before closing.
Climate risk First Street
- Flood 1/10 Low FEMA zone X (unshaded) · 0% chance over 30 yrs
- Wildfire 7/10 Severe
- Heat 8/10 Severe 7 d/yr ≥108°F today · 20 d/yr by 30 yrs out
- Wind 8/10 Severe 99% chance of damaging wind over 30 yrs
- Air quality 6/10 Major 10 unhealthy d/yr today · 11 by 30 yrs out
Nearby sold comps map
Loading sold comps map…
Walkable amenities ~0.75 mi
Loading nearby amenities…
Taxation est. · year 1
- Rental income
- $19,793
- − Mortgage interest
- −$12,603
- − Property taxes
- −$2,175
- − Insurance
- −$1,125
- − Repairs & maintenance
- −$1,583
- − Management
- −$1,583
- − Depreciation
- −$6,545
- Taxable loss
- −$5,823
- Est. tax savings @ 24.0%
- +$1,398
- After-tax cash flow
- $-425/yr
For passive investors: Depreciation is non-cash, so a rental often shows a tax loss while cash-flowing — sheltering income. Rental losses are passive: they offset passive income freely, and up to $25,000/yr can offset ordinary (W-2) income if you actively participate and your MAGI is under $100k (phasing out to $0 by $150k); unused losses carry forward. On sale, claimed depreciation is recaptured at up to 25%, and gains may owe capital-gains tax (a 1031 exchange can defer both). Figures are a year-1 estimate at your 24.0% rate — not tax advice; consult a CPA.
Schools (NCES district)
- District
- Lanier County
- NCES district ID
- 1303240
- Math proficiency
- 33% ▼ -8.00%
- Reading proficiency
- 38% ▼ -2.00%
- Median HH income
- $38,019
- Composite
- 29.6/100
- National rank
- #6476
- State rank
- #67 of 174 in GA
Livability — Lakeland
- Score
- 60/100
- State rank
- #379
- US rank
- #19151
Category grades
Schools grade is shown separately in the Schools card above.
Census & demographics
- Population (ZIP)
- 6,978
Population outlook (Lanier County) Hauer SSP2
- Today (2025)
- 10,743 people
- By 2030
- 10,892 · +1.4%
- By 2040
- 10,975 · +2.2%
- By 2050
- 10,764 · +0.2%
- By 2075
- 9,418 · -12.3%
- By 2100
- 7,419 · -30.9%
Race, ethnicity, and origin ACS 2023
- Neighborhood character
- Majority White (65%)
- Race & ethnicity
- White 65% Black 29% Hispanic / Latino 4% Two or more races 3%
- Common ancestry
- Iranian 2% Italian 1% Romanian 1%
- Foreign-born
- 2% · Canada, Jamaica
- Languages at home
- 95% English-only · Spanish 3% German/W. Germanic 1% Korean 1%
Political lean MEDSL · Lanier
- 2024 margin
- Solid R (+46.3) · D 26.6% · R 73.0%
- 2008→2024 swing
- -21.1pp toward R · 2008: -25.2pp · 2024: -46.3pp
- All cycles
- 2024: R+46.3 2020: R+41.7 2016: R+41.2 2012: R+23.8 2008: R+25.2
Not yet ingested
- Civics
- —
Market trends
- HPI YoY
- ▲ 4.42%
- Current HPI
- 201.1664
- Rent YoY
- —
- Metro
- —
- State GDP YoY
- ▲ 2.66%
- F500 in state
- 28
Industry mix (Fortune 500 HQ in GA)
| Industry | F500 HQs | Revenue |
|---|---|---|
| Paper / Packaging | 2 | $29B |
|
||
| Retail | 1 | $160B |
|
||
| Transportation / Logistics | 1 | $91B |
|
||
| Airlines | 1 | $62B |
|
||
| Consumer Goods | 1 | $47B |
|
||
| Utilities | 1 | $25B |
|
||
Price history
+32.4% since first listed7 events — show timeline
- 2026-04-08 Pending — SGMLS
- 2026-04-02 Relisted — SGMLS
- 2026-03-26 Pending — SGMLS
- 2026-03-19 Listed $225,000 SGMLS
- 2022-01-19 Sold (Public Records) $176,500 Public Records
- 2022-01-14 Sold (MLS) $176,500 SGMLS
- 2021-11-04 Listed $169,900 SGMLS
Property tax history
+2.3%/yrLatest (2025): $2,175 · -0.0% YoY. Source: county tax records.
Cash-flow waterfall
monthlySold comps — $/sqft
last 12 mo · ≤1 miLoading sold comps…