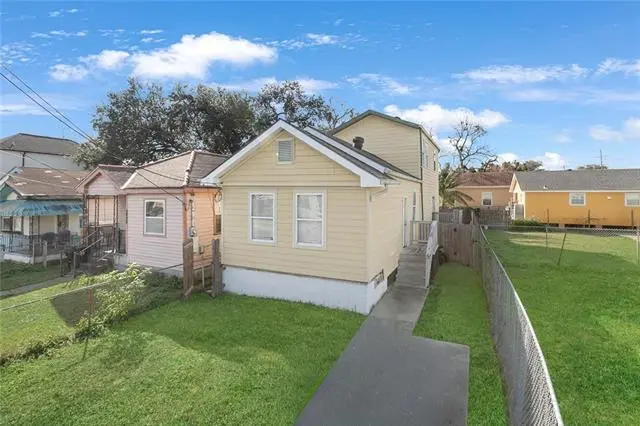
5822 Lafaye St · New Orleans, LA
Flood risk 9/10 · Severe
- FEMA flood zone
- AE
- Chance of flooding over 30 yrs
- 0.78%
- Est. flood insurance / yr
- $1,737 – $8,500
Fire risk 1/10 · Minimal
- Est. fire insurance / yr
- $1,269 – $2,357
Heat risk 10/10 · Severe
- Hot days now (above 107°F)
- 7 days/yr
- Hot days in 30 yrs
- 21 days/yr
Wind risk 10/10 · Severe
- Chance of severe wind over 30 yrs
- 99.0%
Air-quality risk 3/10 · Minor
- Unhealthy air days now
- 3 days/yr
- Unhealthy air days in 30 yrs
- 3 days/yr
Risk factors via First Street. Map © Google.
Why this score? — see what drove the C grade
The composite is a weighted blend of 9 inputs, each scored 0–100. Each bar is that input's sub-score; the figure is the points it added to the 100-point composite (weight × sub-score).
- Cash flow +26.3/30.0
- DSCR +9.0/10.0
- 1% rule +6.4/10.0
- ARV discount +5.5/15.0
- Livability +4.0/5.0
- Condition / age +2.5/5.0
- Rent growth +2.3/5.0
- Schools +1.6/10.0
- Appreciation +0.0/10.0
$159,900
🖨 Deal sheet (PDF) 📄 Offer letter ✓ Due diligence
Listing remarks MLS
Spacious 4-bedroom, 2-bath home in New Orleans featuring an open-concept living, dining, and kitchen area-- for modern living and entertaining. The downstairs primary suite offers privacy and convenience, complemented by three additional bedrooms for guests, family, or a home office. Stylish finishes and a functional layout provide great flow throughout. Enjoy the New Orleans lifestyle with comfortable indoor spaces and easy potential for outdoor living.
Key facts
- Parking
- Built 1939
- Listed 9 days
Property features AI
Exterior
- Parking: Driveway; One parking space
- Utilities: Public water; Public sewer
- Home design: 2-story home; Very good condition
- Construction: Vinyl siding; Shingle roof
- Exterior features: Fence; City lot; Rectangular lot; Lot dimensions approximately 26 x 100; Raised foundation
Interior
- Kitchen: Dishwasher; Oven; Range
- Bathrooms: 3 full bathrooms
- Heating & cooling: Central heating; Central air conditioning
- Interior features: Ceiling fan(s)
- Laundry & utility: Washer hookup; Dryer hookup
Neighborhood map
What this means for you Summary
Snapshot
- This is a 3-bed/2.0-bath single-family listed at $160k.
Deal economics
- At list price, monthly cash flow is $-11 ($-135/yr) — negative.
- To cash-flow at today's rent, offer at most $158k (1.2% below list).
- Meets the 1% rule at list price ($2k rent vs $160k).
- Recommended offer: $158k (1.2% below list) — sets the bar for cash-flow.
- Cap rate 9.4% vs local median 4.4% in New Orleans — top-decile yield for the area; either an underpriced asset or a hidden risk that comps aren't pricing in. Stress-test before assuming the spread holds.
Location & tenants
- Location reads 81/100 on livability (#3 in LA, #1,383 nationally) — a professional / high-income tenant draw. Strengths: amenities A+, commute A+, health & safety A+; Watch: crime C-, employment D.
- Orleans Parish (urban): math 11% / reading 27% proficiency, ranked #69 of 98 in LA (top 70%) — low school quality limits family demand, transient renter base, plan for 1-2y turnover; 68% free/reduced lunch — lower-income household profile, screen leases tightly.
- Market conditions: Rents soft (-0.6%/yr); 332 active listings in the ZIP; 40 comparable units currently listed for rent nearby; rentals at typical pace (median 25d on market — plan ~3-4 weeks tenant-placement turnaround); 710 units permitted in Orleans Parish in 2024 (244 in 5+ unit buildings).
- This rent runs 44% of the median local income ($49k/yr) — at the standard rent-burdened threshold; future hikes will face affordability resistance.
Forward outlook
- Local home prices are declining (-3.0%/yr); year-one equity from $1k of loan paydown is wiped out by about $5k of value loss. Plan a longer hold.
- Orleans County population projected at +61% by 2050 — long-run rental-demand tailwind backs the buy-and-hold thesis.
Negotiation context
- Only 9 days on market — expect competitive offers; lowballing is unlikely to land.
- 6 sale attempts since 8y ago with the ask held roughly flat each time — persistent listings suggest the price (not the market) is what's stuck; bring a comps-based counter.
Risks & watch-outs
- Watch-outs: flood insurance adds $427/mo; built in 1939 — expect roof / HVAC / electrical / plumbing capex.
- Climate carrying-cost: in FEMA flood zone AE (mandatory federal flood insurance); severe wind risk, 99% chance of damaging wind over 30y; extreme-heat days projected 7→21/yr by 2055 (HVAC capex compounding) — expect insurance premiums to compound above CPI over the hold.
Questions for the listing agent
- What do current leases actually rent for vs. the listed asking? Can we see a recent rent roll and the last 12 months of T-12 income?
- Built in 1939 — when were the roof, HVAC, electrical panel, plumbing, and water heater last replaced?
- What's the actual annual flood-insurance premium (NFIP or private), and is the property in a SFHA with mandatory coverage?
- Is there a deadline driving the sale (1031 exchange, divorce, estate, relocation)? That informs how much negotiation room exists.
- What's the average days-on-market for RENTAL listings here right now (not sales)? A rising rental-DOM trend means longer vacancies and softer asking-rent achievability than the comps imply.
- What's the recent tenant-quality profile in this submarket — average credit score on applications, eviction rate, late-payment / NSF rate, and stable-employment percentage? A property-management company in the area should have these aggregated.
- How much new for-sale + rental construction is in the pipeline within 1–3 miles? Heavy new supply typically softens prices + rents 12–24 months out; constrained supply supports both.
Investment metrics
- 1% rule
- 1.14% ✓
- Cap rate
- 9.41%
- Cash-on-cash
- 11.13%
- DSCR
- 1.50
- GRM
- 7.3
CMA / ARV
- ARV (on-the-fly)
- $153,088
- Comps found
- 12
Show comp detail 12 sales within ~0.75 mi
| Address | Dist | Beds/Ba | Sqft | Sold | Price | $/sf | Match |
|---|---|---|---|---|---|---|---|
| 5917 Campus . Blvd | 0.31mi | 3/2.0 | 1,518 (+3%) | 1mo | $170,000 | $112 | 79 |
| 5522 Eads St | 0.24mi | 3/3.0 | 1,533 (+4%) | 6mo | $160,000 | $104 | 73 |
| 6308 Peoples Ave | 0.36mi | 3/2.0 | 1,588 (+8%) | 1mo | $107,000 | $67 | 69 |
| 4318 Mendez St | 0.55mi | 3/2.0 | 1,508 (+2%) | 3mo | $60,000 | $40 | 68 |
| 5700 Peoples Ave | 0.16mi | 3/2.0 | 1,658 (+13%) | 6mo | $330,000 | $199 | 66 |
| 2656 Prentiss Ave Ave | 0.14mi | 3/1.5 | 1,669 (+13%) | 6mo | $165,000 | $99 | 64 |
| 5163 Lafaye St | 0.51mi | 3/2.0 | 1,396 (-5%) | 6mo | $130,000 | $93 | 63 |
| 5511 Saint Roch Ave | 0.45mi | 2/2.0 (-1) | 1,625 (+10%) | 5mo | $149,500 | $92 | 53 |
| 5110 Press Dr | 0.64mi | 4/2.0 (+1) | 1,553 (+6%) | 6mo | $155,000 | $100 | 51 |
| 4915 Painters St | 0.72mi | 3/2.0 | 1,331 (-10%) | 1mo | $320,000 | $240 | 50 |
| 6000 Elysian Fields Ave | 0.71mi | 3/2.0 | 1,330 (-10%) | 2mo | $254,000 | $191 | 49 |
| 5145 Lafaye St | 0.53mi | 4/3.0 (+1) | 1,616 (+10%) | 2mo | $321,000 | $199 | 48 |
Match score weights: distance 35% · size 25% · config 20% · recency 20%. Top-matched comps best support the ARV.
Projected returns pro-forma
-3.0% appreciation · 0.0% rent growth · sell at horizon
- IRR
- -21.2%
- Equity multiple
- 0.29×
- Total profit
- $-31,713
- Equity at exit
- $23,842
- IRR
- -28.1%
- Equity multiple
- -0.08×
- Total profit
- $-48,147
- Equity at exit
- $13,825
Cash invested: $44,772 (down + closing). Projections, not guarantees.
Landlord ↔ Tenant lean methodology
- Overall (STATE)
- 90 Strongly Landlord-Friendly
- State Louisiana
- 90 Strongly Landlord-Friendly · R+12
- County
- — inherits STATE
- City
- — inherits STATE
ZIP-level market 70122
- Rents YoY
- -0.6%
- Active inventory
- 332
- Price-to-rent
- 7.3×
Monthly cashflow live
- Estimated rent
- $1,816 high interval (Pro) →
- Mortgage (P&I)
- −$839
- Tax from tax record
- −$115 /mo · $1,374/yr
- Insurance
- −$67
- Flood insurance flood zone
- −$427 /mo · $5,118/yr
- HOA
- −$0
- Vacancy / Maint / Mgmt
- −$381
- Net cashflow
- $-11
Break-even live
Sensitivity live
| Price | -10% $79 | -5% $34 | +0% $-11 | +5% $-57 | +10% $-102 |
|---|---|---|---|---|---|
| Rent | -10% $-155 | -5% $-83 | +0% $-11 | +5% $61 | +10% $132 |
| Rate | -1.0pp $69 | -0.5pp $29 | base $-11 | +0.5pp $-53 | +1.0pp $-95 |
UW: 25.0% down · 7.5% · 30yr · 1.5% tax · 5.0% vac · 8.0% maint · 8.0% mgmt
Financing live
Cash to close
- Down payment
- $39,975
- Closing costs
- $4,797
- Reserves months
- —
- Total cash needed
- —
Loan-product check · same deal, 3 products live
Conventional
25% down · 7.5% · 30yr
- Down + closing
- —
- Monthly P&I
- —
- Monthly cashflow
- —
- DSCR
- —
- Eligible?
- —
Personal DTI + credit; lowest rate.
DSCR
20% down · 8.5% · 30yr
- Down + closing
- —
- Monthly P&I
- —
- Monthly cashflow
- —
- DSCR
- —
- Eligible?
- —
No personal income docs; deal must DSCR.
Hard money
10% down · 12.0% · 12mo
- Down + closing
- —
- Monthly P&I
- —
- Monthly cashflow
- —
- DSCR
- —
- Eligible?
- —
Short-term bridge; refi at stabilization.
Rent comps 40 comps
| Address | Beds | Baths | Sqft | Rent | $/sqft | DOM | Units | Dist |
|---|---|---|---|---|---|---|---|---|
| 5905 Lafaye St New Orleans, LA | 3.0 | 1.0 | 911 | $1,700 | $1.87 | 24d | 1 | 0.07mi |
| 6036 Franklin Ave New Orleans, LA | 2.0 | 1.0 | 898 | $1,200 | $1.34 | 17d | 1 | 0.20mi |
| 2458 Athis St New Orleans, LA | 4.0 | 2.0 | 1530 | $2,200 | $1.44 | 24d | 1 | 0.26mi |
| 6226 Lafaye St New Orleans, LA | 2.0 | 2.0 | 1137 | $2,600 | $2.29 | 44d | 1 | 0.30mi |
| 6226 Lafaye St New Orleans, LA | 2.0 | 2.0 | 1137 | $2,600 | $2.29 | 12d | 1 | 0.30mi |
| 5925 Saint Roch Ave New Orleans, LA | 2.0 | 1.0 | 1000 | $1,550 | $1.55 | 17d | 1 | 0.36mi |
| 2512 Mexico St New Orleans, LA | 3.0 | 2.0 | 975 | $1,550 | $1.59 | 24d | 1 | 0.38mi |
| 6222 Arts St Unit 6226 New Orleans, LA | 2.0 | 1.5 | 1120 | $1,250 | $1.12 | 24d | 1 | 0.38mi |
| 5550 Press Dr New Orleans, LA | 3.0 | 2.0 | 1640 | $2,000 | $1.22 | 16d | 1 | 0.46mi |
| 2312 Madrid St New Orleans, LA | 2.0 | 1.0 | 1100 | $1,475 | $1.34 | 24d | 1 | 0.50mi |
| 5172 Venus St Unit 5172 New Orleans, LA | 3.0 | 2.5 | 1864 | $2,450 | $1.31 | 24d | 1 | 0.51mi |
| 2701 03 Frankfort St New Orleans, LA | 3.0 | 1.0 | 1100 | $1,850 | $1.68 | 24d | 1 | 0.52mi |
| 6530 Peoples Ave New Orleans, LA | 3.0 | 2.0 | 1200 | $1,800 | $1.50 | 24d | 1 | 0.54mi |
| 5519 Mandeville St New Orleans, LA | 3.0 | 1.0 | 1125 | $1,650 | $1.47 | 4d | 1 | 0.54mi |
| 6329 Spain St New Orleans, LA | 3.0 | 2.0 | 1545 | $2,100 | $1.36 | 16d | 1 | 0.57mi |
| 4936 Baccich St New Orleans, LA | 3.0 | 1.0 | 1053 | $1,700 | $1.61 | 24d | 1 | 0.65mi |
| 4767 Lafaye St New Orleans, LA | 3.0 | 2.0 | 1469 | $2,000 | $1.36 | 24d | 1 | 0.73mi |
| 5718 Vermillion Blvd Unit A New Orleans, LA | 3.0 | 1.0 | 1300 | $2,000 | $1.54 | 24d | 1 | 0.75mi |
| 5723 Pasteur Blvd New Orleans, LA | 3.0 | 2.0 | 1150 | $1,700 | $1.48 | 17d | 1 | 0.77mi |
| 6009 Pasteur Blvd New Orleans, LA | 3.0 | 2.0 | 1250 | $1,785 | $1.43 | 24d | 1 | 0.78mi |
| 6202 Vermillion Blvd New Orleans, LA | 3.0 | 2.0 | 1200 | $1,700 | $1.42 | 16d | 1 | 0.79mi |
| 5546 Pasteur Blvd Unit A New Orleans, LA | 3.0 | 1.0 | 1200 | $1,400 | $1.17 | 24d | 1 | 0.83mi |
| 4681 Eastern St New Orleans, LA | 2.0 | 1.0 | 1100 | $1,400 | $1.27 | 16d | 1 | 0.84mi |
| 4722 Mithra St New Orleans, LA | 3.0 | 1.5 | 1295 | $1,600 | $1.24 | 24d | 1 | 0.85mi |
| 6217 Curie St New Orleans, LA | 3.0 | 2.0 | 1700 | $1,500 | $0.88 | 24d | 1 | 0.87mi |
| 6235 Curie St Unit 6235 New Orleans, LA | 2.0 | 1.0 | 1000 | $1,350 | $1.35 | 11d | 1 | 0.88mi |
| 6235 Curie St New Orleans, LA | 2.0 | 1.0 | 1000 | $1,400 | $1.40 | 24d | 1 | 0.88mi |
| 6237 Curie St New Orleans, LA | 2.0 | 1.0 | 1000 | $1,400 | $1.40 | 24d | 1 | 0.89mi |
| 6237 Curie St Unit 6237 New Orleans, LA | 2.0 | 1.0 | 1000 | $1,350 | $1.35 | 4d | 1 | 0.89mi |
| 5925 Pauline Dr New Orleans, LA | 3.0 | 2.0 | 1566 | $2,325 | $1.48 | 16d | 1 | 0.92mi |
| 5747 Pauline Dr New Orleans, LA | 3.0 | 1.0 | 1300 | $1,400 | $1.08 | 12d | 1 | 0.93mi |
| 6079 Saint Anthony Ave New Orleans, LA | 3.0 | 2.0 | 1400 | $2,400 | $1.71 | 16d | 1 | 0.93mi |
| 5700 Saint Anthony Ave New Orleans, LA | 2.0 | 1.0 | 875 | $1,195 | $1.37 | 4d | 1 | 0.97mi |
| 1940 Allen Toussaint Blvd Unit 1940 New Orleans, LA | 3.0 | 2.0 | 1500 | $1,600 | $1.07 | 24d | 1 | 0.99mi |
| 1940 Allen Toussaint Blvd New Orleans, LA | 3.0 | 2.0 | 1500 | $1,550 | $1.03 | 12d | 1 | 0.99mi |
| 5322 Saint Anthony Ave New Orleans, LA | 3.0 | 2.0 | 1192 | $2,000 | $1.68 | 16d | 1 | 1.00mi |
| 5700 Wilton Dr New Orleans, LA | 2.0 | 1.0 | 900 | $1,500 | $1.67 | 16d | 1 | 1.00mi |
| 6090 Wilton Dr New Orleans, LA | 2.0 | 1.0 | 1020 | $1,400 | $1.37 | 3d | 1 | 1.02mi |
| 5151 Saint Anthony Ave New Orleans, LA | 3.0 | 2.0 | 1200 | $1,795 | $1.50 | 16d | 1 | 1.03mi |
| 1903 Rosary Dr New Orleans, LA | 3.0 | 2.0 | 1500 | $1,800 | $1.20 | 24d | 1 | 1.04mi |
Listing history 7 events
-
2026-06-18days on market $159,900 Active 9 DOM
-
2026-06-17days on market $159,900 Active 8 DOM
-
2026-06-16days on market $159,900 Active 7 DOM
-
2026-06-15days on market $159,900 Active 6 DOM
-
2026-06-13days on market $159,900 Active 4 DOM
-
2026-06-10remarks 457-char remark
-
2026-06-10$159,900 Active 1 DOM
ⓘ Source: listings_history table (triggers on properties + properties_extension) + one-shot
backfill from property_details.listing_events for pre-trigger history.
Tax reassessment forecast LA · Resets to sale price
- Current annual tax
- $1,374 · $115/mo
- Projected year-2 tax
- $1,374 · $115/mo
- Expected delta
- $0/yr ($0/mo · 0.0%)
ⓘ Screening estimate from a state-policy table — verify with the county assessor before closing.
Climate risk First Street
- Flood 9/10 Extreme FEMA zone AE · 78% chance over 30 yrs
- Wildfire 1/10 Low
- Heat 10/10 Extreme 7 d/yr ≥107°F today · 21 d/yr by 30 yrs out
- Wind 10/10 Extreme 99% chance of damaging wind over 30 yrs
- Air quality 3/10 Moderate 3 unhealthy d/yr today · 3 by 30 yrs out
Nearby sold comps map
Loading sold comps map…
Walkable amenities ~0.75 mi
Loading nearby amenities…
Taxation est. · year 1
- Rental income
- $21,797
- − Mortgage interest
- −$8,957
- − Property taxes
- −$1,374
- − Insurance
- −$5,918
- − Repairs & maintenance
- −$1,744
- − Management
- −$1,744
- − Depreciation
- −$4,652
- Taxable loss
- −$2,591
- Est. tax savings @ 24.0%
- +$622
- After-tax cash flow
- $487/yr
For passive investors: Depreciation is non-cash, so a rental often shows a tax loss while cash-flowing — sheltering income. Rental losses are passive: they offset passive income freely, and up to $25,000/yr can offset ordinary (W-2) income if you actively participate and your MAGI is under $100k (phasing out to $0 by $150k); unused losses carry forward. On sale, claimed depreciation is recaptured at up to 25%, and gains may owe capital-gains tax (a 1031 exchange can defer both). Figures are a year-1 estimate at your 24.0% rate — not tax advice; consult a CPA.
Schools (NCES district)
- District
- Orleans Parish
- NCES district ID
- 2201170
- Math proficiency
- 11% ▼ -52.00%
- Reading proficiency
- 27% ▼ -46.00%
- Median HH income
- $37,011
- Composite
- 15.78/100
- National rank
- #9271
- State rank
- #69 of 98 in LA
Livability — New Orleans
- Score
- 81/100
- State rank
- #3
- US rank
- #1383
Category grades
Schools grade is shown separately in the Schools card above.
Census & demographics
- Census place
- New Orleans, LA
- County
- Orleans Parish · 338,817 people
- City population
- 338,817
- Metro
- New Orleans-Metairie, LA
- Population (ZIP)
- 35,253
- Household income
- $49,455
- Rent vs Own
- Severe rent burden
- 2150.0
Population outlook (Orleans County) Hauer SSP2
- Today (2025)
- 513,025 people
- By 2030
- 575,781 · +12.2%
- By 2040
- 700,174 · +36.5%
- By 2050
- 826,541 · +61.1%
- By 2075
- 1,123,374 · +119.0%
- By 2100
- 1,355,609 · +164.2%
Race, ethnicity, and origin ACS 2023
- Neighborhood character
- Predominantly Black (69%)
- Race & ethnicity
- Black 69% White 18% Two or more races 7% Hispanic / Latino 6% Asian 1%
- Hispanic origin (detail)
- Mexican 1%
- Common ancestry
- Lithuanian 4% Italian 2% Slovak 1%
- Foreign-born
- 4% · Canada, China
- Languages at home
- 92% English-only · Spanish 5% Chinese 1% French/Haitian/Cajun 1%
Political lean MEDSL · Orleans
- 2024 margin
- Solid D (+67.0) · D 82.2% · R 15.2% · Other 2.7%
- 2008→2024 swing
- +6.7pp toward D · 2008: 60.3pp · 2024: 67.0pp
- All cycles
- 2024: D+67.0 2020: D+68.2 2016: D+66.2 2012: D+62.5 2008: D+60.3
Not yet ingested
- Civics
- —
Market trends
- HPI YoY
- ▼ -222.37%
- Current HPI
- 231.9921
- Rent YoY
- ▼ -0.61%
- Metro
- New Orleans-Metairie, LA
- State GDP YoY
- ▲ 3.29%
- F500 in state
- 10
Industry mix (Fortune 500 HQ in LA)
| Industry | F500 HQs | Revenue |
|---|---|---|
| Telecommunications | 2 | $23B |
|
||
| Utilities | 1 | $12B |
|
||
| Wholesale / Distribution | 1 | $5B |
|
||
| Advertising | 1 | $2B |
|
||
Price history
+102.4% since first listed12 events — show timeline
- 2026-06-09 Listed $159,900 GSREIN
- 2026-06-09 Listed $159,900 AcadianaMLS
- 2019-07-26 Sold (Public Records) $145,000 Public Records
- 2019-07-24 Sold (MLS) $145,000 GSREIN
- 2019-05-23 Pending — GSREIN
- 2019-04-29 Price Changed $139,000 GSREIN
- 2019-03-04 Listed $149,000 GSREIN
- 2019-03-04 Listed $139,000 AcadianaMLS
- 2018-08-28 Listing Removed — GSREIN
- 2018-07-13 Listed $149,000 GSREIN
- 2018-07-13 Listed $149,000 AcadianaMLS
- 2001-04-05 Sold (Public Records) $79,000 Public Records
Property tax history
-3.5%/yrLatest (2026): $1,374 · -16.9% YoY. Source: county tax records.
Cash-flow waterfall
monthlySold comps — $/sqft
last 12 mo · ≤1 miLoading sold comps…