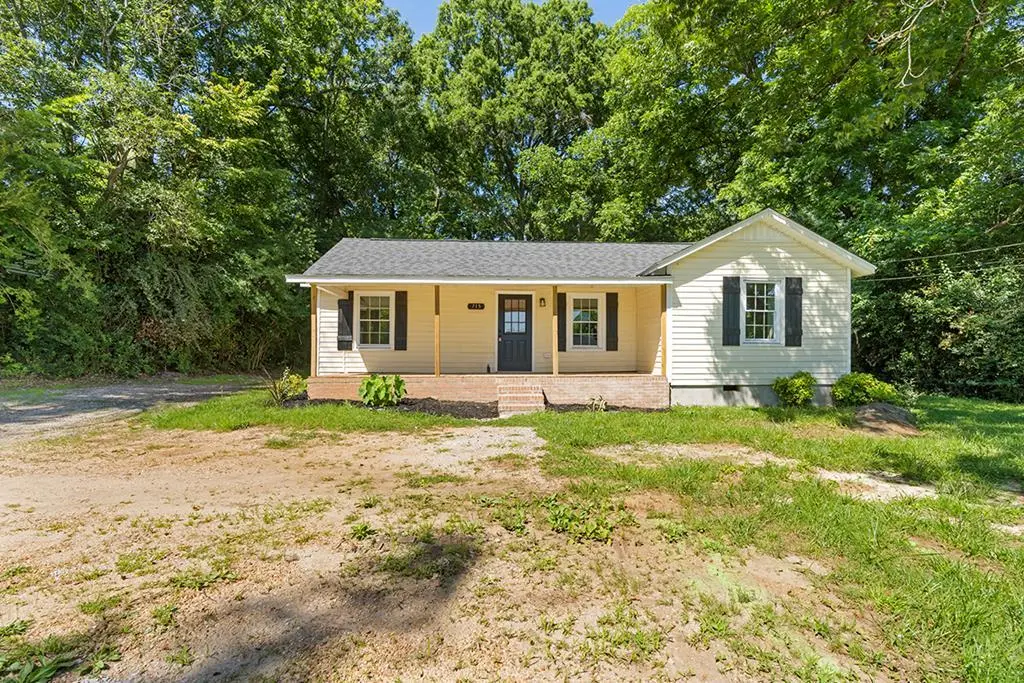
715 Main Street St S · Abbeville, SC
Flood risk 1/10 · Minimal
- FEMA flood zone
- X (unshaded)
- Chance of flooding over 30 yrs
- 0.0%
- Est. flood insurance / yr
- $507 – $1,088
Fire risk 4/10 · Minor
- Est. fire insurance / yr
- $783 – $1,453
Heat risk 6/10 · Moderate
- Hot days now (above 106°F)
- 7 days/yr
- Hot days in 30 yrs
- 17 days/yr
Wind risk 6/10 · Moderate
- Chance of severe wind over 30 yrs
- 27.0%
Air-quality risk 2/10 · Minimal
- Unhealthy air days now
- 2 days/yr
- Unhealthy air days in 30 yrs
- 2 days/yr
Risk factors via First Street. Map © Google.
Why this score? — see what drove the D- grade
The composite is a weighted blend of 9 inputs, each scored 0–100. Each bar is that input's sub-score; the figure is the points it added to the 100-point composite (weight × sub-score).
- Appreciation +10.0/10.0
- Cash flow +9.1/30.0
- Schools +4.1/10.0
- Livability +3.3/5.0
- DSCR +2.5/10.0
- Rent growth +2.5/5.0
- Condition / age +2.5/5.0
- 1% rule +2.2/10.0
- ARV discount +0.0/15.0
$173,500
🖨 Deal sheet (PDF) 📄 Offer letter ✓ Due diligence
Listing remarks
Welcome home to this charming 3-bedroom, 2-bathroom home where the front porch invites you to slow down and enjoy the outdoors. The renovated open-concept kitchen is the heart of the home — spacious, bright, and ready for making memories. The primary suite is a retreat in the making, complete with a walk-in closet and a beautifully updated walk-in shower. A second renovated bathroom with an adjacent laundry room keeps daily life simple and functional. This home is move-in ready and waiting for its next chapter.
Key facts
- Renovated bathroom
- Open-concept kitchen
- Walk-in closet
Tags
Property features AI
Exterior
- Utilities: Sewer connected
- Home design: Single-family detached residence; Residential property
- Construction: Vinyl siding
- Exterior features: Cleared lot; Level lot
Interior
- Kitchen: Microwave; Electric water heater
- Flooring: Laminate flooring; Vinyl flooring
- Bathrooms: 2 full bathrooms
- Heating & cooling: Electric heating; Central electric air conditioning
- Interior features: Eat-in kitchen; Walk-in closet(s)
Neighborhood map
What this means for you Summary
Snapshot
- This is a 3-bed/2.0-bath single-family listed at $174k.
Deal economics
- At list price, monthly cash flow is $-134 ($-2k/yr) — negative.
- To cash-flow at today's rent, offer at most $150k (13.7% below list).
- To meet the 1% rule (rent ≥ 1% of price), the offer needs to be $124k (28.2% below list).
- Recommended offer: $124k (28.2% below list) — sets the bar for 1% rule.
- Cap rate 5.4% vs local median 4.5% in Abbeville — meaningfully above typical; check what's discounted (condition, days-on-market, listing class) to confirm the premium yield is real.
Location & tenants
- Location reads 66/100 on livability (#111 in SC) — a middle-class / working-renter tenant base. Strengths: cost of living A+, housing A+; Watch: health & safety C-, amenities F, commute F.
- Abbeville 60 (rural): math 50% / reading 49% proficiency, ranked #15 of 80 in SC (top 19%) — families likely to look elsewhere, expect single-tenant / working-renter base with shorter leases.
- Zoned schools: Long Cane Primary (335 students, 100% FRL); Wright Middle (math 37% / reading 39%, grade F, #86 of 229 statewide, top 39%, 346 students, 100% FRL); Abbeville High (math 77% / reading 77%, grade A-, #28 of 196 statewide, top 16%, 473 students, 74% FRL) — zoned schools average 91% FRL vs 57% district-wide (35 pts higher); higher-poverty schools than district average — tighter screening recommended.
- Market conditions: 110 active listings in the ZIP; 1 comparable units currently listed for rent nearby; 145 units permitted in Abbeville County in 2024 (0 in 5+ unit buildings).
Forward outlook
- In year one you build about $19k of equity ($1k loan paydown + $17k appreciation (10.0% local appreciation)).
- Abbeville County population projected at -17% by 2050 — secular population decline; favor cash flow + early exit over multi-decade hold.
- By year 3, paydown + projected appreciation supports a ~$47k cash-out refi (75% LTV) — recoverable capital for the next deal without selling this one.
Negotiation context
- Only 14 days on market — expect competitive offers; lowballing is unlikely to land.
- Current owner paid $20k; list at $174k implies a 768% gain — meaningful room to come down on a strong offer.
Risks & watch-outs
- Watch-outs: built in 1930 — expect roof / HVAC / electrical / plumbing capex.
- Climate carrying-cost: major wind risk, 27% chance of damaging wind over 30y; extreme-heat days projected 7→17/yr by 2055 (HVAC capex compounding) — expect insurance premiums to compound above CPI over the hold.
Questions for the listing agent
- What do current leases actually rent for vs. the listed asking? Can we see a recent rent roll and the last 12 months of T-12 income?
- Built in 1930 — when were the roof, HVAC, electrical panel, plumbing, and water heater last replaced?
- Is there a deadline driving the sale (1031 exchange, divorce, estate, relocation)? That informs how much negotiation room exists.
- The area grade is low — what's the realistic commute time and amenity access for the typical tenant pool here? Any planned neighborhood developments (good or bad) we should know about?
- What's the average days-on-market for RENTAL listings here right now (not sales)? A rising rental-DOM trend means longer vacancies and softer asking-rent achievability than the comps imply.
- What's the recent tenant-quality profile in this submarket — average credit score on applications, eviction rate, late-payment / NSF rate, and stable-employment percentage? A property-management company in the area should have these aggregated.
- How much new for-sale + rental construction is in the pipeline within 1–3 miles? Heavy new supply typically softens prices + rents 12–24 months out; constrained supply supports both.
Investment metrics
- 1% rule
- 0.72% ✗
- Cap rate
- 5.36%
- Cash-on-cash
- -3.32%
- DSCR
- 0.85
- GRM
- 11.6
CMA / ARV
- ARV (on-the-fly)
- $148,645
- Comps found
- 8
Show comp detail 8 sales within ~0.75 mi
| Address | Dist | Beds/Ba | Sqft | Sold | Price | $/sf | Match |
|---|---|---|---|---|---|---|---|
| 601 Secession Ave | 0.22mi | 2/1.0 (-1) | 900 (-6%) | 11mo | $10,000 | $11 | 62 |
| 206 Henry M Turner St | 0.42mi | 2/1.0 (-1) | 986 (+3%) | 7mo | $121,000 | $123 | 61 |
| 707 Brooks | 0.37mi | 2/1.0 (-1) | 985 (+3%) | 11mo | $154,000 | $156 | 60 |
| 1206 Secession Ave | 0.66mi | 3/1.0 | 1,000 (+4%) | 6mo | $20,000 | $20 | 53 |
| 216 Vienna St | 0.59mi | 2/1.0 (-1) | 955 (-0%) | 19mo | $189,100 | $198 | 47 |
| 100 Langley St | 0.34mi | 2/1.5 (-1) | 1,060 (+10%) | 16mo | $169,900 | $160 | 46 |
| 108 Cambridge Drive Dr | 0.69mi | 2/1.0 (-1) | 1,000 (+4%) | 21mo | $154,000 | $154 | 34 |
| 120 Calhoun St | 0.47mi | 2/2.0 (-1) | 1,100 (+15%) | 24mo | $170,000 | $155 | 29 |
Match score weights: distance 35% · size 25% · config 20% · recency 20%. Top-matched comps best support the ARV.
Projected returns pro-forma
10.0% appreciation · 3.0% rent growth · sell at horizon
- IRR
- 21.9%
- Equity multiple
- 2.77×
- Total profit
- $85,901
- Equity at exit
- $156,303
- IRR
- 19.7%
- Equity multiple
- 6.34×
- Total profit
- $259,634
- Equity at exit
- $337,072
Cash invested: $48,580 (down + closing). Projections, not guarantees.
Landlord ↔ Tenant lean methodology
- Overall (STATE)
- 90 Strongly Landlord-Friendly
- State South Carolina
- 90 Strongly Landlord-Friendly · R+6
- County
- — inherits STATE
- City
- — inherits STATE
ZIP-level market 29620
- Home prices YoY
- 15.0%
- Active inventory
- 110
- Price-to-rent
- 11.6×
Monthly cashflow live
- Estimated rent
- $1,245 medium interval (Pro) →
- Mortgage (P&I)
- −$910
- Tax from tax record
- −$136 /mo · $1,630/yr
- Insurance
- −$72
- HOA
- −$0
- Vacancy / Maint / Mgmt
- −$261
- Net cashflow
- $-134
Break-even live
Sensitivity live
| Price | -10% $-36 | -5% $-85 | +0% $-134 | +5% $-184 | +10% $-233 |
|---|---|---|---|---|---|
| Rent | -10% $-233 | -5% $-184 | +0% $-134 | +5% $-85 | +10% $-36 |
| Rate | -1.0pp $-47 | -0.5pp $-90 | base $-134 | +0.5pp $-179 | +1.0pp $-225 |
UW: 25.0% down · 7.5% · 30yr · 1.5% tax · 5.0% vac · 8.0% maint · 8.0% mgmt
Financing live
Cash to close
- Down payment
- $43,375
- Closing costs
- $5,205
- Reserves months
- —
- Total cash needed
- —
Loan-product check · same deal, 3 products live
Conventional
25% down · 7.5% · 30yr
- Down + closing
- —
- Monthly P&I
- —
- Monthly cashflow
- —
- DSCR
- —
- Eligible?
- —
Personal DTI + credit; lowest rate.
DSCR
20% down · 8.5% · 30yr
- Down + closing
- —
- Monthly P&I
- —
- Monthly cashflow
- —
- DSCR
- —
- Eligible?
- —
No personal income docs; deal must DSCR.
Hard money
10% down · 12.0% · 12mo
- Down + closing
- —
- Monthly P&I
- —
- Monthly cashflow
- —
- DSCR
- —
- Eligible?
- —
Short-term bridge; refi at stabilization.
Rent comps 1 comps
| Address | Beds | Baths | Sqft | Rent | $/sqft | DOM | Units | Dist |
|---|---|---|---|---|---|---|---|---|
| 605 Cherokee St Abbeville, SC | 2.0 | 1.0 | 1100 | $1,245 | $1.13 | 13d | 1 | 1.21mi |
Listing history 10 events
-
2026-06-22days on market $173,500 Active 14 DOM
-
2026-06-18days on market $173,500 Active 11 DOM
-
2026-06-17days on market $173,500 Active 10 DOM
-
2026-06-16days on market $173,500 Active 9 DOM
-
2026-06-15days on market $173,500 Active 8 DOM
-
2026-06-13days on market $173,500 Active 6 DOM
-
2026-06-10days on market $173,500 Active 3 DOM
-
2026-06-09days on market $173,500 Active 2 DOM
-
2026-06-07remarks 516-char remark
-
2026-06-07$173,500 Active 1 DOM
ⓘ Source: listings_history table (triggers on properties + properties_extension) + one-shot
backfill from property_details.listing_events for pre-trigger history.
Tax reassessment forecast SC · Resets to sale price
- Current annual tax
- $1,630 · $136/mo
- Projected year-2 tax
- $1,630 · $136/mo
- Expected delta
- $0/yr ($0/mo · 0.0%)
ⓘ Screening estimate from a state-policy table — verify with the county assessor before closing.
Climate risk First Street
- Flood 1/10 Low FEMA zone X (unshaded) · 0% chance over 30 yrs
- Wildfire 4/10 Moderate
- Heat 6/10 Major 7 d/yr ≥106°F today · 17 d/yr by 30 yrs out
- Wind 6/10 Major 27% chance of damaging wind over 30 yrs
- Air quality 2/10 Low 2 unhealthy d/yr today · 2 by 30 yrs out
Nearby sold comps map
Loading sold comps map…
Walkable amenities ~0.75 mi
Loading nearby amenities…
Taxation est. · year 1
- Rental income
- $14,940
- − Mortgage interest
- −$9,719
- − Property taxes
- −$1,630
- − Insurance
- −$868
- − Repairs & maintenance
- −$1,195
- − Management
- −$1,195
- − Depreciation
- −$5,047
- Taxable loss
- −$4,714
- Est. tax savings @ 24.0%
- +$1,131
- After-tax cash flow
- $-482/yr
For passive investors: Depreciation is non-cash, so a rental often shows a tax loss while cash-flowing — sheltering income. Rental losses are passive: they offset passive income freely, and up to $25,000/yr can offset ordinary (W-2) income if you actively participate and your MAGI is under $100k (phasing out to $0 by $150k); unused losses carry forward. On sale, claimed depreciation is recaptured at up to 25%, and gains may owe capital-gains tax (a 1031 exchange can defer both). Figures are a year-1 estimate at your 24.0% rate — not tax advice; consult a CPA.
Schools (NCES district)
- District
- Abbeville 60
- NCES district ID
- 4500690
- Math proficiency
- 50% ▼ -12.00%
- Reading proficiency
- 49% ▼ -7.00%
- Median HH income
- $34,522
- Composite
- 40.9/100
- National rank
- #3618
- State rank
- #15 of 80 in SC
Livability — Abbeville
- Score
- 66/100
- State rank
- #111
- US rank
- #11534
Category grades
Schools grade is shown separately in the Schools card above.
Census & demographics
- Census place
- Abbeville, SC
- Population (ZIP)
- 12,116
Population outlook (Abbeville County) Hauer SSP2
- Today (2025)
- 24,141 people
- By 2030
- 23,446 · -2.9%
- By 2040
- 21,768 · -9.8%
- By 2050
- 20,098 · -16.7%
- By 2075
- 16,518 · -31.6%
- By 2100
- 13,125 · -45.6%
Race, ethnicity, and origin ACS 2023
- Neighborhood character
- Predominantly White (65%)
- Race & ethnicity
- White 65% Black 30% Two or more races 4% Hispanic / Latino 2%
- Common ancestry
- Italian 2% Serbian 2% Slovak 2%
- Foreign-born
- 2% · Canada, Jamaica
- Languages at home
- 98% English-only · Spanish 2%
Political lean MEDSL · Abbeville
- 2024 margin
- Solid R (+42.4) · D 28.2% · R 70.6% · Other 1.2%
- 2008→2024 swing
- -27.2pp toward R · 2008: -15.2pp · 2024: -42.4pp
- All cycles
- 2024: R+42.4 2020: R+33.1 2016: R+28.3 2012: R+13.4 2008: R+15.2
Not yet ingested
- Civics
- —
Market trends
- HPI YoY
- ▲ 49.52%
- Current HPI
- 379.552
- Rent YoY
- —
- Metro
- —
- State GDP YoY
- ▲ 4.51%
- F500 in state
- 2
Industry mix (Fortune 500 HQ in SC)
| Industry | F500 HQs | Revenue |
|---|---|---|
| Packaging | 1 | $7B |
|
||
Price history
+1635.0% since first listed3 events — show timeline
- 2026-06-07 Listed $173,500 GAOR
- 2024-12-13 Sold (Public Records) $20,000 Public Records
- 2013-12-04 Sold (Public Records) $10,000 Public Records
Property tax history
+17.5%/yrLatest (2025): $1,630 · +301.0% YoY. Source: county tax records.
Cash-flow waterfall
monthlySold comps — $/sqft
last 12 mo · ≤1 miLoading sold comps…