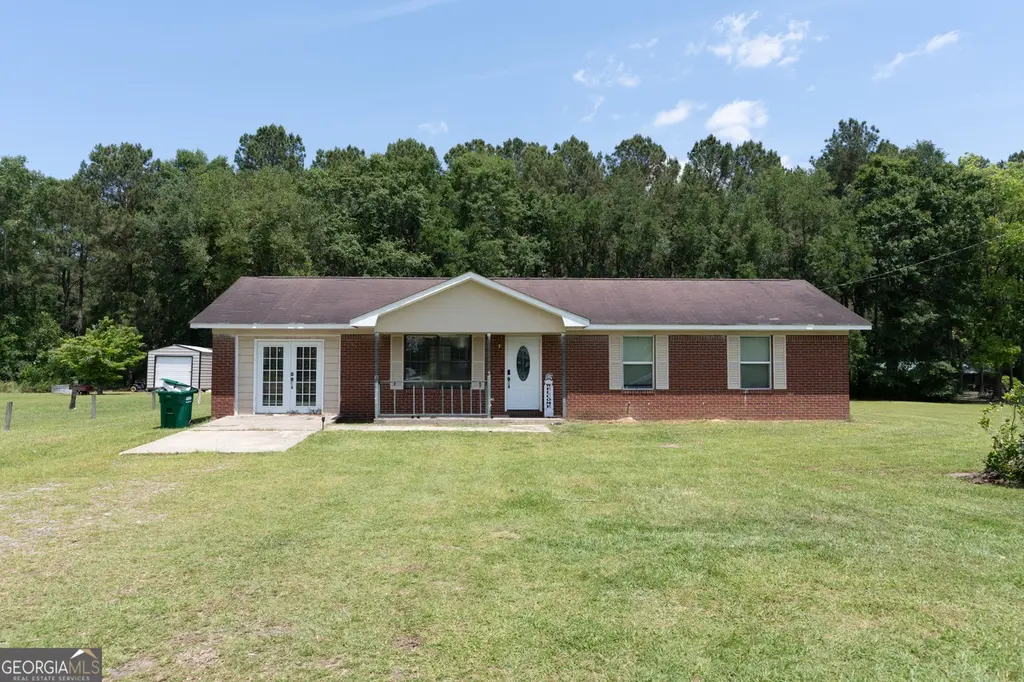
1675 Chain Gang Rd · Sasser, GA
Flood risk 1/10 · Minimal
- FEMA flood zone
- X (unshaded)
- Chance of flooding over 30 yrs
- 0.0%
- Est. flood insurance / yr
- $473 – $860
Fire risk 5/10 · Moderate
- Est. fire insurance / yr
- $963 – $1,789
Heat risk 8/10 · Major
- Hot days now (above 109°F)
- 7 days/yr
- Hot days in 30 yrs
- 19 days/yr
Wind risk 8/10 · Major
- Chance of severe wind over 30 yrs
- 96.0%
Air-quality risk 4/10 · Minor
- Unhealthy air days now
- 6 days/yr
- Unhealthy air days in 30 yrs
- 6 days/yr
Risk factors via First Street. Map © Google.
Why this score? — see what drove the C grade
The composite is a weighted blend of 9 inputs, each scored 0–100. Each bar is that input's sub-score; the figure is the points it added to the 100-point composite (weight × sub-score).
- Cash flow +23.7/30.0
- DSCR +7.6/10.0
- ARV discount +7.5/15.0
- Appreciation +5.8/10.0
- 1% rule +5.5/10.0
- Livability +2.8/5.0
- Rent growth +2.5/5.0
- Condition / age +2.5/5.0
- Schools +0.8/10.0
$129,900
🖨 Deal sheet 📄 Offer letter ✓ Due diligence
Listing remarks
Beautifully updated 3-bedroom, 2-bath ranch-style home situated in a quiet country setting while still being conveniently located just minutes from surrounding cities, shopping, and dining. This move-in ready home features an open layout, updated flooring, spacious living areas, and a kitchen with stainless steel appliances and ample cabinet space. Situated on a large level lot with plenty of outdoor space to enjoy. Move-in ready and full of potential.
Key facts
- 0.74 acre lot
- Built 2000
Property features AI
Finance
- Other: Lot size about 0.74 acre
- HOA & community: No HOA
Exterior
- Parking: Open parking with a parking pad
- Utilities: Well water; Septic tank; Electricity available
- Home design: Single-family residence; House with one story; Resale property
- Construction: Built in 2000; Brick construction; Composition roof
- Exterior features: No notable lot features listed
Interior
- Kitchen: Electric water heater
- Bedrooms: 3 bedrooms on the main level
- Flooring: Laminate flooring
- Bathrooms: 2 full bathrooms on the main level
- Heating & cooling: Central heating; Central air conditioning
- Interior features: Den; Other interior features
- Laundry & utility: Laundry area (other)
Neighborhood map
What this means for you Summary
Snapshot
- This is a 3-bed/2.0-bath single-family listed at $130k.
Deal economics
- At list price, monthly cash flow is $248 ($3k/yr) — positive.
- The deal already cash-flows at list — no discount required.
- Meets the 1% rule at list price ($1k rent vs $130k).
Location & tenants
- Location reads 55/100 on livability (#522 in GA) — a working-class tenant base; expect higher turnover. Strengths: cost of living A+, housing A-; Watch: crime D-, amenities F, commute F.
- Terrell County (rural): math 7% / reading 13% proficiency, ranked #167 of 174 in GA (top 96%) — low school quality limits family demand, transient renter base, plan for 1-2y turnover; 79% free/reduced lunch — lower-income household profile, screen leases tightly.
- Zoned schools: Cooper-Carver Elementary School (math 11% / reading 13%, grade F, #1,041 of 1,228 statewide, top 87%, 482 students, 100% FRL) — zoned schools average 100% FRL vs 79% district-wide (21 pts higher); higher-poverty schools than district average — tighter screening recommended.
- Market conditions: 35 active listings in the ZIP; 2 units permitted in Terrell County in 2024 (0 in 5+ unit buildings).
Forward outlook
- In year one you build about $3k of equity ($898 loan paydown + $2k appreciation (1.6% local appreciation)).
- Terrell County population projected at -33% by 2050 — secular population decline; favor cash flow + early exit over multi-decade hold.
- At projected returns (1.6% appreciation + 3.0% rent growth), your $36k cash investment doubles in ~6 years — after that, you're playing with house money.
Negotiation context
- Only 1 days on market — expect competitive offers; lowballing is unlikely to land.
Risks & watch-outs
- Climate carrying-cost: severe wind risk, 96% chance of damaging wind over 30y; moderate wildfire risk; extreme-heat days projected 7→19/yr by 2055 (HVAC capex compounding) — expect insurance premiums to compound above CPI over the hold.
Questions for the listing agent
- Is there a deadline driving the sale (1031 exchange, divorce, estate, relocation)? That informs how much negotiation room exists.
- Schools are F-rated, which usually means shorter tenancies and higher turnover. Who's the typical renter profile here, and what's been the actual vacancy rate?
- Crime grade is D in this area — have there been break-ins, vandalism, or insurance claims at this property in the last 3 years? What carrier currently insures it and at what premium?
- What's the average days-on-market for RENTAL listings here right now (not sales)? A rising rental-DOM trend means longer vacancies and softer asking-rent achievability than the comps imply.
- What's the recent tenant-quality profile in this submarket — average credit score on applications, eviction rate, late-payment / NSF rate, and stable-employment percentage? A property-management company in the area should have these aggregated.
- How much new for-sale + rental construction is in the pipeline within 1–3 miles? Heavy new supply typically softens prices + rents 12–24 months out; constrained supply supports both.
Investment metrics
- 1% rule
- 1.05% ✓
- Cap rate
- 8.58%
- Cash-on-cash
- 8.18%
- DSCR
- 1.36
- GRM
- 7.9
CMA / ARV
No comps found within radius.
Projected returns pro-forma
1.56% appreciation · 3.0% rent growth · sell at horizon
- IRR
- 11.4%
- Equity multiple
- 1.60×
- Total profit
- $21,823
- Equity at exit
- $48,203
- IRR
- 14.6%
- Equity multiple
- 2.88×
- Total profit
- $68,212
- Equity at exit
- $67,155
Cash invested: $36,372 (down + closing). Projections, not guarantees.
Landlord ↔ Tenant lean methodology
- Overall (STATE)
- 90 Strongly Landlord-Friendly
- State Georgia
- 90 Strongly Landlord-Friendly · R+3
- County
- — inherits STATE
- City
- — inherits STATE
ZIP-level market 39842
- Home prices YoY
- 0.8%
- Active inventory
- 35
- Price-to-rent
- 7.9×
Monthly cashflow live
- Estimated rent
- $1,363 medium interval (Pro) →
- Mortgage (P&I)
- −$681
- Tax from tax record
- −$94 /mo · $1,123/yr
- Insurance
- −$54
- HOA
- −$0
- Vacancy / Maint / Mgmt
- −$286
- Net cashflow
- $248
Break-even live
UW: 25.0% down · 7.5% · 30yr · 1.5% tax · 5.0% vac · 8.0% maint · 8.0% mgmt
Financing live
Cash to close
- Down payment
- $32,475
- Closing costs
- $3,897
- Reserves months
- —
- Total cash needed
- —
Loan-product check · same deal, 3 products live
Conventional
25% down · 7.5% · 30yr
- Down + closing
- —
- Monthly P&I
- —
- Monthly cashflow
- —
- DSCR
- —
- Eligible?
- —
Personal DTI + credit; lowest rate.
DSCR
20% down · 8.5% · 30yr
- Down + closing
- —
- Monthly P&I
- —
- Monthly cashflow
- —
- DSCR
- —
- Eligible?
- —
No personal income docs; deal must DSCR.
Hard money
10% down · 12.0% · 12mo
- Down + closing
- —
- Monthly P&I
- —
- Monthly cashflow
- —
- DSCR
- —
- Eligible?
- —
Short-term bridge; refi at stabilization.
Listing history 2 events
-
2026-05-20status Under Contract
-
2026-05-07$129,900 New
ⓘ Source: listings_history table (triggers on properties + properties_extension) + one-shot
backfill from property_details.listing_events for pre-trigger history.
Tax reassessment forecast GA · Resets to sale price
- Current annual tax
- $1,123 · $94/mo
- Projected year-2 tax
- $1,195 · $100/mo
- Expected delta
- +$72/yr (+$6/mo · 6.4%)
ⓘ Screening estimate from a state-policy table — verify with the county assessor before closing.
Climate risk First Street
- Flood 1/10 Low FEMA zone X (unshaded) · 0% chance over 30 yrs
- Wildfire 5/10 Major
- Heat 8/10 Severe 7 d/yr ≥109°F today · 19 d/yr by 30 yrs out
- Wind 8/10 Severe 96% chance of damaging wind over 30 yrs
- Air quality 4/10 Moderate 6 unhealthy d/yr today · 6 by 30 yrs out
Nearby sold comps map
Loading sold comps map…
Walkable amenities ~0.75 mi
Loading nearby amenities…
Taxation est. · year 1
- Rental income
- $16,356
- − Mortgage interest
- −$7,276
- − Property taxes
- −$1,123
- − Insurance
- −$650
- − Repairs & maintenance
- −$1,309
- − Management
- −$1,309
- − Depreciation
- −$3,779
- Taxable income
- $912
- Est. tax owed @ 24.0%
- −$219
- After-tax cash flow
- $2,756/yr
For passive investors: Depreciation is non-cash, so a rental often shows a tax loss while cash-flowing — sheltering income. Rental losses are passive: they offset passive income freely, and up to $25,000/yr can offset ordinary (W-2) income if you actively participate and your MAGI is under $100k (phasing out to $0 by $150k); unused losses carry forward. On sale, claimed depreciation is recaptured at up to 25%, and gains may owe capital-gains tax (a 1031 exchange can defer both). Figures are a year-1 estimate at your 24.0% rate — not tax advice; consult a CPA.
Schools (NCES district)
- District
- Terrell County
- NCES district ID
- 1304860
- Math proficiency
- 7% ▼ -14.00%
- Reading proficiency
- 13% ▼ -9.00%
- Median HH income
- $31,887
- Composite
- 7.87/100
- National rank
- #9928
- State rank
- #167 of 174 in GA
Livability — Sasser
- Score
- 55/100
- State rank
- #522
- US rank
- #23509
Category grades
Schools grade is shown separately in the Schools card above.
Census & demographics
- City population
- 25
- Population (ZIP)
- 7,780
Population outlook (Terrell County) Hauer SSP2
- Today (2025)
- 8,041 people
- By 2030
- 7,444 · -7.4%
- By 2040
- 6,339 · -21.2%
- By 2050
- 5,415 · -32.7%
- By 2075
- 4,220 · -47.5%
- By 2100
- 3,750 · -53.4%
Race, ethnicity, and origin ACS 2023
- Neighborhood character
- Majority Black (64%)
- Race & ethnicity
- Black 64% White 33% Hispanic / Latino 2%
- Common ancestry
- Serbian 1% Lithuanian 1% Italian 1%
- Foreign-born
- 1% · Canada
- Languages at home
- 97% English-only · Spanish 3%
Political lean MEDSL · Terrell
- 2024 margin
- Toss-up / Even · D 51.9% · R 47.8%
- 2008→2024 swing
- -9.7pp toward R · 2008: 13.8pp · 2024: 4.1pp
- All cycles
- 2024: D+4.1 2020: D+8.4 2016: D+9.4 2012: D+16.1 2008: D+13.8
Not yet ingested
- Civics
- —
Market trends
- HPI YoY
- ▲ 1.56%
- Current HPI
- 190.252
- Rent YoY
- —
- Metro
- —
- State GDP YoY
- ▲ 2.66%
- F500 in state
- 28
Industry mix (Fortune 500 HQ in GA)
| Industry | F500 HQs | Revenue |
|---|---|---|
| Paper / Packaging | 2 | $29B |
|
||
| Retail | 1 | $160B |
|
||
| Transportation / Logistics | 1 | $91B |
|
||
| Airlines | 1 | $62B |
|
||
| Consumer Goods | 1 | $47B |
|
||
| Utilities | 1 | $25B |
|
||
Price history
2 events — show timeline
- 2026-05-20 Pending — GAMLS
- 2026-05-07 Listed $129,900 GAMLS
Property tax history
+1.0%/yrLatest (2025): $1,123 · -0.1% YoY. Source: county tax records.
Cash-flow waterfall
monthlySold comps — $/sqft
last 12 mo · ≤1 miLoading sold comps…