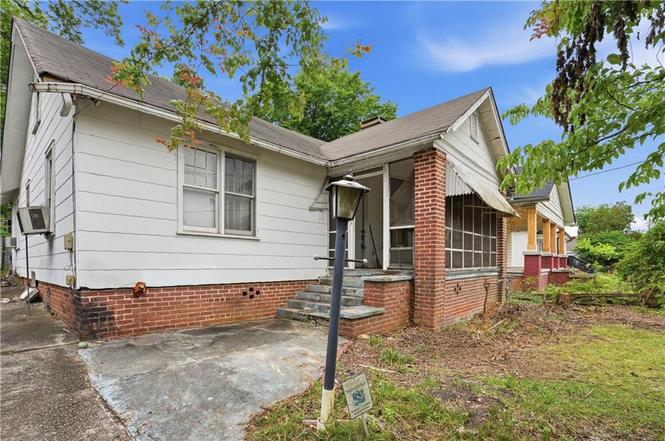
1426 Wadley Ave · East Point, GA
Flood risk 1/10 · Minimal
- FEMA flood zone
- X (unshaded)
- Chance of flooding over 30 yrs
- 0.0%
- Est. flood insurance / yr
- $473 – $860
Fire risk 1/10 · Minimal
- Est. fire insurance / yr
- $963 – $1,789
Heat risk 5/10 · Moderate
- Hot days now (above 103°F)
- 7 days/yr
- Hot days in 30 yrs
- 18 days/yr
Wind risk 5/10 · Moderate
- Chance of severe wind over 30 yrs
- 25.0%
Air-quality risk 4/10 · Minor
- Unhealthy air days now
- 4 days/yr
- Unhealthy air days in 30 yrs
- 6 days/yr
Risk factors via First Street. Map © Google.
Why this score? — see what drove the C+ grade
The composite is a weighted blend of 9 inputs, each scored 0–100. Each bar is that input's sub-score; the figure is the points it added to the 100-point composite (weight × sub-score).
- Cash flow +24.8/30.0
- DSCR +8.0/10.0
- ARV discount +7.5/15.0
- 1% rule +6.4/10.0
- Schools +4.5/10.0
- Livability +3.6/5.0
- Rent growth +2.8/5.0
- Condition / age +2.5/5.0
- Appreciation +0.0/10.0
$150,000
🖨 Deal sheet 📄 Offer letter ✓ Due diligence
Listing remarks
Investor Special in the Heart of Jefferson Park! Ideal for Investors, Builders, or Visionary Homeowners! Discover an exceptional opportunity in one of East Point's most desirable and rapidly revitalizing neighborhoods Jefferson Park. Located at 1426 Wadley Avenue, this Prime Fix & Flip Opportunity is surrounded by beautifully renovated homes and offers tremendous potential for investors or home buyers looking to create their dream home. With solid functional layout, and a spacious lot, this property provides the perfect canvas for a stunning transformation. Whether you're envisioning an open concept layout, modern finishes, or a complete custom renovation, the possibilities are endles
Key facts
- Historic charm
- Spacious lot
- Tree lined streets
Tags
Neighborhood map
What this means for you Summary
Snapshot
- This is a 3-bed/1.0-bath single-family listed at $150k.
Deal economics
- At list price, monthly cash flow is $318 ($4k/yr) — positive.
- The deal already cash-flows at list — no discount required.
- Meets the 1% rule at list price ($2k rent vs $150k).
- Cap rate 8.8% vs local median 5.1% in East Point — top-decile yield for the area; either an underpriced asset or a hidden risk that comps aren't pricing in. Stress-test before assuming the spread holds.
Location & tenants
- Location reads 72/100 on livability (#72 in GA) — a middle-class / working-renter tenant base. Strengths: commute A+, cost of living A+, housing A+; Watch: employment D+, schools F, crime F.
- Fulton County (suburban): math 49% / reading 53% proficiency, ranked #12 of 174 in GA (top 7%) — acceptable for families but not a draw, mixed tenant base, ~2y average lease.
- Market conditions: Rents rising (+1.4%/yr); 283 active listings in the ZIP; 40 comparable units currently listed for rent nearby; rentals at typical pace (median 24d on market — plan ~3-4 weeks tenant-placement turnaround); 42% of comp listings sitting > 30 days — soft ceiling on asking rent; 11,565 units permitted in Fulton County in 2024 (8,159 in 5+ unit buildings).
- This rent runs 30% of the median local income ($68k/yr) — at the standard rent-burdened threshold; future hikes will face affordability resistance.
Forward outlook
- Local home prices are declining (-3.0%/yr); year-one equity from $1k of loan paydown is wiped out by about $4k of value loss. Plan a longer hold.
- Fulton County population projected at +38% by 2050 — long-run rental-demand tailwind backs the buy-and-hold thesis.
Negotiation context
- Only 1 days on market — expect competitive offers; lowballing is unlikely to land.
- 2 sale attempts with the ask held roughly flat each time — persistent listings suggest the price (not the market) is what's stuck; bring a comps-based counter.
Risks & watch-outs
- Watch-outs: built in 1930 — expect roof / HVAC / electrical / plumbing capex.
- Climate carrying-cost: moderate wind risk, 25% chance of damaging wind over 30y; extreme-heat days projected 7→18/yr by 2055 (HVAC capex compounding) — expect insurance premiums to compound above CPI over the hold.
Questions for the listing agent
- Built in 1930 — when were the roof, HVAC, electrical panel, plumbing, and water heater last replaced?
- Is there a deadline driving the sale (1031 exchange, divorce, estate, relocation)? That informs how much negotiation room exists.
- Schools are F-rated, which usually means shorter tenancies and higher turnover. Who's the typical renter profile here, and what's been the actual vacancy rate?
- Crime grade is F in this area — have there been break-ins, vandalism, or insurance claims at this property in the last 3 years? What carrier currently insures it and at what premium?
- What's the average days-on-market for RENTAL listings here right now (not sales)? A rising rental-DOM trend means longer vacancies and softer asking-rent achievability than the comps imply.
- What's the recent tenant-quality profile in this submarket — average credit score on applications, eviction rate, late-payment / NSF rate, and stable-employment percentage? A property-management company in the area should have these aggregated.
- How much new for-sale + rental construction is in the pipeline within 1–3 miles? Heavy new supply typically softens prices + rents 12–24 months out; constrained supply supports both.
Investment metrics
- 1% rule
- 1.14% ✓
- Cap rate
- 8.83%
- Cash-on-cash
- 9.07%
- DSCR
- 1.40
- GRM
- 7.3
CMA / ARV
- ARV (median comp)
- $324,902
- List price
- $150,000
- Delta
- -53.83%
- Verdict
- UNDERPRICED
- Comps
- 20 within 1.0 mi
Show comp detail 12 sales within ~0.75 mi
| Address | Dist | Beds/Ba | Sqft | Sold | Price | $/sf | Match |
|---|---|---|---|---|---|---|---|
| 1372 Wadley Ave | 0.11mi | 2/2.0 (-1) | 1,346 (-1%) | 10mo | $320,750 | $238 | 76 |
| 2431 W Woodland Cir | 0.32mi | 2/2.0 (-1) | 1,400 (+3%) | 10mo | $219,900 | $157 | 63 |
| 2180 Newnan St | 0.54mi | 3/1.0 | 1,457 (+7%) | 1mo | $129,900 | $89 | 62 |
| 2269 Dauphine St | 0.37mi | 3/1.0 | 1,193 (-12%) | 4mo | $260,000 | $218 | 59 |
| 1780 W Forrest Ave | 0.68mi | 2/1.0 (-1) | 1,396 (+3%) | 3mo | $215,000 | $154 | 56 |
| 1325 East Forrest Ave | 0.42mi | 3/1.5 | 1,269 (-7%) | 13mo | $260,500 | $205 | 56 |
| 1413 Clermont Ave | 0.60mi | 3/1.5 | 1,238 (-9%) | 1mo | $230,000 | $186 | 54 |
| 2669 Jefferson Terrace Ter | 0.60mi | 2/1.0 (-1) | 1,456 (+7%) | 12mo | $275,000 | $189 | 46 |
| 2665 Jefferson Ter | 0.59mi | 2/2.0 (-1) | 1,280 (-6%) | 13mo | $325,000 | $254 | 43 |
| 1222 E Forrest Ave | 0.57mi | 2/2.0 (-1) | 1,160 (-15%) | 3mo | $225,000 | $194 | 38 |
| 2499 Jewel St | 0.58mi | 2/1.0 (-1) | 1,236 (-9%) | 21mo | $167,250 | $135 | 35 |
| 1378 Hawthorne Way | 0.61mi | 2/1.0 (-1) | 1,172 (-14%) | 15mo | $99,500 | $85 | 31 |
Match score weights: distance 35% · size 25% · config 20% · recency 20%. Top-matched comps best support the ARV.
Projected returns pro-forma
-3.0% appreciation · 1.35% rent growth · sell at horizon
- IRR
- -4.4%
- Equity multiple
- 0.84×
- Total profit
- $-6,858
- Equity at exit
- $22,365
- IRR
- 3.2%
- Equity multiple
- 1.22×
- Total profit
- $9,059
- Equity at exit
- $12,969
Cash invested: $42,000 (down + closing). Projections, not guarantees.
Landlord ↔ Tenant lean methodology
- Overall (STATE)
- 90 Strongly Landlord-Friendly
- State Georgia
- 90 Strongly Landlord-Friendly · R+3
- County
- — inherits STATE
- City
- — inherits STATE
ZIP-level market 30344
- Home prices YoY
- -31.0%
- Rents YoY
- 1.4%
- Active inventory
- 283
- Price-to-rent
- 7.3×
Monthly cashflow live
- Estimated rent
- $1,714 high interval (Pro) →
- Mortgage (P&I)
- −$787
- Tax est. 1.5%
- −$188 /mo · $2,250/yr
- Insurance
- −$62
- HOA
- −$0
- Vacancy / Maint / Mgmt
- −$360
- Net cashflow
- $318
Break-even live
UW: 25.0% down · 7.5% · 30yr · 1.5% tax · 5.0% vac · 8.0% maint · 8.0% mgmt
Financing live
Cash to close
- Down payment
- $37,500
- Closing costs
- $4,500
- Reserves months
- —
- Total cash needed
- —
Loan-product check · same deal, 3 products live
Conventional
25% down · 7.5% · 30yr
- Down + closing
- —
- Monthly P&I
- —
- Monthly cashflow
- —
- DSCR
- —
- Eligible?
- —
Personal DTI + credit; lowest rate.
DSCR
20% down · 8.5% · 30yr
- Down + closing
- —
- Monthly P&I
- —
- Monthly cashflow
- —
- DSCR
- —
- Eligible?
- —
No personal income docs; deal must DSCR.
Hard money
10% down · 12.0% · 12mo
- Down + closing
- —
- Monthly P&I
- —
- Monthly cashflow
- —
- DSCR
- —
- Eligible?
- —
Short-term bridge; refi at stabilization.
Rent comps 40 comps
| Address | Beds | Baths | Sqft | Rent | $/sqft | DOM | Units | Dist |
|---|---|---|---|---|---|---|---|---|
| 1455 Bryan Ave Unit B Atlanta, GA | 2.0 | 1.0 | 1482 | $1,300 | $0.88 | 24d | 1 | 0.05mi |
| 1366 Bryan Ave Unit A Atlanta, GA | 2.0 | 1.5 | 1181 | $1,600 | $1.35 | 43d | 1 | 0.18mi |
| 2340 Newnan St Atlanta, GA | 4.0 | 2.0 | 1598 | $775 | $0.48 | 43d | 1 | 0.21mi |
| 1354 Winburn Dr Atlanta, GA | 3.0 | 1.0 | 1000 | $1,850 | $1.85 | 5d | 1 | 0.34mi |
| 1354 Winburn Dr Atlanta, GA | 2.0 | 1.0 | 1089 | $1,750 | $1.61 | 24d | 1 | 0.34mi |
| 1344 Winburn Dr Atlanta, GA | 3.0 | 2.0 | 1388 | $2,100 | $1.51 | 24d | 1 | 0.35mi |
| 2627 N Church St East Point, GA | 2.0–3.0 | 1.0–2.0 | 1020 | $1,375 | $1.35 | 22d | 2 | 0.41mi |
| 1352 Elizabeth Ln Atlanta, GA | 3.0 | 2.0 | 1654 | $1,745 | $1.06 | 10d | 1 | 0.47mi |
| 1305 Clermont Ave Atlanta, GA | 2.0 | 2.0 | 1000 | $1,750 | $1.75 | 24d | 1 | 0.55mi |
| 1656 Ware Ave Atlanta, GA | 3.0 | 2.0 | 1866 | $2,150 | $1.15 | 43d | 1 | 0.57mi |
| 1493 Ashley Way Atlanta, GA | 3.0 | 2.5 | 1646 | $1,900 | $1.15 | 43d | 1 | 0.58mi |
| 2710 Winburn Ter Atlanta, GA | 3.0 | 2.0 | 1500 | $1,800 | $1.20 | 43d | 1 | 0.59mi |
| 1742 Ware Ave Atlanta, GA | 2.0 | 1.0 | 916 | $1,300 | $1.42 | 24d | 1 | 0.64mi |
| 1377 Pine Ave Atlanta, GA | 3.0 | 2.0 | 1100 | $1,675 | $1.52 | 22d | 1 | 0.65mi |
| 2481 Semmes St Atlanta, GA | 3.0 | 1.0 | 1500 | $1,850 | $1.23 | 43d | 1 | 0.67mi |
| 1361 McClelland Ave Atlanta, GA | 3.0 | 1.0 | 1468 | $1,500 | $1.02 | 24d | 1 | 0.76mi |
| 2663 Blount St Atlanta, GA | 3.0 | 2.0 | 1168 | $1,650 | $1.41 | 16d | 1 | 0.80mi |
| 2626 Blount St Atlanta, GA | 2.0 | 1.0 | 1314 | $1,460 | $1.11 | 24d | 1 | 0.82mi |
| 2036 McPherson Dr Atlanta, GA | 2.0 | 1.0 | 1743 | $1,590 | $0.91 | 5d | 1 | 0.83mi |
| 2894 Randall St Atlanta, GA | 4.0 | 2.0 | 1225 | $1,850 | $1.51 | 43d | 1 | 0.83mi |
| 1347 Washington Rd Unit A East Point, GA | 2.0 | 1.0 | 1250 | $1,049 | $0.84 | 43d | 1 | 0.84mi |
| 1329 Washington Rd Atlanta, GA | 4.0 | 2.0 | 1600 | $2,250 | $1.41 | 43d | 1 | 0.85mi |
| 2636 Acadia St Atlanta, GA | 3.0 | 2.0 | 1300 | $1,800 | $1.38 | 24d | 1 | 0.86mi |
| 1903 Chattahoochee Pl Atlanta, GA | 3.0 | 2.0 | 1333 | $1,850 | $1.39 | 12d | 1 | 0.87mi |
| 2450 Hillcrest Dr Atlanta, GA | 2.0 | 1.5 | 918 | $2,400 | $2.61 | 16d | 1 | 0.89mi |
| 1902 Connally Dr Atlanta, GA | 2.0 | 1.5 | 993 | $2,450 | $2.47 | 43d | 1 | 0.90mi |
| 2748 Blount St Atlanta, GA | 3.0 | 1.0 | 1068 | $1,850 | $1.73 | 43d | 1 | 0.91mi |
| 2730 Pearl St Unit 1 East Point, GA | 2.0 | 1.0 | 910 | $1,175 | $1.29 | 43d | 1 | 0.93mi |
| 1917 Connally Dr Atlanta, GA | 3.0 | 2.0 | 1534 | $1,850 | $1.21 | 12d | 1 | 0.95mi |
| 2874 Cheney St Atlanta, GA | 2.0 | 1.0 | 900 | $1,300 | $1.44 | 43d | 1 | 0.96mi |
| 1100 Washington Cir Atlanta, GA | 1.0–4.0 | 1.0–1.5 | 1000 | $1,617 | $1.62 | 2d | 1 | 0.97mi |
| 1914 Montrose Dr Atlanta, GA | 2.0 | 1.0 | 1216 | $2,000 | $1.64 | 43d | 1 | 0.99mi |
| 2533 Sylvan Rd Atlanta, GA | 3.0 | 2.0 | 1692 | $1,995 | $1.18 | 24d | 1 | 1.00mi |
| 1932 Montrose Dr Atlanta, GA | 3.0 | 1.0 | 1200 | $1,750 | $1.46 | 18d | 1 | 1.02mi |
| 1244 Calhoun Ave Atlanta, GA | 3.0 | 1.5 | 1072 | $1,673 | $1.56 | 43d | 1 | 1.09mi |
| 2456 Harwood Dr Atlanta, GA | 2.0 | 2.0 | 1176 | $1,995 | $1.70 | 43d | 1 | 1.10mi |
| 2874 Blount St Atlanta, GA | 3.0 | 1.0 | 1190 | $1,750 | $1.47 | 5d | 1 | 1.11mi |
| 1060 Regent St SW Atlanta, GA | 3.0 | 2.0 | 1390 | $2,500 | $1.80 | 24d | 1 | 1.12mi |
| 2801 Palm Dr Atlanta, GA | 3.0 | 1.0 | 1064 | $1,550 | $1.46 | 12d | 1 | 1.13mi |
| 1932 Stanton Rd East Point, GA | 1.0–3.0 | 1.0–2.0 | 1045 | $1,599 | $1.53 | 43d | 1 | 1.17mi |
Listing history 6 events
-
2026-06-17remarks 695-char remark
-
2026-06-17statusdays on market $150,000 Active 1 DOM
-
2026-05-08historical
-
2026-05-08historical
-
2026-04-30$150,000 Active
-
2026-04-30$150,000 New
ⓘ Source: listings_history table (triggers on properties + properties_extension) + one-shot
backfill from property_details.listing_events for pre-trigger history.
Climate risk First Street
- Flood 1/10 Low FEMA zone X (unshaded) · 0% chance over 30 yrs
- Wildfire 1/10 Low
- Heat 5/10 Major 7 d/yr ≥103°F today · 18 d/yr by 30 yrs out
- Wind 5/10 Major 25% chance of damaging wind over 30 yrs
- Air quality 4/10 Moderate 4 unhealthy d/yr today · 6 by 30 yrs out
Nearby sold comps map
Loading sold comps map…
Walkable amenities ~0.75 mi
Loading nearby amenities…
Taxation est. · year 1
- Rental income
- $20,569
- − Mortgage interest
- −$8,402
- − Property taxes
- −$2,250
- − Insurance
- −$750
- − Repairs & maintenance
- −$1,646
- − Management
- −$1,646
- − Depreciation
- −$4,364
- Taxable income
- $1,512
- Est. tax owed @ 24.0%
- −$363
- After-tax cash flow
- $3,447/yr
For passive investors: Depreciation is non-cash, so a rental often shows a tax loss while cash-flowing — sheltering income. Rental losses are passive: they offset passive income freely, and up to $25,000/yr can offset ordinary (W-2) income if you actively participate and your MAGI is under $100k (phasing out to $0 by $150k); unused losses carry forward. On sale, claimed depreciation is recaptured at up to 25%, and gains may owe capital-gains tax (a 1031 exchange can defer both). Figures are a year-1 estimate at your 24.0% rate — not tax advice; consult a CPA.
Schools (NCES district)
- District
- Fulton County
- NCES district ID
- 1302280
- Math proficiency
- 49% ▼ -2.00%
- Reading proficiency
- 53% ▬ 0.00%
- Median HH income
- $68,035
- Composite
- 45.33/100
- National rank
- #2640
- State rank
- #12 of 174 in GA
Livability — East Point
- Score
- 72/100
- State rank
- #72
- US rank
- #6314
Category grades
Schools grade is shown separately in the Schools card above.
Census & demographics
- Census place
- East Point, GA
- County
- Fulton County · 1,094,430 people
- City population
- 35,456
- Metro
- Atlanta-Sandy Springs-Alpharetta, GA
- Population (ZIP)
- 35,456
- Household income
- $68,380
- Rent vs Own
- Severe rent burden
- 2226.0
Population outlook (Fulton County) Hauer SSP2
- Today (2025)
- 1,203,707 people
- By 2030
- 1,299,706 · +8.0%
- By 2040
- 1,488,256 · +23.6%
- By 2050
- 1,664,580 · +38.3%
- By 2075
- 2,036,072 · +69.2%
- By 2100
- 2,222,402 · +84.6%
Race, ethnicity, and origin ACS 2023
- Neighborhood character
- Predominantly Black (74%)
- Race & ethnicity
- Black 74% White 11% Hispanic / Latino 11% Two or more races 6%
- Hispanic origin (detail)
- Mexican 7% Puerto Rican 1%
- Common ancestry
- Italian 1% Swiss 1% Russian 1%
- Foreign-born
- 6% · Canada, Jamaica
- Languages at home
- 87% English-only · Spanish 9% Other Indo-European 1% German/W. Germanic 1%
Political lean MEDSL · Fulton
- 2024 margin
- Solid D (+44.9) · D 71.9% · R 27.0% · Other 1.1%
- 2008→2024 swing
- +9.8pp toward D · 2008: 35.0pp · 2024: 44.9pp
- All cycles
- 2024: D+44.9 2020: D+46.4 2016: D+42.1 2012: D+29.6 2008: D+35.0
Not yet ingested
- Civics
- —
Market trends
- HPI YoY
- ▼ -113.15%
- Current HPI
- 251.7916
- Rent YoY
- ▲ 1.35%
- Metro
- Atlanta-Sandy Springs-Alpharetta, GA
- State GDP YoY
- ▲ 2.66%
- F500 in state
- 28
Industry mix (Fortune 500 HQ in GA)
| Industry | F500 HQs | Revenue |
|---|---|---|
| Paper / Packaging | 2 | $29B |
|
||
| Retail | 1 | $160B |
|
||
| Transportation / Logistics | 1 | $91B |
|
||
| Airlines | 1 | $62B |
|
||
| Consumer Goods | 1 | $47B |
|
||
| Utilities | 1 | $25B |
|
||
Price history
+0.0% since first listed4 events — show timeline
- 2026-05-08 Listing Removed — GAMLS
- 2026-05-08 Listing Removed — FMLS
- 2026-04-30 Listed $150,000 GAMLS
- 2026-04-30 Listed $150,000 FMLS
Property tax history
+148.9%/yrLatest (2021): $110 · +0.0% YoY. Source: county tax records.
Cash-flow waterfall
monthlySold comps — $/sqft
last 12 mo · ≤1 miLoading sold comps…