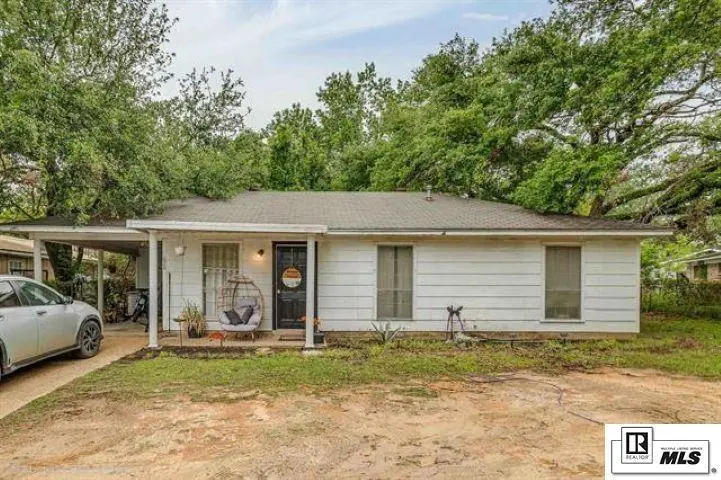
626 Wallace Dean Rd · Claiborne, LA
Flood risk 1/10 · Minimal
- FEMA flood zone
- X (unshaded)
- Chance of flooding over 30 yrs
- 0.0%
- Est. flood insurance / yr
- $507 – $1,088
Fire risk 1/10 · Minimal
- Est. fire insurance / yr
- $1,269 – $2,357
Heat risk 7/10 · Major
- Hot days now (above 111°F)
- 7 days/yr
- Hot days in 30 yrs
- 19 days/yr
Wind risk 7/10 · Major
- Chance of severe wind over 30 yrs
- 78.0%
Air-quality risk 1/10 · Minimal
- Unhealthy air days now
- 0 days/yr
- Unhealthy air days in 30 yrs
- 0 days/yr
Risk factors via First Street. Map © Google.
Why this score? — see what drove the B+ grade
The composite is a weighted blend of 9 inputs, each scored 0–100. Each bar is that input's sub-score; the figure is the points it added to the 100-point composite (weight × sub-score).
- Cash flow +30.0/30.0
- ARV discount +15.0/15.0
- 1% rule +10.0/10.0
- DSCR +10.0/10.0
- Rent growth +4.7/5.0
- Livability +3.4/5.0
- Schools +3.2/10.0
- Condition / age +2.5/5.0
- Appreciation +0.0/10.0
$95,000
🖨 Deal sheet 📄 Offer letter ✓ Due diligence
Listing remarks
Welcome to this charming 3-bedroom, 1.5-bath home in the heart of West Park subdivision. An open floor plan creates an easy flow from the living area to the dining space, highlighted by warm wood accents and a unique kitchen bar feature that adds character and functionality. The water heater was replaced in 2019, offering added peace of mind. Each bedroom is spacious, and the home includes a dedicated utility room for convenience. Step outside to a covered patio, a fenced yard, and additional storage perfect for hobbies or holiday décor. Located close to shopping and restaurants, this home offers comfort and convenience. Would be a great starter home, investment project and more! Cal
Key facts
- Open floor plan
- Unique kitchen bar
- Fenced yard
Tags
Property features AI
Finance
- HOA & community: No association amenities
Exterior
- Parking: Garage with 1 parking space
- Security: Smoke detector(s)
- Utilities: Public water; Public sewer
- Home design: Single-family residence; Site-built home; One story (entry level 1)
- Construction: Built with other construction materials; Fiberglass roof; Slab foundation
- Exterior features: Covered patio/porch; Chain link fencing; Landscaped yard; Cleared lot; Storage structure on property; Smoke detectors
Interior
- Kitchen: Dishwasher; Refrigerator
- Bedrooms: 3 bedrooms on the main level
- Bathrooms: 1 full bathroom; 1 half bathroom
- Heating & cooling: Central heating (natural gas); Central air conditioning; Ceiling fans; Electric cooling components
- Interior features: Ceiling fans; Walk-in closets; Blinds
- Laundry & utility: Gas water heater
Neighborhood map
What this means for you Summary
Snapshot
- This is a 3-bed/2.0-bath single-family listed at $95k.
Deal economics
- At list price, monthly cash flow is $562 ($7k/yr) — positive.
- The deal already cash-flows at list — no discount required.
- Meets the 1% rule at list price ($2k rent vs $95k).
- Cap rate 13.4% vs local median 4.0% in Claiborne — top-decile yield for the area; either an underpriced asset or a hidden risk that comps aren't pricing in. Stress-test before assuming the spread holds.
Location & tenants
- Location reads 67/100 on livability (#109 in LA) — a middle-class / working-renter tenant base. Strengths: cost of living A+, housing A+, employment A-; Watch: crime D+, health & safety D, amenities F.
- Ouachita Parish (suburban): math 31% / reading 45% proficiency, ranked #26 of 98 in LA (top 26%) — families likely to look elsewhere, expect single-tenant / working-renter base with shorter leases.
- Zoned schools: Claiborne School (math 62% / reading 73%, grade B+, #34 of 646 statewide, top 5%, 751 students, 46% FRL); West Ridge Middle School (math 52% / reading 65%, grade B, #13 of 218 statewide, top 6%, 635 students, 47% FRL); West Monroe High School (math 32% / reading 48%, grade F, #77 of 265 statewide, top 29%, 2,189 students, 58% FRL) — zoned schools at 50% FRL track the district average.
- Zoned-school proficiency averages 55% at this address vs 38% district-wide (+17 pts) — the actual schools serving this property are materially stronger than the Ouachita Parish average implies; a family-tenant draw the district grade alone would hide.
- Market conditions: Rents rising fast (+8.9%/yr); 199 active listings in the ZIP; 6 comparable units currently listed for rent nearby; rentals lingering (median 44d on market — plan ~5-8 weeks vacancy on turnover, expect pricing pressure); 67% of comp listings sitting > 30 days — soft ceiling on asking rent; 345 units permitted in Ouachita Parish in 2024 (0 in 5+ unit buildings).
Forward outlook
- Local home prices are declining (-3.0%/yr); year-one equity from $657 of loan paydown is wiped out by about $3k of value loss. Plan a longer hold.
- At projected returns (-3.0% appreciation + 8.0% rent growth), your $27k cash investment doubles in ~5 years — after that, you're playing with house money.
Negotiation context
- Only 1 days on market — expect competitive offers; lowballing is unlikely to land.
Risks & watch-outs
- Watch-outs: built in 1959 — expect roof / HVAC / electrical / plumbing capex.
- Climate carrying-cost: major wind risk, 78% chance of damaging wind over 30y; extreme-heat days projected 7→19/yr by 2055 (HVAC capex compounding) — expect insurance premiums to compound above CPI over the hold.
Questions for the listing agent
- Built in 1959 — when were the roof, HVAC, electrical panel, plumbing, and water heater last replaced?
- Is there a deadline driving the sale (1031 exchange, divorce, estate, relocation)? That informs how much negotiation room exists.
- Schools are D-rated, which usually means shorter tenancies and higher turnover. Who's the typical renter profile here, and what's been the actual vacancy rate?
- Crime grade is D in this area — have there been break-ins, vandalism, or insurance claims at this property in the last 3 years? What carrier currently insures it and at what premium?
- What's the average days-on-market for RENTAL listings here right now (not sales)? A rising rental-DOM trend means longer vacancies and softer asking-rent achievability than the comps imply.
- What's the recent tenant-quality profile in this submarket — average credit score on applications, eviction rate, late-payment / NSF rate, and stable-employment percentage? A property-management company in the area should have these aggregated.
- How much new for-sale + rental construction is in the pipeline within 1–3 miles? Heavy new supply typically softens prices + rents 12–24 months out; constrained supply supports both.
Investment metrics
- 1% rule
- 1.58% ✓
- Cap rate
- 13.39%
- Cash-on-cash
- 25.33%
- DSCR
- 2.13
- GRM
- 5.3
CMA / ARV
- ARV (on-the-fly)
- $131,584
- Comps found
- 12
Show comp detail 12 sales within ~0.75 mi
| Address | Dist | Beds/Ba | Sqft | Sold | Price | $/sf | Match |
|---|---|---|---|---|---|---|---|
| 207 Westside Dr | 0.12mi | 3/— | 1,057 (+3%) | 2mo | $148,000 | $140 | 88 |
| 100 Westside Dr | 0.11mi | 3/1.5 | 1,083 (+5%) | 16mo | $169,000 | $156 | 71 |
| 203 Butler Ave | 0.44mi | 3/1.0 | 995 (-3%) | 1mo | $127,000 | $128 | 70 |
| 118 Wellington Pl | 0.63mi | 2/1.5 (-1) | 1,056 (+3%) | 2mo | $142,500 | $135 | 58 |
| 101 Dixie St | 0.14mi | 3/1.0 | 1,177 (+14%) | 11mo | $135,000 | $115 | 56 |
| 115 Wellington Pl | 0.61mi | 2/1.5 (-1) | 1,111 (+8%) | 5mo | $125,000 | $113 | 47 |
| 124 Davis Ln | 0.66mi | 3/1.0 | 1,054 (+2%) | 18mo | $145,000 | $138 | 46 |
| 128 Davis Ln | 0.68mi | 3/1.5 | 1,162 (+13%) | 1mo | $143,500 | $123 | 44 |
| 106 Wellington Pl | 0.61mi | 2/1.5 (-1) | 1,146 (+12%) | 8mo | $131,790 | $115 | 38 |
| 304 Susan Dr | 0.62mi | 3/1.5 | 1,178 (+15%) | 18mo | $172,000 | $146 | 30 |
| 120 Wellington Pl | 0.63mi | 2/1.5 (-1) | 1,156 (+12%) | 18mo | $125,000 | $108 | 28 |
| 122 Wellington Pl | 0.64mi | 2/1.5 (-1) | 1,154 (+12%) | 20mo | $112,500 | $97 | 26 |
Match score weights: distance 35% · size 25% · config 20% · recency 20%. Top-matched comps best support the ARV.
Projected returns pro-forma
-3.0% appreciation · 8.0% rent growth · sell at horizon
- IRR
- 24.3%
- Equity multiple
- 2.06×
- Total profit
- $28,306
- Equity at exit
- $14,165
- IRR
- 35.1%
- Equity multiple
- 5.02×
- Total profit
- $106,810
- Equity at exit
- $8,214
Cash invested: $26,600 (down + closing). Projections, not guarantees.
Landlord ↔ Tenant lean methodology
- Overall (STATE)
- 90 Strongly Landlord-Friendly
- State Louisiana
- 90 Strongly Landlord-Friendly · R+12
- County
- — inherits STATE
- City
- — inherits STATE
ZIP-level market 71291
- Home prices YoY
- -30.2%
- Rents YoY
- 8.9%
- Active inventory
- 199
- Price-to-rent
- 5.3×
Monthly cashflow live
- Estimated rent
- $1,501 high interval (Pro) →
- Mortgage (P&I)
- −$498
- Tax from tax record
- −$86 /mo · $1,034/yr
- Insurance
- −$40
- HOA
- −$0
- Vacancy / Maint / Mgmt
- −$315
- Net cashflow
- $562
Break-even live
UW: 25.0% down · 7.5% · 30yr · 1.5% tax · 5.0% vac · 8.0% maint · 8.0% mgmt
Financing live
Cash to close
- Down payment
- $23,750
- Closing costs
- $2,850
- Reserves months
- —
- Total cash needed
- —
Loan-product check · same deal, 3 products live
Conventional
25% down · 7.5% · 30yr
- Down + closing
- —
- Monthly P&I
- —
- Monthly cashflow
- —
- DSCR
- —
- Eligible?
- —
Personal DTI + credit; lowest rate.
DSCR
20% down · 8.5% · 30yr
- Down + closing
- —
- Monthly P&I
- —
- Monthly cashflow
- —
- DSCR
- —
- Eligible?
- —
No personal income docs; deal must DSCR.
Hard money
10% down · 12.0% · 12mo
- Down + closing
- —
- Monthly P&I
- —
- Monthly cashflow
- —
- DSCR
- —
- Eligible?
- —
Short-term bridge; refi at stabilization.
Rent comps 6 comps
| Address | Beds | Baths | Sqft | Rent | $/sqft | DOM | Units | Dist |
|---|---|---|---|---|---|---|---|---|
| 714 Wallace Dean Rd West Monroe, LA | 3.0 | 1.5 | 1321 | $1,325 | $1.00 | 44d | 1 | 0.09mi |
| 298 Defreese Rd West Monroe, LA | 3.0 | 1.0 | 1100 | $1,500 | $1.36 | 43d | 1 | 0.16mi |
| 816 Wallace Dean Rd West Monroe, LA | 3.0 | 1.5 | 1045 | $1,550 | $1.48 | 43d | 1 | 0.35mi |
| 114 Westchase Dr West Monroe, LA | 2.0 | 1.5 | 1266 | $1,550 | $1.22 | 21d | 1 | 0.62mi |
| 2555 Arkansas Rd Unit 16 West Monroe, LA | 3.0 | 1.5 | 1180 | $1,750 | $1.48 | 43d | 1 | 0.71mi |
| 112 Fairlane Dr Unit 8 West Monroe, LA | 2.0 | 2.0 | 1050 | $1,600 | $1.52 | 21d | 1 | 1.44mi |
Listing history 3 events
-
2026-05-02status Pending
-
2026-05-01$95,000 Active
-
2012-04-30soldstatus $99,900
ⓘ Source: listings_history table (triggers on properties + properties_extension) + one-shot
backfill from property_details.listing_events for pre-trigger history.
Tax reassessment forecast LA · Resets to sale price
- Current annual tax
- $1,034 · $86/mo
- Projected year-2 tax
- $1,034 · $86/mo
- Expected delta
- $0/yr ($0/mo · 0.0%)
ⓘ Screening estimate from a state-policy table — verify with the county assessor before closing.
Climate risk First Street
- Flood 1/10 Low FEMA zone X (unshaded) · 0% chance over 30 yrs
- Wildfire 1/10 Low
- Heat 7/10 Severe 7 d/yr ≥111°F today · 19 d/yr by 30 yrs out
- Wind 7/10 Severe 78% chance of damaging wind over 30 yrs
- Air quality 1/10 Low 0 unhealthy d/yr today · 0 by 30 yrs out
Nearby sold comps map
Loading sold comps map…
Walkable amenities ~0.75 mi
Loading nearby amenities…
Taxation est. · year 1
- Rental income
- $18,008
- − Mortgage interest
- −$5,321
- − Property taxes
- −$1,034
- − Insurance
- −$475
- − Repairs & maintenance
- −$1,441
- − Management
- −$1,441
- − Depreciation
- −$2,764
- Taxable income
- $5,532
- Est. tax owed @ 24.0%
- −$1,328
- After-tax cash flow
- $5,411/yr
For passive investors: Depreciation is non-cash, so a rental often shows a tax loss while cash-flowing — sheltering income. Rental losses are passive: they offset passive income freely, and up to $25,000/yr can offset ordinary (W-2) income if you actively participate and your MAGI is under $100k (phasing out to $0 by $150k); unused losses carry forward. On sale, claimed depreciation is recaptured at up to 25%, and gains may owe capital-gains tax (a 1031 exchange can defer both). Figures are a year-1 estimate at your 24.0% rate — not tax advice; consult a CPA.
Schools (NCES district)
- District
- Ouachita Parish
- NCES district ID
- 2201200
- Math proficiency
- 31% ▼ -38.00%
- Reading proficiency
- 45% ▼ -31.00%
- Median HH income
- $43,316
- Composite
- 32.14/100
- National rank
- #5791
- State rank
- #26 of 98 in LA
Livability — Claiborne
- Score
- 67/100
- State rank
- #109
- US rank
- #10626
Category grades
Schools grade is shown separately in the Schools card above.
Census & demographics
- Census place
- Claiborne, LA
- County
- Ouachita Parish · 118,340 people
- Metro
- Monroe, LA
- Population (ZIP)
- 35,269
- Household income
- $71,639
- Rent vs Own
- Severe rent burden
- 847.0
Population outlook (Ouachita County) Hauer SSP2
- Today (2025)
- 163,370 people
- By 2030
- 165,520 · +1.3%
- By 2040
- 167,652 · +2.6%
- By 2050
- 166,699 · +2.0%
- By 2075
- 156,348 · -4.3%
- By 2100
- 134,102 · -17.9%
Race, ethnicity, and origin ACS 2023
- Neighborhood character
- Predominantly White (78%)
- Race & ethnicity
- White 78% Black 13% Hispanic / Latino 6% Two or more races 3% Asian 1%
- Hispanic origin (detail)
- Mexican 3%
- Common ancestry
- Lithuanian 3% Italian 2% Slovak 1%
- Foreign-born
- 4% · Canada
- Languages at home
- 94% English-only · Spanish 4% Other Indo-European 1%
Political lean MEDSL · Ouachita
- 2024 margin
- Strong R (+27.9) · D 35.5% · R 63.3% · Other 1.2%
- 2008→2024 swing
- -2.7pp toward R · 2008: -25.2pp · 2024: -27.9pp
- All cycles
- 2024: R+27.9 2020: R+23.6 2016: R+25.4 2012: R+20.9 2008: R+25.2
Not yet ingested
- Civics
- —
Market trends
- HPI YoY
- ▼ -95.15%
- Current HPI
- 220.1737
- Rent YoY
- ▲ 8.93%
- Metro
- Monroe, LA
- State GDP YoY
- ▲ 3.29%
- F500 in state
- 10
Industry mix (Fortune 500 HQ in LA)
| Industry | F500 HQs | Revenue |
|---|---|---|
| Telecommunications | 2 | $23B |
|
||
| Utilities | 1 | $12B |
|
||
| Wholesale / Distribution | 1 | $5B |
|
||
| Advertising | 1 | $2B |
|
||
Price history
-4.9% since first listed3 events — show timeline
- 2026-05-02 Pending — NELABOR
- 2026-05-01 Listed $95,000 NELABOR
- 2012-04-30 Sold (Public Records) $99,900 Public Records
Property tax history
+2.0%/yrLatest (2025): $1,034 · -1.2% YoY. Source: county tax records.
Cash-flow waterfall
monthlySold comps — $/sqft
last 12 mo · ≤1 miLoading sold comps…