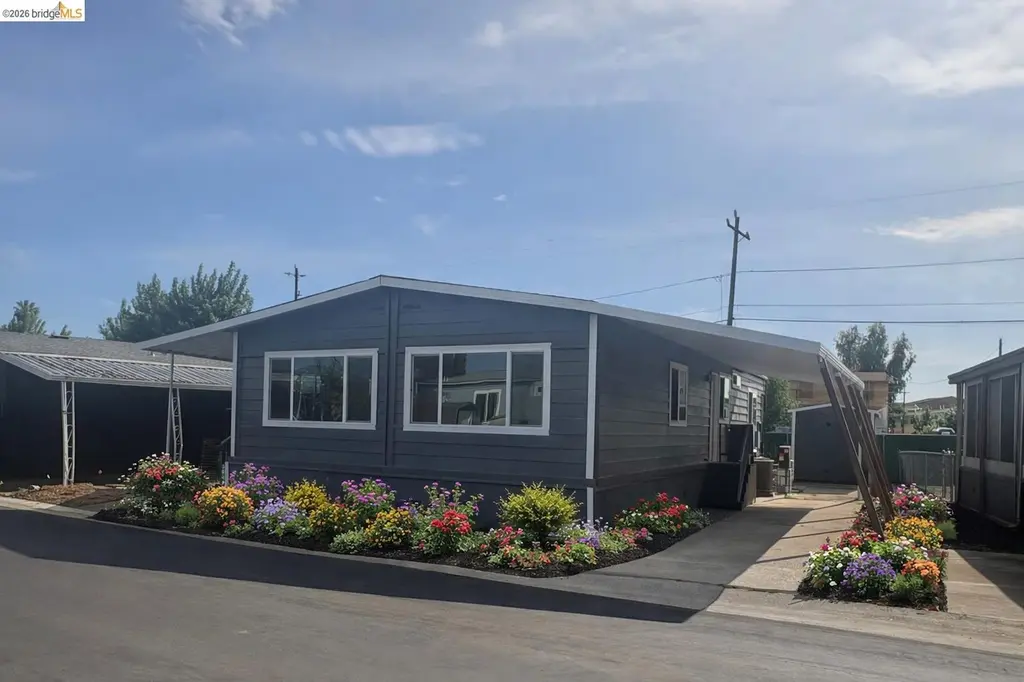
3645 Hawthorne Dr #104 · Bethel Island, CA
Flood risk 1/10 · Minimal
- FEMA flood zone
- AE
- Chance of flooding over 30 yrs
- 0.0%
- Est. flood insurance / yr
- $1,737 – $8,500
Fire risk 4/10 · Minor
- Est. fire insurance / yr
- $659 – $1,223
Heat risk 6/10 · Moderate
- Hot days now (above 101°F)
- 7 days/yr
- Hot days in 30 yrs
- 14 days/yr
Wind risk 1/10 · Minimal
- Chance of severe wind over 30 yrs
- —
Air-quality risk 10/10 · Severe
- Unhealthy air days now
- 21 days/yr
- Unhealthy air days in 30 yrs
- 23 days/yr
Risk factors via First Street. Map © Google.
Why this score? — see what drove the B grade
The composite is a weighted blend of 9 inputs, each scored 0–100. Each bar is that input's sub-score; the figure is the points it added to the 100-point composite (weight × sub-score).
- Cash flow +30.0/30.0
- 1% rule +10.0/10.0
- DSCR +10.0/10.0
- Appreciation +10.0/10.0
- Schools +3.4/10.0
- Rent growth +2.5/5.0
- Livability +2.5/5.0
- Condition / age +2.5/5.0
- ARV discount +0.0/15.0
$198,000
🖨 Deal sheet (PDF) 📄 Offer letter ✓ Due diligence
Listing remarks MLS
SOME CLEAN UP NEEDED, FULLY ENCLOSED FRONT PORCH CLOSE TO POOL AND REC ROOM.
Key facts
- Fully remodeled
- Clubhouse
- Community perks
Tags
Property features AI
Finance
- HOA & community: The Willows community with clubhouse, pool, BBQ area, picnic area, recreation room with fireplace; Pet policies allow dogs and cats (restrictions and approvals apply); Guest parking and RV storage
Exterior
- Parking: Guest parking available in community; RV storage in community
- Utilities: Seller-owned photovoltaics; Public sewer; Cable available
- Home design: Manufactured in park (mobile home); Double wide
- Construction: Aluminum and wood siding
- Exterior features: Enclosed, carpeted patio/porch with awning(s); Back yard; Low-maintenance yard; Shed(s); Close to clubhouse; Level lot
Interior
- Kitchen: Dishwasher; Gas range / cooktop; Built-in oven; Breakfast bar
- Bedrooms: 2 bedrooms
- Flooring: Laminate
- Bathrooms: 2 full bathrooms
- Heating & cooling: Central heating; Central air conditioning
- Interior features: Breakfast bar; Dining area; Enclosed Florida / screen room; Storage
- Laundry & utility: Laundry room; 220V outlet; Electric and gas water heaters
Neighborhood map
What this means for you Summary
Snapshot
- This is a 2-bed/2.0-bath manufactured listed at $198k.
Deal economics
- At list price, monthly cash flow is $1k ($14k/yr) — positive.
- The deal already cash-flows at list — no discount required.
- Meets the 1% rule at list price ($4k rent vs $198k).
- Recommended offer: $192k (3.0% below list) — sets the bar for market timing.
Location & tenants
- Location reads 49/100 on livability (#1,166 in CA) — a working-class tenant base; expect higher turnover. Strengths: crime A-; Watch: employment C-, amenities F, commute F.
- Oakley Union Elementary (suburban): math 26% / reading 40% proficiency, ranked #837 of 1,400 in CA (top 60%) — families likely to look elsewhere, expect single-tenant / working-renter base with shorter leases.
- Zoned schools: Iron House Elementary (496 students, 44% FRL); Delta Vista Middle (910 students, 40% FRL); Freedom High (2,527 students, 32% FRL) — zoned schools at 39% FRL track the district average.
- Market conditions: 79 active listings in the ZIP; 2,169 units permitted in Contra Costa County in 2024 (896 in 5+ unit buildings).
Forward outlook
- In year one you build about $21k of equity ($1k loan paydown + $20k appreciation (10.0% local appreciation)).
- Contra Costa County population projected at +26% by 2050 — long-run rental-demand tailwind backs the buy-and-hold thesis.
- At projected returns (10.0% appreciation + 3.0% rent growth), your $55k cash investment doubles in ~2 years — after that, you're playing with house money.
- By year 2, paydown + projected appreciation supports a ~$34k cash-out refi (75% LTV) — recoverable capital for the next deal without selling this one.
Negotiation context
- It's been on market 38 days — a 3% lower offer ($192k) is reasonable based on typical stale-listing flexibility.
- 5 sale attempts since 28y ago with the ask held roughly flat each time — persistent listings suggest the price (not the market) is what's stuck; bring a comps-based counter.
- Current owner paid $23k; list at $198k implies a 761% gain — meaningful room to come down on a strong offer.
Risks & watch-outs
- Watch-outs: flood insurance adds $427/mo.
- Climate carrying-cost: in FEMA flood zone AE (mandatory federal flood insurance); extreme-heat days projected 7→14/yr by 2055 (HVAC capex compounding) — expect insurance premiums to compound above CPI over the hold.
Questions for the listing agent
- It's been on market 38 days. Have you received any prior offers? Is the seller open to a 3% concession, seller financing, or rate buy-down credit?
- What's the actual annual flood-insurance premium (NFIP or private), and is the property in a SFHA with mandatory coverage?
- Is there a deadline driving the sale (1031 exchange, divorce, estate, relocation)? That informs how much negotiation room exists.
- Schools are F-rated, which usually means shorter tenancies and higher turnover. Who's the typical renter profile here, and what's been the actual vacancy rate?
- What's the average days-on-market for RENTAL listings here right now (not sales)? A rising rental-DOM trend means longer vacancies and softer asking-rent achievability than the comps imply.
- What's the recent tenant-quality profile in this submarket — average credit score on applications, eviction rate, late-payment / NSF rate, and stable-employment percentage? A property-management company in the area should have these aggregated.
- How much new for-sale + rental construction is in the pipeline within 1–3 miles? Heavy new supply typically softens prices + rents 12–24 months out; constrained supply supports both.
Investment metrics
- 1% rule
- 1.88% ✓
- Cap rate
- 15.84%
- Cash-on-cash
- 34.11%
- DSCR
- 2.52
- GRM
- 4.4
CMA / ARV
- ARV (on-the-fly)
- $167,552
- Comps found
- 6
Show comp detail 6 sales within ~0.75 mi
| Address | Dist | Beds/Ba | Sqft | Sold | Price | $/sf | Match |
|---|---|---|---|---|---|---|---|
| 336 Alcott Ct #170 | 0.02mi | 3/2.0 (+1) | 1,344 (-4%) | 1mo | $129,000 | $96 | 86 |
| 3760 Porter Cir | 0.03mi | 3/2.0 (+1) | 1,344 (-4%) | 15mo | $159,900 | $119 | 73 |
| 3621 Hawthorne Dr #110 | 0.16mi | 2/2.0 | 1,440 (+2%) | 19mo | $130,000 | $90 | 73 |
| 3513 Alcott Cir #134 | 0.02mi | 2/2.0 | 1,559 (+11%) | 15mo | $195,000 | $125 | 68 |
| 3757 Porter Cir #69 | 0.11mi | 3/2.0 (+1) | 1,344 (-4%) | 22mo | $80,000 | $60 | 64 |
| 3764 Porter Cir #22 | 0.50mi | 2/2.0 | 1,564 (+11%) | 9mo | $198,800 | $127 | 51 |
Match score weights: distance 35% · size 25% · config 20% · recency 20%. Top-matched comps best support the ARV.
Projected returns pro-forma
10.0% appreciation · 3.0% rent growth · sell at horizon
- IRR
- 43.1%
- Equity multiple
- 4.27×
- Total profit
- $181,361
- Equity at exit
- $178,374
- IRR
- 37.3%
- Equity multiple
- 9.61×
- Total profit
- $477,142
- Equity at exit
- $384,670
Cash invested: $55,440 (down + closing). Projections, not guarantees.
Landlord ↔ Tenant lean methodology
- Overall (STATE)
- 18 Strongly Tenant-Friendly
- State California
- 18 Strongly Tenant-Friendly · D+13
- County
- — inherits STATE
- City
- — inherits STATE
ZIP-level market 94511
- Home prices YoY
- 4.6%
- Active inventory
- 79
- Price-to-rent
- 4.4×
Monthly cashflow live
- Estimated rent
- $3,727 medium interval (Pro) →
- Mortgage (P&I)
- −$1,038
- Tax est. 1.5%
- −$248 /mo · $2,970/yr
- Insurance
- −$82
- Flood insurance flood zone
- −$427 /mo · $5,118/yr
- HOA
- −$0
- Vacancy / Maint / Mgmt
- −$783
- Net cashflow
- $1,149
Break-even live
Sensitivity live
| Price | -10% $1,286 | -5% $1,218 | +0% $1,149 | +5% $1,081 | +10% $1,013 |
|---|---|---|---|---|---|
| Rent | -10% $855 | -5% $1,002 | +0% $1,149 | +5% $1,297 | +10% $1,444 |
| Rate | -1.0pp $1,249 | -0.5pp $1,200 | base $1,149 | +0.5pp $1,098 | +1.0pp $1,046 |
UW: 25.0% down · 7.5% · 30yr · 1.5% tax · 5.0% vac · 8.0% maint · 8.0% mgmt
Financing live
Cash to close
- Down payment
- $49,500
- Closing costs
- $5,940
- Reserves months
- —
- Total cash needed
- —
Loan-product check · same deal, 3 products live
Conventional
25% down · 7.5% · 30yr
- Down + closing
- —
- Monthly P&I
- —
- Monthly cashflow
- —
- DSCR
- —
- Eligible?
- —
Personal DTI + credit; lowest rate.
DSCR
20% down · 8.5% · 30yr
- Down + closing
- —
- Monthly P&I
- —
- Monthly cashflow
- —
- DSCR
- —
- Eligible?
- —
No personal income docs; deal must DSCR.
Hard money
10% down · 12.0% · 12mo
- Down + closing
- —
- Monthly P&I
- —
- Monthly cashflow
- —
- DSCR
- —
- Eligible?
- —
Short-term bridge; refi at stabilization.
Listing history 15 events
-
2026-06-02status $198,000 Pending 38 DOM
-
2026-06-01days on market $198,000 Active 38 DOM
-
2026-05-31days on market $198,000 Active 37 DOM
-
2026-04-24$198,000 Active
-
2014-02-28soldstatus $23,000 Sold 76-char remark
Show marketing remark (76 chars)
SOME CLEAN UP NEEDED, FULLY ENCLOSED FRONT PORCH CLOSE TO POOL AND REC ROOM.
-
2013-10-25status Pending 76-char remark
Show marketing remark (76 chars)
SOME CLEAN UP NEEDED, FULLY ENCLOSED FRONT PORCH CLOSE TO POOL AND REC ROOM.
-
2013-09-10$23,000 New 76-char remark
Show marketing remark (76 chars)
SOME CLEAN UP NEEDED, FULLY ENCLOSED FRONT PORCH CLOSE TO POOL AND REC ROOM.
-
2011-11-16historical
-
2011-08-20price Price Change
-
2011-08-15New
-
2011-04-26soldstatus $22,000 Sold
-
2011-04-06$22,000 New
-
1998-09-30soldstatus $34,950
-
1998-09-16$34,000
-
1998-09-16historical
ⓘ Source: listings_history table (triggers on properties + properties_extension) + one-shot
backfill from property_details.listing_events for pre-trigger history.
Climate risk First Street
- Flood 1/10 Low FEMA zone AE · 0% chance over 30 yrs
- Wildfire 4/10 Moderate
- Heat 6/10 Major 7 d/yr ≥101°F today · 14 d/yr by 30 yrs out
- Wind 1/10 Low
- Air quality 10/10 Extreme 21 unhealthy d/yr today · 23 by 30 yrs out
Nearby sold comps map
Loading sold comps map…
Walkable amenities ~0.75 mi
Loading nearby amenities…
Taxation est. · year 1
- Rental income
- $44,723
- − Mortgage interest
- −$11,091
- − Property taxes
- −$2,970
- − Insurance
- −$6,108
- − Repairs & maintenance
- −$3,578
- − Management
- −$3,578
- − Depreciation
- −$5,760
- Taxable income
- $11,638
- Est. tax owed @ 24.0%
- −$2,793
- After-tax cash flow
- $11,000/yr
For passive investors: Depreciation is non-cash, so a rental often shows a tax loss while cash-flowing — sheltering income. Rental losses are passive: they offset passive income freely, and up to $25,000/yr can offset ordinary (W-2) income if you actively participate and your MAGI is under $100k (phasing out to $0 by $150k); unused losses carry forward. On sale, claimed depreciation is recaptured at up to 25%, and gains may owe capital-gains tax (a 1031 exchange can defer both). Figures are a year-1 estimate at your 24.0% rate — not tax advice; consult a CPA.
Schools (NCES district)
- District
- Oakley Union Elementary
- NCES district ID
- 0628080
- Math proficiency
- 26% ▬ 0.00%
- Reading proficiency
- 40% ▲ 1.00%
- Median HH income
- $77,903
- Composite
- 34.04/100
- National rank
- #10301
- State rank
- #837 of 1400 in CA
Livability — Bethel Island
- Score
- 49/100
- State rank
- #1166
- US rank
- #25883
Category grades
Schools grade is shown separately in the Schools card above.
Census & demographics
- Census place
- Bethel Island, CA
- City population
- 2,144
- Population (ZIP)
- 2,144
Population outlook (Contra Costa County) Hauer SSP2
- Today (2025)
- 1,287,720 people
- By 2030
- 1,364,937 · +6.0%
- By 2040
- 1,506,209 · +17.0%
- By 2050
- 1,624,373 · +26.1%
- By 2075
- 1,853,193 · +43.9%
- By 2100
- 1,901,231 · +47.6%
Race, ethnicity, and origin ACS 2023
- Neighborhood character
- Predominantly White (67%)
- Race & ethnicity
- White 67% Hispanic / Latino 25% Asian 6% Two or more races 3% Pacific Islander 2%
- Hispanic origin (detail)
- Mexican 25%
- Common ancestry
- Slovak 5% Serbian 2% Portuguese 2%
- Foreign-born
- 27% · Canada, South Korea, China
- Languages at home
- 77% English-only · Spanish 20% Other Asian/Pacific 2% Chinese 1%
Political lean MEDSL · Contra Costa
- 2024 margin
- Solid D (+38.0) · D 67.3% · R 29.4% · Other 3.3%
- 2008→2024 swing
- +0.2pp no change · 2008: 37.8pp · 2024: 38.0pp
- All cycles
- 2024: D+38.0 2020: D+45.3 2016: D+43.5 2012: D+33.7 2008: D+37.8
Not yet ingested
- Civics
- —
Market trends
- HPI YoY
- ▲ 13.77%
- Current HPI
- 312.0698
- Rent YoY
- —
- Metro
- —
- State GDP YoY
- ▲ 3.21%
- F500 in state
- 116
Industry mix (Fortune 500 HQ in CA)
| Industry | F500 HQs | Revenue |
|---|---|---|
| Technology | 27 | $1,492B |
|
||
| Financial Services | 3 | $174B |
|
||
| Retail | 3 | $44B |
|
||
| Insurance | 3 | $26B |
|
||
| Media / Entertainment | 2 | $115B |
|
||
| Pharmaceuticals / Biotech | 2 | $62B |
|
||
Price history
+482.4% since first listed12 events — show timeline
- 2026-04-24 Listed $198,000 bridgeMLS, Bay East AOR, or Contra Costa AOR
- 2014-02-28 Sold (MLS) $23,000 bridgeMLS, Bay East AOR, or Contra Costa AOR
- 2013-10-25 Pending — bridgeMLS, Bay East AOR, or Contra Costa AOR
- 2013-09-10 Listed $23,000 bridgeMLS, Bay East AOR, or Contra Costa AOR
- 2011-11-16 Listing Removed — bridgeMLS, Bay East AOR, or Contra Costa AOR
- 2011-08-20 Price Changed — bridgeMLS, Bay East AOR, or Contra Costa AOR
- 2011-08-15 Listed — bridgeMLS, Bay East AOR, or Contra Costa AOR
- 2011-04-26 Sold (MLS) $22,000 bridgeMLS, Bay East AOR, or Contra Costa AOR
- 2011-04-06 Listed $22,000 bridgeMLS, Bay East AOR, or Contra Costa AOR
- 1998-09-30 Sold (MLS) $34,950 bridgeMLS, Bay East AOR, or Contra Costa AOR
- 1998-09-16 Listing Removed — bridgeMLS, Bay East AOR, or Contra Costa AOR
- 1998-09-16 Listed $34,000 bridgeMLS, Bay East AOR, or Contra Costa AOR
Property tax history
-2.7%/yrLatest (2025): $148 · +2.9% YoY. Source: county tax records.
Cash-flow waterfall
monthlySold comps — $/sqft
last 12 mo · ≤1 miLoading sold comps…