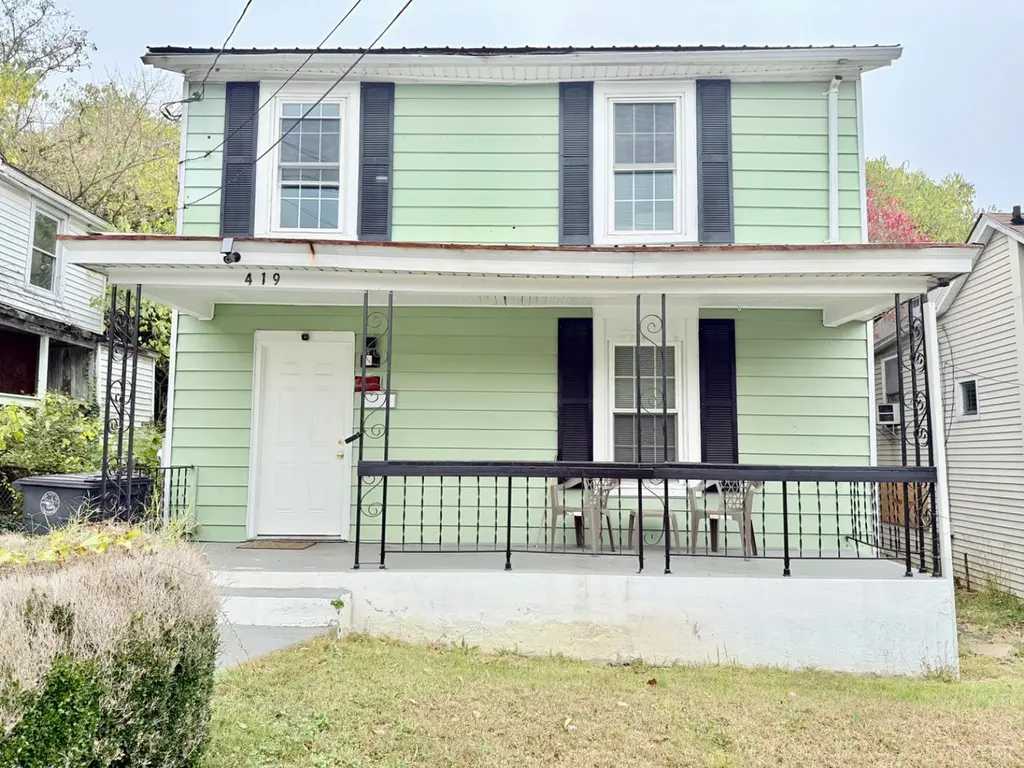
419 Florida Ave · Lynchburg, VA
Flood risk 1/10 · Minimal
- FEMA flood zone
- X (unshaded)
- Chance of flooding over 30 yrs
- 0.0%
- Est. flood insurance / yr
- $507 – $1,088
Fire risk 2/10 · Minimal
- Est. fire insurance / yr
- $666 – $1,236
Heat risk 6/10 · Moderate
- Hot days now (above 102°F)
- 7 days/yr
- Hot days in 30 yrs
- 18 days/yr
Wind risk 2/10 · Minimal
- Chance of severe wind over 30 yrs
- 3.0%
Air-quality risk 2/10 · Minimal
- Unhealthy air days now
- 0 days/yr
- Unhealthy air days in 30 yrs
- 1 days/yr
Risk factors via First Street. Map © Google.
Why this score? — see what drove the C- grade
The composite is a weighted blend of 9 inputs, each scored 0–100. Each bar is that input's sub-score; the figure is the points it added to the 100-point composite (weight × sub-score).
- Cash flow +25.6/30.0
- DSCR +8.5/10.0
- 1% rule +5.6/10.0
- Livability +4.5/5.0
- Schools +4.0/10.0
- Rent growth +2.8/5.0
- Condition / age +2.5/5.0
- ARV discount +0.2/15.0
- Appreciation +0.0/10.0
$155,000
🖨 Deal sheet 📄 Offer letter ✓ Due diligence
Listing remarks MLS
Welcome to 419 Florida AVE, this home offers 4 LARGE bedrooms & 2 full bathrooms. Located in the heart of Lynchburg ready to become home for a first time buyer or a cash cow for an investor.
Key facts
- 0.26 acre lot
- Built 1910
- Listed 223 days
Neighborhood map
What this means for you Summary
Snapshot
- This is a 4-bed/1.0-bath single-family listed at $155k.
Deal economics
- At list price, monthly cash flow is $369 ($4k/yr) — positive.
- The deal already cash-flows at list — no discount required.
- Meets the 1% rule at list price ($2k rent vs $155k).
- Recommended offer: $136k (12.0% below list) — sets the bar for market timing.
- Cap rate 9.1% vs local median 4.0% in Lynchburg — top-decile yield for the area; either an underpriced asset or a hidden risk that comps aren't pricing in. Stress-test before assuming the spread holds.
Location & tenants
- Location reads 91/100 on livability (#1 in VA, #58 nationally) — a professional / high-income tenant draw. Strengths: amenities A+, commute A+, cost of living A+; Watch: crime C-, employment D+.
- Lynchburg City Public School District (urban): math 36% / reading 61% proficiency, ranked #104 of 131 in VA (top 79%) — families likely to look elsewhere, expect single-tenant / working-renter base with shorter leases; 61% free/reduced lunch — lower-income household profile, screen leases tightly.
- Market conditions: Rents rising (+1.1%/yr); 216 active listings in the ZIP; 15 comparable units currently listed for rent nearby; rentals at typical pace (median 21d on market — plan ~3-4 weeks tenant-placement turnaround); lower-income renter base — watch delinquency; 472 units permitted in Lynchburg city in 2024 (240 in 5+ unit buildings).
- At $1,639/mo this rent would consume 47% of the median local household income ($42k/yr) (locally 1717% of renters already pay >50% of income on rent) — very limited rent-growth headroom before tenants either downsize or default.
Forward outlook
- Local home prices are declining (-3.0%/yr); year-one equity from $1k of loan paydown is wiped out by about $5k of value loss. Plan a longer hold.
- Lynchburg County population projected at +37% by 2050 — long-run rental-demand tailwind backs the buy-and-hold thesis.
Negotiation context
- It's been on market 224 days — a 12% lower offer ($136k) is reasonable based on typical stale-listing flexibility.
- 2 sale attempts; this cycle's ask has dropped $15k (9%) from the opening price — seller is motivated, your offer sets the floor, not the list.
Risks & watch-outs
- Watch-outs: built in 1910 — expect roof / HVAC / electrical / plumbing capex.
- Climate carrying-cost: extreme-heat days projected 7→18/yr by 2055 (HVAC capex compounding) — expect insurance premiums to compound above CPI over the hold.
Questions for the listing agent
- It's been on market 224 days. Have you received any prior offers? Is the seller open to a 12% concession, seller financing, or rate buy-down credit?
- Built in 1910 — when were the roof, HVAC, electrical panel, plumbing, and water heater last replaced?
- Why hasn't it sold? Are there any deal-killer items the seller is aware of (foundation, flood, title, zoning, code violations)?
- Is there a deadline driving the sale (1031 exchange, divorce, estate, relocation)? That informs how much negotiation room exists.
- Schools are A-rated — typically a magnet for longer-tenancy family renters. What's the average tenant stay here, and is there a school-zone premium baked into asking?
- What's the average days-on-market for RENTAL listings here right now (not sales)? A rising rental-DOM trend means longer vacancies and softer asking-rent achievability than the comps imply.
- What's the recent tenant-quality profile in this submarket — average credit score on applications, eviction rate, late-payment / NSF rate, and stable-employment percentage? A property-management company in the area should have these aggregated.
- How much new for-sale + rental construction is in the pipeline within 1–3 miles? Heavy new supply typically softens prices + rents 12–24 months out; constrained supply supports both.
Investment metrics
- 1% rule
- 1.06% ✓
- Cap rate
- 9.15%
- Cash-on-cash
- 10.19%
- DSCR
- 1.45
- GRM
- 7.9
CMA / ARV
- ARV (median comp)
- $133,421
- List price
- $155,000
- Delta
- 16.17%
- Verdict
- OVERPRICED
- Comps
- 20 within 1.0 mi
Show comp detail 12 sales within ~0.75 mi
| Address | Dist | Beds/Ba | Sqft | Sold | Price | $/sf | Match |
|---|---|---|---|---|---|---|---|
| 509 Franklin St St | 0.14mi | 3/2.0 (-1) | 1,860 (+1%) | 2mo | $180,000 | $97 | 81 |
| 1706 Union St | 0.15mi | 3/2.0 (-1) | 1,720 (-6%) | 6mo | $85,000 | $49 | 68 |
| 1321 Taylor St | 0.63mi | 4/2.0 | 1,806 (-2%) | 6mo | $136,000 | $75 | 58 |
| 1009 16th St. St | 0.46mi | 3/1.0 (-1) | 1,730 (-6%) | 8mo | $189,900 | $110 | 57 |
| 1603 Taylor St | 0.54mi | 3/1.5 (-1) | 1,948 (+6%) | 6mo | $90,500 | $46 | 53 |
| 1021 Harrison St | 0.66mi | 3/2.0 (-1) | 1,942 (+6%) | 2mo | $250,000 | $129 | 49 |
| 1509 Wise St | 0.61mi | 5/2.0 (+1) | 1,758 (-4%) | 8mo | $140,000 | $80 | 48 |
| 1434 Augusta St | 0.65mi | 3/2.0 (-1) | 1,976 (+8%) | 2mo | $182,000 | $92 | 46 |
| 1109 Harrison St | 0.61mi | 3/1.0 (-1) | 1,650 (-10%) | 4mo | $265,000 | $161 | 46 |
| 1301 Clay St | 0.47mi | 3/3.5 (-1) | 2,038 (+11%) | 11mo | $334,000 | $164 | 35 |
| 1001 Jackson St | 0.74mi | 4/1.0 | 1,569 (-15%) | 11mo | $92,000 | $59 | 32 |
| 915 17th St | 0.43mi | 5/5.0 (+1) | 2,108 (+15%) | 12mo | $215,000 | $102 | 26 |
Match score weights: distance 35% · size 25% · config 20% · recency 20%. Top-matched comps best support the ARV.
Projected returns pro-forma
-3.0% appreciation · 1.15% rent growth · sell at horizon
- IRR
- -2.9%
- Equity multiple
- 0.89×
- Total profit
- $-4,696
- Equity at exit
- $23,111
- IRR
- 4.8%
- Equity multiple
- 1.32×
- Total profit
- $14,040
- Equity at exit
- $13,402
Cash invested: $43,400 (down + closing). Projections, not guarantees.
Landlord ↔ Tenant lean methodology
- Overall (STATE)
- 55 Moderately Landlord-Leaning
- State Virginia
- 55 Moderately Landlord-Leaning · D+2
- County
- — inherits STATE
- City
- — inherits STATE
ZIP-level market 24501
- Rents YoY
- 1.1%
- Active inventory
- 216
- Price-to-rent
- 7.9×
Monthly cashflow live
- Estimated rent
- $1,639 high interval (Pro) →
- Mortgage (P&I)
- −$813
- Tax from tax record
- −$49 /mo · $584/yr
- Insurance
- −$65
- HOA
- −$0
- Vacancy / Maint / Mgmt
- −$344
- Net cashflow
- $369
Break-even live
UW: 25.0% down · 7.5% · 30yr · 1.5% tax · 5.0% vac · 8.0% maint · 8.0% mgmt
Financing live
Cash to close
- Down payment
- $38,750
- Closing costs
- $4,650
- Reserves months
- —
- Total cash needed
- —
Loan-product check · same deal, 3 products live
Conventional
25% down · 7.5% · 30yr
- Down + closing
- —
- Monthly P&I
- —
- Monthly cashflow
- —
- DSCR
- —
- Eligible?
- —
Personal DTI + credit; lowest rate.
DSCR
20% down · 8.5% · 30yr
- Down + closing
- —
- Monthly P&I
- —
- Monthly cashflow
- —
- DSCR
- —
- Eligible?
- —
No personal income docs; deal must DSCR.
Hard money
10% down · 12.0% · 12mo
- Down + closing
- —
- Monthly P&I
- —
- Monthly cashflow
- —
- DSCR
- —
- Eligible?
- —
Short-term bridge; refi at stabilization.
Rent comps 15 comps
| Address | Beds | Baths | Sqft | Rent | $/sqft | DOM | Units | Dist |
|---|---|---|---|---|---|---|---|---|
| 1701 Grace St Lynchburg, VA | 4.0 | 2.0 | 2173 | $1,495 | $0.69 | 13d | 1 | 0.38mi |
| 1316 Harrison St Lynchburg, VA | 3.0 | 1.5 | 1535 | $1,500 | $0.98 | 43d | 1 | 0.43mi |
| 1521 Taylor St Lynchburg, VA | 3.0 | 1.0 | 1337 | $1,195 | $0.89 | 21d | 1 | 0.54mi |
| 1308 16th St Lynchburg, VA | 3.0 | 2.0 | 1380 | $1,800 | $1.30 | 13d | 1 | 0.59mi |
| 1518 Fillmore St Lynchburg, VA | 3.0 | 2.5 | 1560 | $1,800 | $1.15 | 13d | 1 | 0.68mi |
| 1514 Fillmore St Lynchburg, VA | 3.0 | 2.5 | 1560 | $1,800 | $1.15 | 13d | 1 | 0.68mi |
| 1415 Floyd St Lynchburg, VA | 3.0 | 2.0 | 1300 | $1,800 | $1.38 | 21d | 1 | 0.69mi |
| 1110 11th St Lynchburg, VA | 3.0 | 1.5 | 2000 | $1,450 | $0.72 | 13d | 1 | 0.72mi |
| 1105 Fillmore St Unit B Lynchburg, VA | 3.0 | 1.0 | 1300 | $1,250 | $0.96 | 43d | 1 | 0.87mi |
| 1008 8th St Lynchburg, VA | 3.0 | 2.0 | 1316 | $1,795 | $1.36 | 21d | 1 | 0.87mi |
| 812 Taylor St Lynchburg, VA | 3.0 | 2.0 | 1872 | $1,950 | $1.04 | 13d | 1 | 0.88mi |
| 512 Polk St Lynchburg, VA | 3.0 | 1.0 | 1340 | $1,295 | $0.97 | 21d | 1 | 1.03mi |
| 800 Pierce St Lynchburg, VA | 4.0 | 1.0 | 1714 | $1,295 | $0.76 | 43d | 1 | 1.05mi |
| 403 Grove St Lynchburg, VA | 3.0 | 2.0 | 1400 | $1,600 | $1.14 | 43d | 1 | 1.45mi |
| 507 Victoria Ave Unit 507 Lynchburg, VA | 4.0 | 2.0 | 1480 | $1,700 | $1.15 | 21d | 1 | 1.47mi |
Listing history 22 events
-
2026-06-19days on market $155,000 Active 224 DOM
-
2026-06-18days on market $155,000 Active 223 DOM
-
2026-06-17days on market $155,000 Active 222 DOM
-
2026-06-16days on market $155,000 Active 221 DOM
-
2026-06-15days on market $155,000 Active 220 DOM
-
2026-06-14days on market $155,000 Active 218 DOM
-
2026-06-13days on market $155,000 Active 217 DOM
-
2026-06-10days on market $155,000 Active 215 DOM
-
2026-06-09days on market $155,000 Active 214 DOM
-
2026-06-08days on market $155,000 Active 213 DOM
-
2026-06-07days on market $155,000 Active 212 DOM
-
2026-06-03days on market $155,000 Active 208 DOM
-
2026-06-02days on market $155,000 Active 207 DOM
-
2026-06-01days on market $155,000 Active 206 DOM
-
2026-05-31days on market $155,000 Active 205 DOM
-
2026-05-30days on market $155,000 Active 204 DOM
-
2026-03-24price $155,000 196-char remark
Show marketing remark (196 chars)
Welcome to 419 Florida AVE, this home offers 4 LARGE bedrooms & 2 full bathrooms. Located in the heart of Lynchburg ready to become home for a first time buyer or a cash cow for an investor.
-
2026-02-10price $158,000 196-char remark
Show marketing remark (196 chars)
Welcome to 419 Florida AVE, this home offers 4 LARGE bedrooms & 2 full bathrooms. Located in the heart of Lynchburg ready to become home for a first time buyer or a cash cow for an investor.
-
2025-11-28price $160,000 196-char remark
Show marketing remark (196 chars)
Welcome to 419 Florida AVE, this home offers 4 LARGE bedrooms & 2 full bathrooms. Located in the heart of Lynchburg ready to become home for a first time buyer or a cash cow for an investor.
-
2025-11-28status Active 196-char remark
Show marketing remark (196 chars)
Welcome to 419 Florida AVE, this home offers 4 LARGE bedrooms & 2 full bathrooms. Located in the heart of Lynchburg ready to become home for a first time buyer or a cash cow for an investor.
-
2025-11-18status Pending 196-char remark
Show marketing remark (196 chars)
Welcome to 419 Florida AVE, this home offers 4 LARGE bedrooms & 2 full bathrooms. Located in the heart of Lynchburg ready to become home for a first time buyer or a cash cow for an investor.
-
2025-10-28$169,900 Active 196-char remark
Show marketing remark (196 chars)
Welcome to 419 Florida AVE, this home offers 4 LARGE bedrooms & 2 full bathrooms. Located in the heart of Lynchburg ready to become home for a first time buyer or a cash cow for an investor.
ⓘ Source: listings_history table (triggers on properties + properties_extension) + one-shot
backfill from property_details.listing_events for pre-trigger history.
Tax reassessment forecast VA · Resets to sale price
- Current annual tax
- $584 · $49/mo
- Projected year-2 tax
- $1,271 · $106/mo
- Expected delta
- +$687/yr (+$57/mo · 117.7%)
ⓘ Screening estimate from a state-policy table — verify with the county assessor before closing.
Climate risk First Street
- Flood 1/10 Low FEMA zone X (unshaded) · 0% chance over 30 yrs
- Wildfire 2/10 Low
- Heat 6/10 Major 7 d/yr ≥102°F today · 18 d/yr by 30 yrs out
- Wind 2/10 Low 3% chance of damaging wind over 30 yrs
- Air quality 2/10 Low 0 unhealthy d/yr today · 1 by 30 yrs out
Nearby sold comps map
Loading sold comps map…
Walkable amenities ~0.75 mi
Loading nearby amenities…
Taxation est. · year 1
- Rental income
- $19,667
- − Mortgage interest
- −$8,682
- − Property taxes
- −$584
- − Insurance
- −$775
- − Repairs & maintenance
- −$1,573
- − Management
- −$1,573
- − Depreciation
- −$4,509
- Taxable income
- $1,970
- Est. tax owed @ 24.0%
- −$473
- After-tax cash flow
- $3,951/yr
For passive investors: Depreciation is non-cash, so a rental often shows a tax loss while cash-flowing — sheltering income. Rental losses are passive: they offset passive income freely, and up to $25,000/yr can offset ordinary (W-2) income if you actively participate and your MAGI is under $100k (phasing out to $0 by $150k); unused losses carry forward. On sale, claimed depreciation is recaptured at up to 25%, and gains may owe capital-gains tax (a 1031 exchange can defer both). Figures are a year-1 estimate at your 24.0% rate — not tax advice; consult a CPA.
Schools (NCES district)
- District
- Lynchburg City Public School District
- NCES district ID
- 5102340
- Math proficiency
- 36% ▼ -38.00%
- Reading proficiency
- 61% ▼ -8.00%
- Median HH income
- $39,097
- Composite
- 40.4/100
- National rank
- #3730
- State rank
- #104 of 131 in VA
Livability — Lynchburg
- Score
- 91/100
- State rank
- #1
- US rank
- #58
Category grades
Schools grade is shown separately in the Schools card above.
Census & demographics
- Census place
- Lynchburg, VA
- County
- Lynchburg City · 97,036 people
- City population
- 97,036
- Metro
- Lynchburg, VA
- Population (ZIP)
- 25,006
- Household income
- $42,222
- Rent vs Own
- Severe rent burden
- 1717.0
Population outlook (Lynchburg County) Hauer SSP2
- Today (2025)
- 87,977 people
- By 2030
- 93,626 · +6.4%
- By 2040
- 106,145 · +20.7%
- By 2050
- 120,783 · +37.3%
- By 2075
- 162,249 · +84.4%
- By 2100
- 191,358 · +117.5%
Race, ethnicity, and origin ACS 2023
- Neighborhood character
- Diverse neighborhood (Simpson 0.55)
- Race & ethnicity
- White 58% Black 34% Two or more races 4% Hispanic / Latino 3%
- Common ancestry
- Slovak 1% Italian 1% Serbian 1%
- Foreign-born
- 3% · Canada
- Languages at home
- 96% English-only · Spanish 2%
Political lean MEDSL · Lynchburg
- 2024 margin
- Lean R (+7.9) · D 45.4% · R 53.3% · Other 1.3%
- 2008→2024 swing
- -3.9pp toward R · 2008: -4.0pp · 2024: -7.9pp
- All cycles
- 2024: R+7.9 2020: D+2.6 2016: R+9.0 2012: R+10.6 2008: R+4.0
Not yet ingested
- Civics
- —
Market trends
- HPI YoY
- ▼ -131.06%
- Current HPI
- 223.6839
- Rent YoY
- ▲ 1.15%
- Metro
- Lynchburg, VA
- State GDP YoY
- ▲ 2.40%
- F500 in state
- 50
Industry mix (Fortune 500 HQ in VA)
| Industry | F500 HQs | Revenue |
|---|---|---|
| Aerospace / Defense | 4 | $236B |
|
||
| Technology / Defense | 3 | $32B |
|
||
| Financial Services | 2 | $176B |
|
||
| Utilities | 2 | $27B |
|
||
| Insurance | 2 | $25B |
|
||
| Technology | 2 | $15B |
|
||
Price history
-8.8% since first listed6 events — show timeline
- 2026-03-24 Price Changed $155,000 LMLS
- 2026-02-10 Price Changed $158,000 LMLS
- 2025-11-28 Price Changed $160,000 LMLS
- 2025-11-28 Relisted — LMLS
- 2025-11-18 Pending — LMLS
- 2025-10-28 Listed $169,900 LMLS
Property tax history
+5.1%/yrLatest (2025): $584 · +167.7% YoY. Source: county tax records.
Cash-flow waterfall
monthlySold comps — $/sqft
last 12 mo · ≤1 miLoading sold comps…