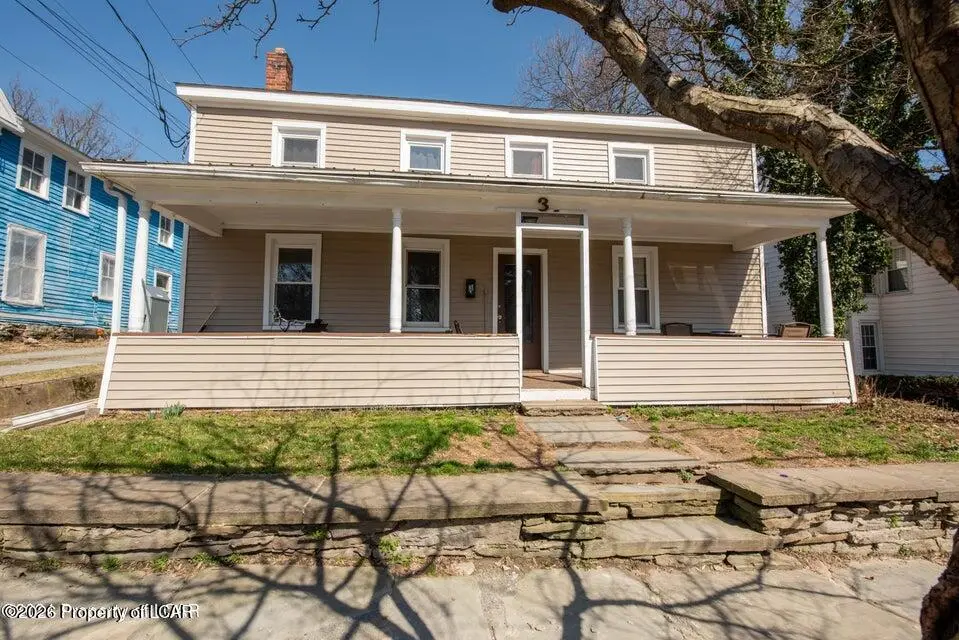
3 Harrison St · Tunkhannock, PA
Flood risk 1/10 · Minimal
- FEMA flood zone
- X (unshaded)
- Chance of flooding over 30 yrs
- 0.0%
- Est. flood insurance / yr
- $473 – $860
Fire risk 3/10 · Minor
- Est. fire insurance / yr
- $511 – $949
Heat risk 4/10 · Minor
- Hot days now (above 96°F)
- 7 days/yr
- Hot days in 30 yrs
- 17 days/yr
Wind risk 2/10 · Minimal
- Chance of severe wind over 30 yrs
- 4.0%
Air-quality risk 2/10 · Minimal
- Unhealthy air days now
- 0 days/yr
- Unhealthy air days in 30 yrs
- 1 days/yr
Risk factors via First Street. Map © Google.
Why this score? — see what drove the D+ grade
The composite is a weighted blend of 9 inputs, each scored 0–100. Each bar is that input's sub-score; the figure is the points it added to the 100-point composite (weight × sub-score).
- Cash flow +13.9/30.0
- ARV discount +12.6/15.0
- DSCR +4.2/10.0
- Livability +3.9/5.0
- Appreciation +3.7/10.0
- 1% rule +3.5/10.0
- Schools +3.1/10.0
- Rent growth +2.5/5.0
- Condition / age +2.5/5.0
$163,000
🖨 Deal sheet 📄 Offer letter ✓ Due diligence
Listing remarks MLS
Tenant occupied!Sat and Sun 12pm to 2pm onlyProof of funds required24-hour notice to schedule. Great investment property or a perfect starter home. Agent related to sellerSold as-is
Key facts
- Large backyard
- Newer siding
- Storage shed
Tags
Neighborhood map
What this means for you Summary
Snapshot
- This is a 4-bed/1.0-bath other listed at $163k.
Deal economics
- At list price, monthly cash flow is $18 ($219/yr) — positive.
- The deal already cash-flows at list — no discount required.
- To meet the 1% rule (rent ≥ 1% of price), the offer needs to be $138k (15.5% below list).
- Recommended offer: $138k (15.5% below list) — sets the bar for 1% rule.
- Cap rate 6.4% vs local median 5.1% in Tunkhannock — meaningfully above typical; check what's discounted (condition, days-on-market, listing class) to confirm the premium yield is real.
Location & tenants
- Location reads 77/100 on livability (#371 in PA, #3,219 nationally) — a middle-class / working-renter tenant base. Strengths: cost of living A+, housing A, health & safety A-; Watch: employment D+, amenities F, commute F.
- Tunkhannock Area SD (town): math 29% / reading 43% proficiency, ranked #397 of 539 in PA (top 74%) — families likely to look elsewhere, expect single-tenant / working-renter base with shorter leases.
- Market conditions: 58 active listings in the ZIP; 3 comparable units currently listed for rent nearby; rentals at typical pace (median 14d on market — plan ~3-4 weeks tenant-placement turnaround); 33 units permitted in Wyoming County in 2024 (0 in 5+ unit buildings).
Forward outlook
- Local home prices are declining (-2.6%/yr); year-one equity from $1k of loan paydown is wiped out by about $4k of value loss. Plan a longer hold.
- Wyoming County population projected at -23% by 2050 — secular population decline; favor cash flow + early exit over multi-decade hold.
Negotiation context
- It's been on market 112 days — a 9% lower offer ($148k) is reasonable based on typical stale-listing flexibility.
- 2 sale attempts since 4y ago with the ask held roughly flat each time — persistent listings suggest the price (not the market) is what's stuck; bring a comps-based counter.
- Current owner paid $36k; list at $163k implies a 359% gain — meaningful room to come down on a strong offer.
Questions for the listing agent
- It's been on market 112 days. Have you received any prior offers? Is the seller open to a 15% concession, seller financing, or rate buy-down credit?
- Why hasn't it sold? Are there any deal-killer items the seller is aware of (foundation, flood, title, zoning, code violations)?
- Is there a deadline driving the sale (1031 exchange, divorce, estate, relocation)? That informs how much negotiation room exists.
- Schools are B-rated — typically a magnet for longer-tenancy family renters. What's the average tenant stay here, and is there a school-zone premium baked into asking?
- The area grade is low — what's the realistic commute time and amenity access for the typical tenant pool here? Any planned neighborhood developments (good or bad) we should know about?
- What's the average days-on-market for RENTAL listings here right now (not sales)? A rising rental-DOM trend means longer vacancies and softer asking-rent achievability than the comps imply.
- What's the recent tenant-quality profile in this submarket — average credit score on applications, eviction rate, late-payment / NSF rate, and stable-employment percentage? A property-management company in the area should have these aggregated.
- How much new for-sale + rental construction is in the pipeline within 1–3 miles? Heavy new supply typically softens prices + rents 12–24 months out; constrained supply supports both.
Investment metrics
- 1% rule
- 0.85% ✗
- Cap rate
- 6.43%
- Cash-on-cash
- 0.48%
- DSCR
- 1.02
- GRM
- 9.9
CMA / ARV
- ARV (median comp)
- $183,646
- List price
- $163,000
- Delta
- -11.24%
- Verdict
- UNDERPRICED
- Comps
- 20 within 1.0 mi
Projected returns pro-forma
-2.57% appreciation · 3.0% rent growth · sell at horizon
- IRR
- -13.1%
- Equity multiple
- 0.51×
- Total profit
- $-22,310
- Equity at exit
- $27,446
- IRR
- -4.8%
- Equity multiple
- 0.66×
- Total profit
- $-15,428
- Equity at exit
- $19,550
Cash invested: $45,640 (down + closing). Projections, not guarantees.
Landlord ↔ Tenant lean methodology
- Overall (STATE)
- 62 Landlord-Friendly
- State Pennsylvania
- 62 Landlord-Friendly · EVEN
- County
- — inherits STATE
- City
- — inherits STATE
ZIP-level market 18657
- Home prices YoY
- -1.0%
- Active inventory
- 58
- Price-to-rent
- 9.9×
Monthly cashflow live
- Estimated rent
- $1,378 medium interval (Pro) →
- Mortgage (P&I)
- −$855
- Tax from tax record
- −$148 /mo · $1,770/yr
- Insurance
- −$68
- HOA
- −$0
- Vacancy / Maint / Mgmt
- −$289
- Net cashflow
- $18
Break-even live
UW: 25.0% down · 7.5% · 30yr · 1.5% tax · 5.0% vac · 8.0% maint · 8.0% mgmt
Financing live
Cash to close
- Down payment
- $40,750
- Closing costs
- $4,890
- Reserves months
- —
- Total cash needed
- —
Loan-product check · same deal, 3 products live
Conventional
25% down · 7.5% · 30yr
- Down + closing
- —
- Monthly P&I
- —
- Monthly cashflow
- —
- DSCR
- —
- Eligible?
- —
Personal DTI + credit; lowest rate.
DSCR
20% down · 8.5% · 30yr
- Down + closing
- —
- Monthly P&I
- —
- Monthly cashflow
- —
- DSCR
- —
- Eligible?
- —
No personal income docs; deal must DSCR.
Hard money
10% down · 12.0% · 12mo
- Down + closing
- —
- Monthly P&I
- —
- Monthly cashflow
- —
- DSCR
- —
- Eligible?
- —
Short-term bridge; refi at stabilization.
Rent comps 3 comps
| Address | Beds | Baths | Sqft | Rent | $/sqft | DOM | Units | Dist |
|---|---|---|---|---|---|---|---|---|
| 173 E Tioga St Unit 6 Tunkhannock, PA | 3.0 | 1.0 | 900 | $1,250 | $1.39 | 14d | 1 | 0.39mi |
| 173 E Tioga St Tunkhannock, PA | 3.0 | 1.5 | 820 | $1,450 | $1.77 | 14d | 1 | 0.39mi |
| 173 E Tioga St Apt 6A Tunkhannock, PA | 3.0 | 1.5 | 820 | $1,450 | $1.77 | 44d | 1 | 0.40mi |
Listing history 25 events
-
2026-06-18days on market $163,000 Active 112 DOM
-
2026-06-17days on market $163,000 Active 111 DOM
-
2026-06-16days on market $163,000 Active 110 DOM
-
2026-06-15days on market $163,000 Active 109 DOM
-
2026-06-14days on market $163,000 Active 107 DOM
-
2026-06-13days on market $163,000 Active 106 DOM
-
2026-06-10days on market $163,000 Active 104 DOM
-
2026-06-09days on market $163,000 Active 103 DOM
-
2026-06-08days on market $163,000 Active 102 DOM
-
2026-06-07days on market $163,000 Active 101 DOM
-
2026-06-02days on market $163,000 Active 96 DOM
-
2026-06-01days on market $163,000 Active 95 DOM
-
2026-05-31days on market $163,000 Active 94 DOM
-
2026-05-30days on market $163,000 Active 93 DOM
-
2026-05-17price $163,000 181-char remark
Show marketing remark (181 chars)
Tenant occupied!Sat and Sun 12pm to 2pm onlyProof of funds required24-hour notice to schedule. Great investment property or a perfect starter home. Agent related to sellerSold as-is
-
2026-04-11price $168,000 181-char remark
Show marketing remark (181 chars)
Tenant occupied!Sat and Sun 12pm to 2pm onlyProof of funds required24-hour notice to schedule. Great investment property or a perfect starter home. Agent related to sellerSold as-is
-
2026-02-26$170,000 Active 181-char remark
Show marketing remark (181 chars)
Tenant occupied!Sat and Sun 12pm to 2pm onlyProof of funds required24-hour notice to schedule. Great investment property or a perfect starter home. Agent related to sellerSold as-is
-
2024-09-18price $185,000
-
2024-09-05price $191,000
-
2024-05-16price $198,000
-
2023-03-23soldstatus $35,500
-
2022-10-14soldstatus $35,500 Closed
-
2022-09-09status Pending
-
2022-09-02price $45,000
-
2022-08-26$60,000 Active
ⓘ Source: listings_history table (triggers on properties + properties_extension) + one-shot
backfill from property_details.listing_events for pre-trigger history.
Tax reassessment forecast PA · Partial reset (capped growth)
- Current annual tax
- $1,770 · $148/mo
- Projected year-2 tax
- $2,173 · $181/mo
- Expected delta
- +$403/yr (+$34/mo · 22.7%)
ⓘ Screening estimate from a state-policy table — verify with the county assessor before closing.
Climate risk First Street
- Flood 1/10 Low FEMA zone X (unshaded) · 0% chance over 30 yrs
- Wildfire 3/10 Moderate
- Heat 4/10 Moderate 7 d/yr ≥96°F today · 17 d/yr by 30 yrs out
- Wind 2/10 Low 4% chance of damaging wind over 30 yrs
- Air quality 2/10 Low 0 unhealthy d/yr today · 1 by 30 yrs out
Nearby sold comps map
Loading sold comps map…
Walkable amenities ~0.75 mi
Loading nearby amenities…
Taxation est. · year 1
- Rental income
- $16,534
- − Mortgage interest
- −$9,131
- − Property taxes
- −$1,770
- − Insurance
- −$815
- − Repairs & maintenance
- −$1,323
- − Management
- −$1,323
- − Depreciation
- −$4,742
- Taxable loss
- −$2,569
- Est. tax savings @ 24.0%
- +$617
- After-tax cash flow
- $836/yr
For passive investors: Depreciation is non-cash, so a rental often shows a tax loss while cash-flowing — sheltering income. Rental losses are passive: they offset passive income freely, and up to $25,000/yr can offset ordinary (W-2) income if you actively participate and your MAGI is under $100k (phasing out to $0 by $150k); unused losses carry forward. On sale, claimed depreciation is recaptured at up to 25%, and gains may owe capital-gains tax (a 1031 exchange can defer both). Figures are a year-1 estimate at your 24.0% rate — not tax advice; consult a CPA.
Schools (NCES district)
- District
- Tunkhannock Area SD
- NCES district ID
- 4223850
- Math proficiency
- 29% ▼ -9.00%
- Reading proficiency
- 43% ▼ -18.00%
- Median HH income
- $51,545
- Composite
- 31.27/100
- National rank
- #6022
- State rank
- #397 of 539 in PA
Livability — Tunkhannock
- Score
- 77/100
- State rank
- #371
- US rank
- #3219
Category grades
Schools grade is shown separately in the Schools card above.
Census & demographics
- Census place
- Tunkhannock, PA
- Population (ZIP)
- 11,043
Population outlook (Wyoming County) Hauer SSP2
- Today (2025)
- 26,334 people
- By 2030
- 25,225 · -4.2%
- By 2040
- 22,707 · -13.8%
- By 2050
- 20,250 · -23.1%
- By 2075
- 15,192 · -42.3%
- By 2100
- 10,961 · -58.4%
Race, ethnicity, and origin ACS 2023
- Neighborhood character
- Predominantly White (95%)
- Race & ethnicity
- White 95% Two or more races 3% Hispanic / Latino 2%
- Common ancestry
- Romanian 9% Lithuanian 2% Iranian 2%
- Foreign-born
- 1% · Canada
- Languages at home
- 97% English-only · Spanish 1%
Political lean MEDSL · Wyoming
- 2024 margin
- Solid R (+36.8) · D 31.1% · R 67.9% · Other 1.0%
- 2008→2024 swing
- -29.2pp toward R · 2008: -7.6pp · 2024: -36.8pp
- All cycles
- 2024: R+36.8 2020: R+35.2 2016: R+38.7 2012: R+12.3 2008: R+7.6
Not yet ingested
- Civics
- —
Market trends
- HPI YoY
- ▼ -2.57%
- Current HPI
- 250.1268
- Rent YoY
- —
- Metro
- —
- State GDP YoY
- ▲ 1.68%
- F500 in state
- 34
Industry mix (Fortune 500 HQ in PA)
| Industry | F500 HQs | Revenue |
|---|---|---|
| Healthcare | 2 | $309B |
|
||
| Insurance | 2 | $27B |
|
||
| Telecommunications / Media | 1 | $124B |
|
||
| Industrial Distribution | 1 | $22B |
|
||
| Financial Services | 1 | $20B |
|
||
| Chemicals / Materials | 1 | $18B |
|
||
Price history
+171.7% since first listed11 events — show timeline
- 2026-05-17 Price Changed $163,000 LCAR
- 2026-04-11 Price Changed $168,000 LCAR
- 2026-02-26 Listed $170,000 LCAR
- 2024-09-18 Price Changed $185,000 LCAR
- 2024-09-05 Price Changed $191,000 LCAR
- 2024-05-16 Price Changed $198,000 LCAR
- 2023-03-23 Sold (Public Records) $35,500 Public Records
- 2022-10-14 Sold (MLS) $35,500 GSBR as distributed by MLS GRID
- 2022-09-09 Pending — GSBR as distributed by MLS GRID
- 2022-09-02 Price Changed $45,000 GSBR as distributed by MLS GRID
- 2022-08-26 Listed $60,000 GSBR as distributed by MLS GRID
Property tax history
+1.5%/yrLatest (2025): $1,770 · +0.0% YoY. Source: county tax records.
Cash-flow waterfall
monthlySold comps — $/sqft
last 12 mo · ≤1 miLoading sold comps…