93 Lemans Ct #93 · Lake St. Louis, MO
Flood risk 1/10 · Minimal
- FEMA flood zone
- X (unshaded)
- Chance of flooding over 30 yrs
- 0.0%
- Est. flood insurance / yr
- $507 – $1,088
Fire risk 1/10 · Minimal
- Est. fire insurance / yr
- $1,054 – $1,958
Heat risk 5/10 · Moderate
- Hot days now (above 107°F)
- 7 days/yr
- Hot days in 30 yrs
- 20 days/yr
Wind risk 2/10 · Minimal
- Chance of severe wind over 30 yrs
- 1.0%
Air-quality risk 1/10 · Minimal
- Unhealthy air days now
- 0 days/yr
- Unhealthy air days in 30 yrs
- 0 days/yr
Risk factors via First Street. Map © Google.
Why this score? — see what drove the B- grade
The composite is a weighted blend of 9 inputs, each scored 0–100. Each bar is that input's sub-score; the figure is the points it added to the 100-point composite (weight × sub-score).
- Cash flow +27.4/30.0
- 1% rule +10.0/10.0
- DSCR +9.6/10.0
- ARV discount +7.5/15.0
- Schools +4.3/10.0
- Rent growth +3.6/5.0
- Livability +2.5/5.0
- Condition / age +2.5/5.0
- Appreciation +0.0/10.0
$100,000
🖨 Deal sheet (PDF) 📄 Offer letter ✓ Due diligence
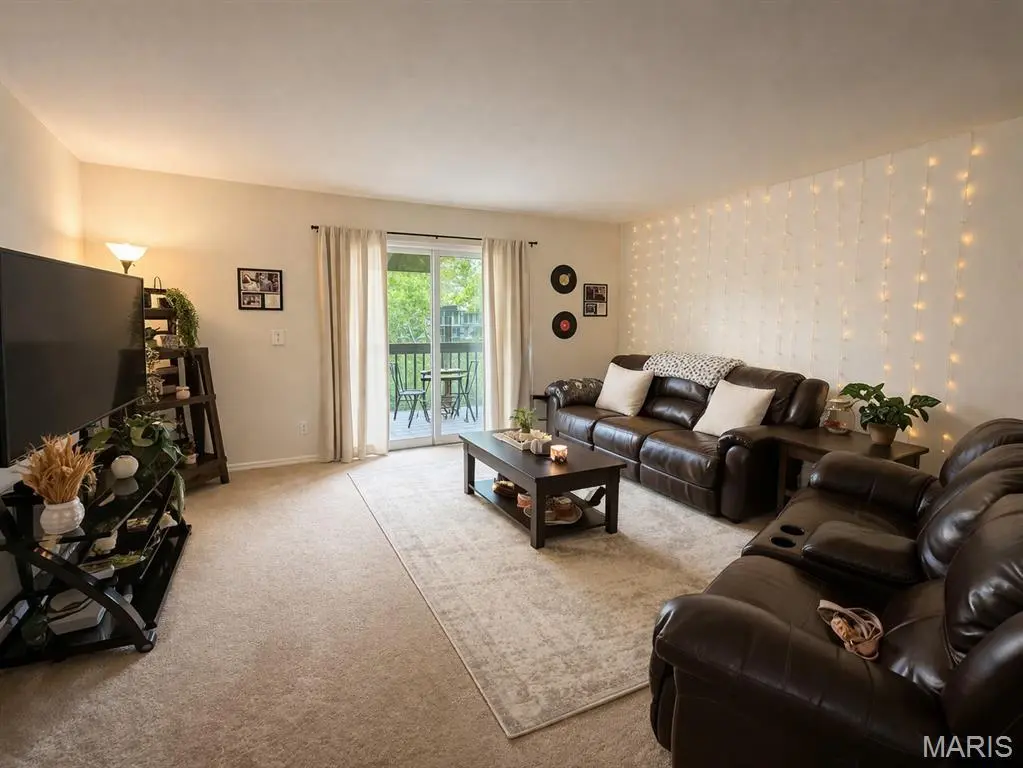
Listing remarks
3 Bed - 2 Bath condo with access to Lake St Louis community amenities. Tenant-occupied with current lease in place through 5/31/2026—ideal for investors seeking immediate rental income or buyers planning ahead. Community amenities include 2 pools, fishing, boating, tennis, golf, sand volleyball, and clubhouse access. Unit features private balcony overlooking the pool. Strong rental history with potential to update and add value. Great opportunity to hold as an investment or renovate in the future. * * Rare opportunity to acquire multiple properties in the same area. Seller owns another nearby unit and is open to selling as a package. Perfect for investors seeking scale and efficienc
Key facts
- $527 HOA
- Community pool
- Built 1970
Property features AI
Finance
- Other: Property above-grade living area reported as 1,152 (source: public records); Pool on the property
- HOA & community: Part of Mystic Village Condominium Association; Monthly HOA fee; HOA amenities include clubhouse, fitness center, pool, tennis courts, playground, dog park, boat dock/slip and boating access, lake access, common grounds, picnic area, laundry, recreation facilities; HOA fee covers clubhouse, grounds maintenance, pool maintenance, pool, recreational facilities, snow removal, and trash
Exterior
- Utilities: Public water; Public sewer; Electric service by Ameren; Natural gas connected; Electricity available
- Home design: Condominium; One-story; Residential property
- Construction: Cedar construction
- Exterior features: Near golf course; Community pool
Interior
- Bedrooms: Three bedrooms, all on the main level
- Bathrooms: Two full bathrooms, both on the main level
- Heating & cooling: Forced air heating; Central air conditioning
- Interior features: Five total rooms
Neighborhood map
What this means for you Summary
Snapshot
- This is a 3-bed/2.0-bath condo listed at $100k.
Deal economics
- At list price, monthly cash flow is $293 ($4k/yr) — positive.
- The deal already cash-flows at list — no discount required.
- Meets the 1% rule at list price ($2k rent vs $100k).
- Recommended offer: $94k (6.0% below list) — sets the bar for market timing.
- Cap rate 9.8% vs local median 3.2% in Lake St. Louis — top-decile yield for the area; either an underpriced asset or a hidden risk that comps aren't pricing in. Stress-test before assuming the spread holds.
Location & tenants
- Location reads: area grade B — affects rentability + tenant quality, not the cash-flow math above.
- Wentzville R-IV (suburban): math 44% / reading 52% proficiency, ranked #32 of 324 in MO (top 10%) — families likely to look elsewhere, expect single-tenant / working-renter base with shorter leases; only 18% free/reduced lunch — higher-income household profile.
- Zoned schools: Lakeview Elementary (math 50% / reading 56%, grade C, #221 of 1,115 statewide, top 20%, 630 students, 12% FRL); Emil E. Holt Sr. High (math 48% / reading 58%, grade C-, #88 of 521 statewide, top 17%, 1,273 students, 12% FRL).
- Market conditions: Rents rising fast (+4.2%/yr); 230 active listings in the ZIP; 3 comparable units currently listed for rent nearby; rentals leasing fast (median 3d on market — plan ~1-2 weeks tenant-placement turnaround); high-income renter base; 2,021 units permitted in St. Charles County in 2024 (568 in 5+ unit buildings).
Forward outlook
- Local home prices are declining (-3.0%/yr); year-one equity from $691 of loan paydown is wiped out by about $3k of value loss. Plan a longer hold.
- St. Charles County population projected at +22% by 2050 — long-run rental-demand tailwind backs the buy-and-hold thesis.
- At projected returns (-3.0% appreciation + 4.2% rent growth), your $28k cash investment doubles in ~8 years — after that, you're playing with house money.
Negotiation context
- It's been on market 79 days — a 6% lower offer ($94k) is reasonable based on typical stale-listing flexibility.
- 2 sale attempts; this cycle's ask has dropped $20k (17%) from the opening price — seller is motivated, your offer sets the floor, not the list.
- Current owner paid $50k; list at $100k implies a 100% gain — meaningful room to come down on a strong offer.
Risks & watch-outs
- Watch-outs: HOA is 27% of rent.
- Climate carrying-cost: extreme-heat days projected 7→20/yr by 2055 (HVAC capex compounding) — expect insurance premiums to compound above CPI over the hold.
Questions for the listing agent
- It's been on market 79 days. Have you received any prior offers? Is the seller open to a 6% concession, seller financing, or rate buy-down credit?
- Built in 1970 — when were the roof, HVAC, electrical panel, plumbing, and water heater last replaced?
- What does the HOA fee cover, when was the last increase, and are there any pending special assessments or reserve-fund shortfalls?
- Any open or pending special assessments — roof, HVAC, plumbing, elevator, façade? What's the per-unit balance and payoff schedule, and is the seller paying it off at close or rolling it to the buyer?
- Why hasn't it sold? Are there any deal-killer items the seller is aware of (foundation, flood, title, zoning, code violations)?
- Is there a deadline driving the sale (1031 exchange, divorce, estate, relocation)? That informs how much negotiation room exists.
- What's the average days-on-market for RENTAL listings here right now (not sales)? A rising rental-DOM trend means longer vacancies and softer asking-rent achievability than the comps imply.
- What's the recent tenant-quality profile in this submarket — average credit score on applications, eviction rate, late-payment / NSF rate, and stable-employment percentage? A property-management company in the area should have these aggregated.
- How much new apartment / multifamily construction is in the pipeline within 1–3 miles? Heavy new supply (>2% of stock underway) typically softens rents 12–24 months out; light construction supports rent growth.
Investment metrics
- 1% rule
- 1.96% ✓
- Cap rate
- 9.81%
- Cash-on-cash
- 12.55%
- DSCR
- 1.56
- GRM
- 4.2
CMA / ARV
No comps found within radius.
Projected returns pro-forma
-3.0% appreciation · 4.21% rent growth · sell at horizon
- IRR
- 4.7%
- Equity multiple
- 1.19×
- Total profit
- $5,242
- Equity at exit
- $14,910
- IRR
- 16.0%
- Equity multiple
- 2.44×
- Total profit
- $40,288
- Equity at exit
- $8,646
Cash invested: $28,000 (down + closing). Projections, not guarantees.
Landlord ↔ Tenant lean methodology
- Overall (STATE)
- 81 Strongly Landlord-Friendly
- State Missouri
- 81 Strongly Landlord-Friendly · R+10
- County
- — inherits STATE
- City
- — inherits STATE
ZIP-level market 63367
- Rents YoY
- 4.2%
- Active inventory
- 230
- Price-to-rent
- 4.2×
Monthly cashflow live
- Estimated rent
- $1,963 medium interval (Pro) →
- Mortgage (P&I)
- −$524
- Tax from tax record
- −$165 /mo · $1,981/yr
- Insurance
- −$42
- HOA
- −$527
- Vacancy / Maint / Mgmt
- −$412
- Net cashflow
- $293
Break-even live
Sensitivity live
| Price | -10% $349 | -5% $321 | +0% $293 | +5% $265 | +10% $236 |
|---|---|---|---|---|---|
| Rent | -10% $138 | -5% $215 | +0% $293 | +5% $370 | +10% $448 |
| Rate | -1.0pp $343 | -0.5pp $318 | base $293 | +0.5pp $267 | +1.0pp $241 |
UW: 25.0% down · 7.5% · 30yr · 1.5% tax · 5.0% vac · 8.0% maint · 8.0% mgmt
Financing live
Cash to close
- Down payment
- $25,000
- Closing costs
- $3,000
- Reserves months
- —
- Total cash needed
- —
Loan-product check · same deal, 3 products live
Conventional
25% down · 7.5% · 30yr
- Down + closing
- —
- Monthly P&I
- —
- Monthly cashflow
- —
- DSCR
- —
- Eligible?
- —
Personal DTI + credit; lowest rate.
DSCR
20% down · 8.5% · 30yr
- Down + closing
- —
- Monthly P&I
- —
- Monthly cashflow
- —
- DSCR
- —
- Eligible?
- —
No personal income docs; deal must DSCR.
Hard money
10% down · 12.0% · 12mo
- Down + closing
- —
- Monthly P&I
- —
- Monthly cashflow
- —
- DSCR
- —
- Eligible?
- —
Short-term bridge; refi at stabilization.
Rent comps 3 comps
| Address | Beds | Baths | Sqft | Rent | $/sqft | DOM | Units | Dist |
|---|---|---|---|---|---|---|---|---|
| 78 Lemans Ct #78 Lake St Louis, MO | 3.0 | 2.0 | 1152 | $1,695 | $1.47 | 3d | 1 | 0.04mi |
| 17 Warsen Ave Wentzville, MO | 3.0 | 1.0 | 864 | $1,875 | $2.17 | 15d | 1 | 1.09mi |
| 1000 Centinnial Club DR O'Fallon, MO | 2.0–3.0 | 2.0–2.5 | 1309 | $2,800 | $2.14 | 3d | 32 | 1.15mi |
HOA detail condo
- Monthly dues
- $527 · $6,324/yr
- Likely covers
- pool
- Assessments
- None detected in remarks — confirm with the listing agent.
Listing history 27 events
-
2026-06-21pricestatusdays on market $100,000 Pending 79 DOM
-
2026-06-18days on market $109,500 Active 78 DOM
-
2026-06-17days on market $109,500 Active 77 DOM
-
2026-06-16days on market $109,500 Active 76 DOM
-
2026-06-15days on market $109,500 Active 75 DOM
-
2026-06-13days on market $109,500 Active 73 DOM
-
2026-06-13pricedays on market $109,500 Active 72 DOM
-
2026-06-09days on market $114,500 Active 69 DOM
-
2026-06-08days on market $114,500 Active 68 DOM
-
2026-06-08days on market $114,500 Active 67 DOM
-
2026-06-05pricedays on market $114,500 Active 64 DOM
-
2026-06-03days on market $120,000 Active 63 DOM
-
2026-06-02days on market $120,000 Active 62 DOM
-
2026-06-01days on market $120,000 Active 61 DOM
-
2026-05-31days on market $120,000 Active 60 DOM
-
2026-05-19status Active
-
2026-04-05historical Active Under Contract
-
2026-04-02$120,000 Active
-
2026-04-01historical $120,000
-
2012-01-10soldstatus $50,000
-
2005-06-15soldstatus $86,000
-
2004-06-23soldstatus
-
2004-06-23soldstatus
-
2002-02-13soldstatus $60,000
-
1997-11-01soldstatus $30,000
-
1988-09-01soldstatus
-
1983-05-01soldstatus $44,000
ⓘ Source: listings_history table (triggers on properties + properties_extension) + one-shot
backfill from property_details.listing_events for pre-trigger history.
Tax reassessment forecast MO · Resets to sale price
- Current annual tax
- $1,981 · $165/mo
- Projected year-2 tax
- $1,981 · $165/mo
- Expected delta
- $0/yr ($0/mo · 0.0%)
ⓘ Screening estimate from a state-policy table — verify with the county assessor before closing.
Climate risk First Street
- Flood 1/10 Low FEMA zone X (unshaded) · 0% chance over 30 yrs
- Wildfire 1/10 Low
- Heat 5/10 Major 7 d/yr ≥107°F today · 20 d/yr by 30 yrs out
- Wind 2/10 Low 100% chance of damaging wind over 30 yrs
- Air quality 1/10 Low 0 unhealthy d/yr today · 0 by 30 yrs out
Nearby sold comps map
Loading sold comps map…
Walkable amenities ~0.75 mi
Loading nearby amenities…
Taxation est. · year 1
- Rental income
- $23,559
- − Mortgage interest
- −$5,602
- − Property taxes
- −$1,981
- − Insurance
- −$500
- − Repairs & maintenance
- −$1,885
- − Management
- −$1,885
- − HOA
- −$6,324
- − Depreciation
- −$2,909
- Taxable income
- $2,474
- Est. tax owed @ 24.0%
- −$594
- After-tax cash flow
- $2,920/yr
For passive investors: Depreciation is non-cash, so a rental often shows a tax loss while cash-flowing — sheltering income. Rental losses are passive: they offset passive income freely, and up to $25,000/yr can offset ordinary (W-2) income if you actively participate and your MAGI is under $100k (phasing out to $0 by $150k); unused losses carry forward. On sale, claimed depreciation is recaptured at up to 25%, and gains may owe capital-gains tax (a 1031 exchange can defer both). Figures are a year-1 estimate at your 24.0% rate — not tax advice; consult a CPA.
Schools (NCES district)
- District
- Wentzville R-IV
- NCES district ID
- 2931650
- Math proficiency
- 44% ▼ -9.00%
- Reading proficiency
- 52% ▼ -7.00%
- Median HH income
- $74,961
- Composite
- 43.49/100
- National rank
- #2994
- State rank
- #32 of 324 in MO
Livability — Lake St. Louis
No livability data for this city. (Only ~50 U.S. cities are tracked.)
Census & demographics
- Census place
- Lake St. Louis, MO
- County
- Saint Charles County · 399,703 people
- City population
- 27,893
- Metro
- St. Louis, MO-IL
- Population (ZIP)
- 29,725
- Household income
- $137,648
- Rent vs Own
- Severe rent burden
- 184.0
Population outlook (St. Charles County) Hauer SSP2
- Today (2025)
- 437,857 people
- By 2030
- 461,707 · +5.4%
- By 2040
- 503,222 · +14.9%
- By 2050
- 534,684 · +22.1%
- By 2075
- 597,047 · +36.4%
- By 2100
- 609,682 · +39.2%
Race, ethnicity, and origin ACS 2023
- Neighborhood character
- Predominantly White (86%)
- Race & ethnicity
- White 86% Two or more races 6% Black 5% Hispanic / Latino 3% Asian 2%
- Common ancestry
- Lithuanian 4% Romanian 4% Italian 3%
- Foreign-born
- 4% · Canada
- Languages at home
- 96% English-only · Spanish 2% Other Indo-European 1%
Political lean MEDSL · St. Charles
- 2024 margin
- R (+17.0) · D 40.8% · R 57.8% · Other 1.4%
- 2008→2024 swing
- -7.2pp toward R · 2008: -9.7pp · 2024: -17.0pp
- All cycles
- 2024: R+17.0 2020: R+17.5 2016: R+26.4 2012: R+21.0 2008: R+9.7
Not yet ingested
- Civics
- —
Market trends
- HPI YoY
- ▼ -165.38%
- Current HPI
- 208.2774
- Rent YoY
- ▲ 4.21%
- Metro
- St. Louis, MO-IL
- State GDP YoY
- ▲ 1.84%
- F500 in state
- 20
Industry mix (Fortune 500 HQ in MO)
| Industry | F500 HQs | Revenue |
|---|---|---|
| Healthcare | 1 | $163B |
|
||
| Insurance | 1 | $21B |
|
||
| Industrial Technology | 1 | $17B |
|
||
| Retail | 1 | $16B |
|
||
| Industrial Distribution | 1 | $10B |
|
||
| Utilities | 1 | $9B |
|
||
Price history
+172.7% since first listed12 events — show timeline
- 2026-05-19 Relisted — MARIS as Distributed by MLS Grid
- 2026-04-05 Contingent — MARIS as Distributed by MLS Grid
- 2026-04-02 Listed $120,000 MARIS as Distributed by MLS Grid
- 2026-04-01 Coming Soon $120,000 MARIS as Distributed by MLS Grid
- 2012-01-10 Sold (Public Records) $50,000 Public Records
- 2005-06-15 Sold (Public Records) $86,000 Public Records
- 2004-06-23 Sold (Public Records) — Public Records
- 2004-06-23 Sold (Public Records) — Public Records
- 2002-02-13 Sold (Public Records) $60,000 Public Records
- 1997-11-01 Sold (Public Records) $30,000 Public Records
- 1988-09-01 Sold (Public Records) — Public Records
- 1983-05-01 Sold (Public Records) $44,000 Public Records
Property tax history
+8.5%/yrLatest (2025): $1,981 · +23.3% YoY. Source: county tax records.
Cash-flow waterfall
monthlySold comps — $/sqft
last 12 mo · ≤1 miLoading sold comps…