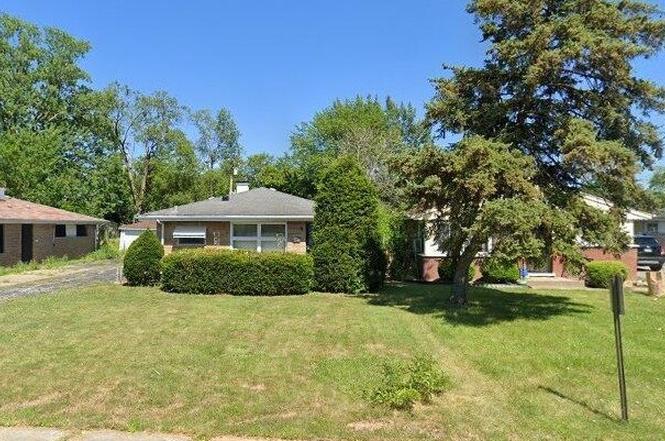
16131 Hermitage Ave · Markham, IL
Flood risk 4/10 · Minor
- FEMA flood zone
- X (shaded)
- Chance of flooding over 30 yrs
- 0.2%
- Est. flood insurance / yr
- $473 – $860
Fire risk 1/10 · Minimal
- Est. fire insurance / yr
- $804 – $1,492
Heat risk 3/10 · Minor
- Hot days now (above 102°F)
- 7 days/yr
- Hot days in 30 yrs
- 15 days/yr
Wind risk 2/10 · Minimal
- Chance of severe wind over 30 yrs
- —
Air-quality risk 3/10 · Minor
- Unhealthy air days now
- 4 days/yr
- Unhealthy air days in 30 yrs
- 4 days/yr
Risk factors via First Street. Map © Google.
Why this score? — see what drove the B- grade
The composite is a weighted blend of 9 inputs, each scored 0–100. Each bar is that input's sub-score; the figure is the points it added to the 100-point composite (weight × sub-score).
- Cash flow +29.0/30.0
- DSCR +10.0/10.0
- Appreciation +10.0/10.0
- 1% rule +9.6/10.0
- Livability +3.8/5.0
- Rent growth +2.5/5.0
- Condition / age +2.5/5.0
- Schools +0.7/10.0
- ARV discount +0.5/15.0
$159,900
🖨 Deal sheet 📄 Offer letter ✓ Due diligence
Listing remarks
* * AS-IS * * Great opportunity for investors or first-time homeowners! This solid 3-bed, 2-bath residence offers a functional layout with a spacious living room. Some updates have been completed, though the owner was unable to finish the project. The added addition expands the living space and features an attached oversized garage. The property offers strong potential for an eager buyer. Located in Markham, this home is conveniently close to parks, schools, shopping, and major expressways - perfect for daily living and easy commuting.
Key facts
- Spacious living room
- 5,808 sq ft lot
- 2 garage spots
Tags
Property features AI
Finance
- Other: Parcel number 29192180390000
- HOA & community: No master association fee required
Exterior
- Parking: Attached garage (2-car capacity); 2 total parking spaces
- Utilities: Lake Michigan water source; Public sewer
- Home design: Detached single-family home; One-story; Fee simple ownership
- Construction: Brick construction; Built 61–70 years ago; Property built before 1978
- Exterior features: Lot approx. 48 x 121; Less than 0.25 acre lot; School bus, commuter bus, commuter train access, and nearby interstate access
Interior
- Kitchen: Kitchen on the main level (approx. 16 x 9)
- Bedrooms: 3 bedrooms (all on the main level); Master bedroom on the main level (approx. 13 x 10); Second bedroom on the main level (approx. 10 x 12); Third bedroom on the main level (approx. 10 x 10)
- Bathrooms: 2 full bathrooms
- Heating & cooling: Natural gas heating; Central air conditioning
- Interior features: 7 total rooms; Crawl space basement
- Laundry & utility: Laundry room on the main level (approx. 10 x 5)
Neighborhood map
What this means for you Summary
Snapshot
- This is a 3-bed/1.5-bath single-family listed at $160k.
Deal economics
- At list price, monthly cash flow is $547 ($7k/yr) — positive.
- The deal already cash-flows at list — no discount required.
- Meets the 1% rule at list price ($2k rent vs $160k).
- Recommended offer: $141k (12.0% below list) — sets the bar for market timing.
Location & tenants
- Location reads 76/100 on livability (#186 in IL, #3,539 nationally) — a middle-class / working-renter tenant base. Strengths: commute A+, cost of living A+, housing A+; Watch: crime D, amenities D, employment D.
- Thornton Twp Hsd 205 (suburban): math 7% / reading 8% proficiency, ranked #594 of 620 in IL (top 96%) — low school quality limits family demand, transient renter base, plan for 1-2y turnover.
- Market conditions: 65 active listings in the ZIP; 8 comparable units currently listed for rent nearby; rentals leasing fast (median 1d on market — plan ~1-2 weeks tenant-placement turnaround); 6,272 units permitted in Cook County in 2024 (4,658 in 5+ unit buildings).
Forward outlook
- In year one you build about $17k of equity ($1k loan paydown + $16k appreciation (10.0% local appreciation)).
- At projected returns (10.0% appreciation + 3.0% rent growth), your $45k cash investment doubles in ~2 years — after that, you're playing with house money.
- By year 3, paydown + projected appreciation supports a ~$43k cash-out refi (75% LTV) — recoverable capital for the next deal without selling this one.
Negotiation context
- It's been on market 142 days — a 12% lower offer ($141k) is reasonable based on typical stale-listing flexibility.
Risks & watch-outs
- Watch-outs: property tax is 2.9% of price; built in 1956 — expect roof / HVAC / electrical / plumbing capex.
Questions for the listing agent
- It's been on market 142 days. Have you received any prior offers? Is the seller open to a 12% concession, seller financing, or rate buy-down credit?
- Built in 1956 — when were the roof, HVAC, electrical panel, plumbing, and water heater last replaced?
- Property tax is high relative to price — has the assessment been appealed recently, and will the sale trigger a re-assessment?
- Why hasn't it sold? Are there any deal-killer items the seller is aware of (foundation, flood, title, zoning, code violations)?
- Is there a deadline driving the sale (1031 exchange, divorce, estate, relocation)? That informs how much negotiation room exists.
- Schools are F-rated, which usually means shorter tenancies and higher turnover. Who's the typical renter profile here, and what's been the actual vacancy rate?
- Crime grade is D in this area — have there been break-ins, vandalism, or insurance claims at this property in the last 3 years? What carrier currently insures it and at what premium?
- What's the average days-on-market for RENTAL listings here right now (not sales)? A rising rental-DOM trend means longer vacancies and softer asking-rent achievability than the comps imply.
- What's the recent tenant-quality profile in this submarket — average credit score on applications, eviction rate, late-payment / NSF rate, and stable-employment percentage? A property-management company in the area should have these aggregated.
- How much new for-sale + rental construction is in the pipeline within 1–3 miles? Heavy new supply typically softens prices + rents 12–24 months out; constrained supply supports both.
Investment metrics
- 1% rule
- 1.46% ✓
- Cap rate
- 10.40%
- Cash-on-cash
- 14.66%
- DSCR
- 1.65
- GRM
- 5.7
CMA / ARV
- ARV (on-the-fly)
- $138,288
- Comps found
- 12
Show comp detail 12 sales within ~0.75 mi
| Address | Dist | Beds/Ba | Sqft | Sold | Price | $/sf | Match |
|---|---|---|---|---|---|---|---|
| 16221 Hermitage Ave | 0.10mi | 3/1.5 | 1,044 (+1%) | 1mo | $192,000 | $184 | 93 |
| 16300 Winchester Ave | 0.35mi | 3/1.0 | 1,012 (-2%) | 2mo | $97,500 | $96 | 77 |
| 16019 Myrtle Ave | 0.39mi | 3/1.0 | 1,008 (-2%) | 3mo | $70,000 | $69 | 74 |
| 16328 Winchester Ave | 0.38mi | 3/1.0 | 1,011 (-2%) | 6mo | $135,000 | $134 | 72 |
| 16444 Wolcott Ave | 0.46mi | 3/1.5 | 1,080 (+5%) | 3mo | $112,500 | $104 | 68 |
| 16207 Justine St | 0.26mi | 4/2.0 (+1) | 1,100 (+7%) | 3mo | $215,000 | $195 | 68 |
| 16607 Winchester Ave | 0.63mi | 3/2.0 | 1,053 (+2%) | 5mo | $226,000 | $215 | 61 |
| 106 W 157th St | 0.57mi | 4/1.0 (+1) | 1,012 (-2%) | 4mo | $145,500 | $144 | 59 |
| 16610 Paulina St | 0.59mi | 3/1.5 | 1,087 (+5%) | 6mo | $93,000 | $86 | 59 |
| 15537 Ashland Ave | 0.74mi | 2/1.0 (-1) | 1,091 (+6%) | 3mo | $70,000 | $64 | 46 |
| 16628 Winchester Ave | 0.69mi | 2/1.0 (-1) | 1,134 (+10%) | 1mo | $84,000 | $74 | 44 |
| 16619 Marshfield Ave | 0.61mi | 4/2.0 (+1) | 1,150 (+11%) | 4mo | $240,000 | $209 | 42 |
Match score weights: distance 35% · size 25% · config 20% · recency 20%. Top-matched comps best support the ARV.
Projected returns pro-forma
10.0% appreciation · 3.0% rent growth · sell at horizon
- IRR
- 35.1%
- Equity multiple
- 3.73×
- Total profit
- $122,081
- Equity at exit
- $144,051
- IRR
- 30.3%
- Equity multiple
- 8.42×
- Total profit
- $332,404
- Equity at exit
- $310,651
Cash invested: $44,772 (down + closing). Projections, not guarantees.
Landlord ↔ Tenant lean methodology
- Overall (STATE)
- 43 Moderately Tenant-Leaning
- State Illinois
- 43 Moderately Tenant-Leaning · D+7
- County
- — inherits STATE
- City
- — inherits STATE
ZIP-level market 60428
- Home prices YoY
- 8.5%
- Active inventory
- 65
- Price-to-rent
- 5.7×
Monthly cashflow live
- Estimated rent
- $2,327 high interval (Pro) →
- Mortgage (P&I)
- −$839
- Tax from tax record
- −$386 /mo · $4,634/yr
- Insurance
- −$67
- HOA
- −$0
- Vacancy / Maint / Mgmt
- −$489
- Net cashflow
- $547
Break-even live
UW: 25.0% down · 7.5% · 30yr · 1.5% tax · 5.0% vac · 8.0% maint · 8.0% mgmt
Financing live
Cash to close
- Down payment
- $39,975
- Closing costs
- $4,797
- Reserves months
- —
- Total cash needed
- —
Loan-product check · same deal, 3 products live
Conventional
25% down · 7.5% · 30yr
- Down + closing
- —
- Monthly P&I
- —
- Monthly cashflow
- —
- DSCR
- —
- Eligible?
- —
Personal DTI + credit; lowest rate.
DSCR
20% down · 8.5% · 30yr
- Down + closing
- —
- Monthly P&I
- —
- Monthly cashflow
- —
- DSCR
- —
- Eligible?
- —
No personal income docs; deal must DSCR.
Hard money
10% down · 12.0% · 12mo
- Down + closing
- —
- Monthly P&I
- —
- Monthly cashflow
- —
- DSCR
- —
- Eligible?
- —
Short-term bridge; refi at stabilization.
Rent comps 8 comps
| Address | Beds | Baths | Sqft | Rent | $/sqft | DOM | Units | Dist |
|---|---|---|---|---|---|---|---|---|
| 16125 Marshfield Ave Markham, IL | 3.0 | 1.0 | 1043 | $2,400 | $2.30 | 1d | 1 | 0.12mi |
| 16751 Crane Ave Hazel Crest, IL | 3.0 | 1.0 | 1200 | $1,800 | $1.50 | 1d | 1 | 0.98mi |
| 16048 Halsted St Unit 2 Harvey, IL | 3.0 | 1.0 | 1091 | $1,650 | $1.51 | 24d | 1 | 1.16mi |
| 16752 Artesian Ave Hazel Crest, IL | 3.0 | 1.0 | 867 | $2,500 | $2.88 | 1d | 1 | 1.17mi |
| 16901 Orchard Ridge Ave Hazel Crest, IL | 4.0 | 2.0 | 1406 | $2,700 | $1.92 | 1d | 1 | 1.20mi |
| 2308 170th St Hazel Crest, IL | 3.0 | 2.0 | 1020 | $2,400 | $2.35 | 1d | 1 | 1.27mi |
| 2107 171st St Unit 2107 Hazel Crest, IL | 3.0 | 1.5 | 1158 | $2,300 | $1.99 | 1d | 1 | 1.28mi |
| 2173 171st St Hazel Crest, IL | 3.0 | 1.5 | 1159 | $2,350 | $2.03 | 1d | 1 | 1.32mi |
Listing history 18 events
-
2026-06-18days on market $159,900 Active 142 DOM
-
2026-06-17days on market $159,900 Active 141 DOM
-
2026-06-16days on market $159,900 Active 140 DOM
-
2026-06-15days on market $159,900 Active 139 DOM
-
2026-06-13days on market $159,900 Active 137 DOM
-
2026-06-13days on market $159,900 Active 136 DOM
-
2026-06-09days on market $159,900 Active 133 DOM
-
2026-06-08days on market $159,900 Active 132 DOM
-
2026-06-07days on market $159,900 Active 131 DOM
-
2026-06-04days on market $159,900 Active 128 DOM
-
2026-06-03days on market $159,900 Active 127 DOM
-
2026-06-02days on market $159,900 Active 126 DOM
-
2026-06-01days on market $159,900 Active 125 DOM
-
2026-05-31days on market $159,900 Active 124 DOM
-
2026-04-25price $159,900
-
2026-01-27$169,000 Active
-
1998-12-02soldstatus $238,500
-
1992-01-30soldstatus $53,000
ⓘ Source: listings_history table (triggers on properties + properties_extension) + one-shot
backfill from property_details.listing_events for pre-trigger history.
Tax reassessment forecast IL · Partial reset (capped growth)
- Current annual tax
- $4,634 · $386/mo
- Projected year-2 tax
- $4,634 · $386/mo
- Expected delta
- $0/yr ($0/mo · 0.0%)
ⓘ Screening estimate from a state-policy table — verify with the county assessor before closing.
Climate risk First Street
- Flood 4/10 Moderate FEMA zone X (shaded) · 20% chance over 30 yrs
- Wildfire 1/10 Low
- Heat 3/10 Moderate 7 d/yr ≥102°F today · 15 d/yr by 30 yrs out
- Wind 2/10 Low
- Air quality 3/10 Moderate 4 unhealthy d/yr today · 4 by 30 yrs out
Nearby sold comps map
Loading sold comps map…
Walkable amenities ~0.75 mi
Loading nearby amenities…
Taxation est. · year 1
- Rental income
- $27,926
- − Mortgage interest
- −$8,957
- − Property taxes
- −$4,634
- − Insurance
- −$800
- − Repairs & maintenance
- −$2,234
- − Management
- −$2,234
- − Depreciation
- −$4,652
- Taxable income
- $4,415
- Est. tax owed @ 24.0%
- −$1,060
- After-tax cash flow
- $5,506/yr
For passive investors: Depreciation is non-cash, so a rental often shows a tax loss while cash-flowing — sheltering income. Rental losses are passive: they offset passive income freely, and up to $25,000/yr can offset ordinary (W-2) income if you actively participate and your MAGI is under $100k (phasing out to $0 by $150k); unused losses carry forward. On sale, claimed depreciation is recaptured at up to 25%, and gains may owe capital-gains tax (a 1031 exchange can defer both). Figures are a year-1 estimate at your 24.0% rate — not tax advice; consult a CPA.
Schools (NCES district)
- District
- Thornton Twp Hsd 205
- NCES district ID
- 1738970
- Math proficiency
- 7% ▬ 0.00%
- Reading proficiency
- 8% ▼ -2.00%
- Median HH income
- $43,392
- Composite
- 6.92/100
- National rank
- #9976
- State rank
- #594 of 620 in IL
Livability — Markham
- Score
- 76/100
- State rank
- #186
- US rank
- #3539
Category grades
Schools grade is shown separately in the Schools card above.
Census & demographics
- Census place
- Markham, IL
- City population
- 10,980
- Population (ZIP)
- 10,980
Population outlook (Cook County) Hauer SSP2
- Today (2025)
- 5,347,519 people
- By 2030
- 5,357,703 · +0.2%
- By 2040
- 5,324,924 · -0.4%
- By 2050
- 5,230,762 · -2.2%
- By 2075
- 4,785,735 · -10.5%
- By 2100
- 4,188,836 · -21.7%
Race, ethnicity, and origin ACS 2023
- Neighborhood character
- Predominantly Black (69%)
- Race & ethnicity
- Black 69% Hispanic / Latino 17% White 11% Two or more races 4%
- Hispanic origin (detail)
- Mexican 16%
- Common ancestry
- Romanian 1% Lithuanian 1% Iranian 1%
- Foreign-born
- 8% · Canada
- Languages at home
- 86% English-only · Spanish 14%
Political lean MEDSL · Cook
- 2024 margin
- Solid D (+42.0) · D 70.4% · R 28.4% · Other 1.2%
- 2008→2024 swing
- -11.4pp toward R · 2008: 53.4pp · 2024: 42.0pp
- All cycles
- 2024: D+42.0 2020: D+50.3 2016: D+53.0 2012: D+49.4 2008: D+53.4
Not yet ingested
- Civics
- —
Market trends
- HPI YoY
- ▲ 23.63%
- Current HPI
- 302.333
- Rent YoY
- —
- Metro
- —
- State GDP YoY
- ▲ 1.59%
- F500 in state
- 60
Industry mix (Fortune 500 HQ in IL)
| Industry | F500 HQs | Revenue |
|---|---|---|
| Insurance | 4 | $201B |
|
||
| Consumer Goods | 4 | $87B |
|
||
| Industrial Machinery | 3 | $64B |
|
||
| Healthcare | 2 | $55B |
|
||
| Retail / Pharmacy | 1 | $148B |
|
||
| Agriculture / Food | 1 | $86B |
|
||
Price history
+201.7% since first listed4 events — show timeline
- 2026-04-25 Price Changed $159,900 MRED as Distributed by MLS Grid
- 2026-01-27 Listed $169,000 MRED as Distributed by MLS Grid
- 1998-12-02 Sold (Public Records) $238,500 Public Records
- 1992-01-30 Sold (Public Records) $53,000 Public Records
Cash-flow waterfall
monthlySold comps — $/sqft
last 12 mo · ≤1 miLoading sold comps…