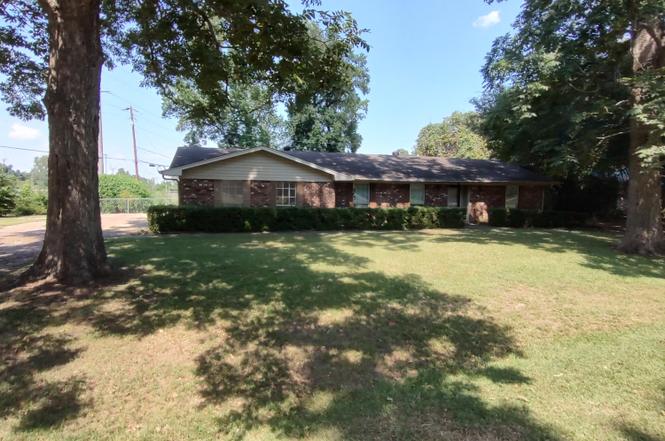
203 Lynwood Dr · Ferriday, LA
Flood risk 1/10 · Minimal
- FEMA flood zone
- X
- Chance of flooding over 30 yrs
- 0.0%
- Est. flood insurance / yr
- $507 – $1,088
Fire risk 1/10 · Minimal
- Est. fire insurance / yr
- $1,269 – $2,357
Heat risk 8/10 · Major
- Hot days now (above 109°F)
- 7 days/yr
- Hot days in 30 yrs
- 19 days/yr
Wind risk 8/10 · Major
- Chance of severe wind over 30 yrs
- 80.0%
Air-quality risk 1/10 · Minimal
- Unhealthy air days now
- 0 days/yr
- Unhealthy air days in 30 yrs
- 0 days/yr
Risk factors via First Street. Map © Google.
Why this score? — see what drove the B- grade
The composite is a weighted blend of 9 inputs, each scored 0–100. Each bar is that input's sub-score; the figure is the points it added to the 100-point composite (weight × sub-score).
- Cash flow +27.7/30.0
- DSCR +9.8/10.0
- Appreciation +7.9/10.0
- ARV discount +7.5/15.0
- 1% rule +6.9/10.0
- Livability +3.1/5.0
- Rent growth +2.5/5.0
- Condition / age +2.5/5.0
- Schools +1.8/10.0
$100,000
🖨 Deal sheet (PDF) 📄 Offer letter ✓ Due diligence
Listing remarks
NEWLY RENOVATED as of May 2026!!! Three Bedroom/Two Bathroom home in a well established neighborhood, sits on a large level lot with a fenced in backyard, and is within walking distance of Delta Charter School. It comes with a two car garage, and the driveway has plenty of room for additional parking. BRAND NEW LINOLEUM FLOORING IN KITCHEN AND DEN AND FRESH PAINTED INTERIOR WALLS THROUGHOUT THE HOUSE! The back patio is covered, and there is a storage shed in the backyard. The unfinished bonus room has great potential. This house is PRICED TO SELL and will be SOLD AS IS. All measurements are estimated. Buyer is encouraged to measure.
Key facts
- Fenced in backyard
- 0.55 acre lot
- 2 garage spots
Tags
Property features AI
Exterior
- Parking: 2-car garage; 2-car carport; Driveway; Garage faces side; Concrete parking surface; Total parking for 4 vehicles
- Utilities: Public water; Public sewer; Electricity connected; Sewer connected; Water connected
- Home design: Single-family house; One level
- Construction: Vinyl and brick exterior; Slab foundation; Built by owner (year built source: owner)
- Exterior features: Shingle roof; Rain gutters; Chain link fence with fenced backyard; Level lot; Shed(s)
Interior
- Kitchen: Dishwasher; Oven; Refrigerator; Electric water heater
- Bathrooms: 2 bathrooms (1 full)
- Heating & cooling: Central heating (natural gas); Central air conditioning; Ceiling fans for cooling
- Interior features: Ceiling fans; Built-in storage
- Laundry & utility: Dedicated laundry room
Neighborhood map
What this means for you Summary
Snapshot
- This is a 3-bed/2.0-bath single-family listed at $100k.
Deal economics
- At list price, monthly cash flow is $303 ($4k/yr) — positive.
- The deal already cash-flows at list — no discount required.
- Meets the 1% rule at list price ($1k rent vs $100k).
- Recommended offer: $88k (12.0% below list) — sets the bar for market timing.
Location & tenants
- Location reads 62/100 on livability (#215 in LA) — a middle-class / working-renter tenant base. Strengths: cost of living A+, housing A-; Watch: health & safety C-, schools D+, crime D+.
- Concordia Parish (town): math 19% / reading 27% proficiency, ranked #65 of 98 in LA (top 66%) — low school quality limits family demand, transient renter base, plan for 1-2y turnover; 74% free/reduced lunch — lower-income household profile, screen leases tightly.
- Market conditions: 43 active listings in the ZIP; 27 units permitted in Concordia Parish in 2024 (0 in 5+ unit buildings).
Forward outlook
- In year one you build about $7k of equity ($691 loan paydown + $6k appreciation (5.8% local appreciation)).
- Concordia County population projected at -20% by 2050 — secular population decline; favor cash flow + early exit over multi-decade hold.
- At projected returns (5.8% appreciation + 3.0% rent growth), your $28k cash investment doubles in ~3 years — after that, you're playing with house money.
- By year 6, paydown + projected appreciation supports a ~$35k cash-out refi (75% LTV) — recoverable capital for the next deal without selling this one.
Negotiation context
- It's been on market 239 days — a 12% lower offer ($88k) is reasonable based on typical stale-listing flexibility.
- 2 sale attempts with the ask held roughly flat each time — persistent listings suggest the price (not the market) is what's stuck; bring a comps-based counter.
- Current owner paid $60k; list at $100k implies a 67% gain — meaningful room to come down on a strong offer.
Risks & watch-outs
- Climate carrying-cost: severe wind risk, 80% chance of damaging wind over 30y; extreme-heat days projected 7→19/yr by 2055 (HVAC capex compounding) — expect insurance premiums to compound above CPI over the hold.
Questions for the listing agent
- It's been on market 239 days. Have you received any prior offers? Is the seller open to a 12% concession, seller financing, or rate buy-down credit?
- Built in 1975 — when were the roof, HVAC, electrical panel, plumbing, and water heater last replaced?
- Why hasn't it sold? Are there any deal-killer items the seller is aware of (foundation, flood, title, zoning, code violations)?
- Is there a deadline driving the sale (1031 exchange, divorce, estate, relocation)? That informs how much negotiation room exists.
- Schools are D-rated, which usually means shorter tenancies and higher turnover. Who's the typical renter profile here, and what's been the actual vacancy rate?
- Crime grade is D in this area — have there been break-ins, vandalism, or insurance claims at this property in the last 3 years? What carrier currently insures it and at what premium?
- What's the average days-on-market for RENTAL listings here right now (not sales)? A rising rental-DOM trend means longer vacancies and softer asking-rent achievability than the comps imply.
- What's the recent tenant-quality profile in this submarket — average credit score on applications, eviction rate, late-payment / NSF rate, and stable-employment percentage? A property-management company in the area should have these aggregated.
- How much new for-sale + rental construction is in the pipeline within 1–3 miles? Heavy new supply typically softens prices + rents 12–24 months out; constrained supply supports both.
Investment metrics
- 1% rule
- 1.19% ✓
- Cap rate
- 9.93%
- Cash-on-cash
- 12.98%
- DSCR
- 1.58
- GRM
- 7.0
CMA / ARV
No comps found within radius.
Projected returns pro-forma
5.84% appreciation · 3.0% rent growth · sell at horizon
- IRR
- 25.8%
- Equity multiple
- 2.69×
- Total profit
- $47,182
- Equity at exit
- $61,846
- IRR
- 24.3%
- Equity multiple
- 5.43×
- Total profit
- $123,911
- Equity at exit
- $111,287
Cash invested: $28,000 (down + closing). Projections, not guarantees.
Landlord ↔ Tenant lean methodology
- Overall (STATE)
- 90 Strongly Landlord-Friendly
- State Louisiana
- 90 Strongly Landlord-Friendly · R+12
- County
- — inherits STATE
- City
- — inherits STATE
ZIP-level market 71334
- Home prices YoY
- 5.7%
- Active inventory
- 43
- Price-to-rent
- 7.0×
Monthly cashflow live
- Estimated rent
- $1,187 medium interval (Pro) →
- Mortgage (P&I)
- −$524
- Tax from tax record
- −$69 /mo · $823/yr
- Insurance
- −$42
- HOA
- −$0
- Vacancy / Maint / Mgmt
- −$249
- Net cashflow
- $303
Break-even live
Sensitivity live
| Price | -10% $359 | -5% $331 | +0% $303 | +5% $274 | +10% $246 |
|---|---|---|---|---|---|
| Rent | -10% $209 | -5% $256 | +0% $303 | +5% $350 | +10% $397 |
| Rate | -1.0pp $353 | -0.5pp $328 | base $303 | +0.5pp $277 | +1.0pp $250 |
UW: 25.0% down · 7.5% · 30yr · 1.5% tax · 5.0% vac · 8.0% maint · 8.0% mgmt
Financing live
Cash to close
- Down payment
- $25,000
- Closing costs
- $3,000
- Reserves months
- —
- Total cash needed
- —
Loan-product check · same deal, 3 products live
Conventional
25% down · 7.5% · 30yr
- Down + closing
- —
- Monthly P&I
- —
- Monthly cashflow
- —
- DSCR
- —
- Eligible?
- —
Personal DTI + credit; lowest rate.
DSCR
20% down · 8.5% · 30yr
- Down + closing
- —
- Monthly P&I
- —
- Monthly cashflow
- —
- DSCR
- —
- Eligible?
- —
No personal income docs; deal must DSCR.
Hard money
10% down · 12.0% · 12mo
- Down + closing
- —
- Monthly P&I
- —
- Monthly cashflow
- —
- DSCR
- —
- Eligible?
- —
Short-term bridge; refi at stabilization.
Listing history 23 events
-
2026-06-21days on market $100,000 Active 239 DOM
-
2026-06-21days on market $100,000 Active 238 DOM
-
2026-06-18days on market $100,000 Active 236 DOM
-
2026-06-17days on market $100,000 Active 235 DOM
-
2026-06-16days on market $100,000 Active 234 DOM
-
2026-06-15days on market $100,000 Active 233 DOM
-
2026-06-13days on market $100,000 Active 231 DOM
-
2026-06-12days on market $100,000 Active 230 DOM
-
2026-06-09days on market $100,000 Active 227 DOM
-
2026-06-08days on market $100,000 Active 226 DOM
-
2026-06-07days on market $100,000 Active 225 DOM
-
2026-06-07days on market $100,000 Active 224 DOM
-
2026-06-04days on market $100,000 Active 221 DOM
-
2026-06-02days on market $100,000 Active 220 DOM
-
2026-06-01days on market $100,000 Active 219 DOM
-
2026-05-31days on market $100,000 Active 218 DOM
-
2026-05-31days on market $100,000 Active 217 DOM
-
2026-05-20status Active
-
2026-05-20price $100,000
-
2026-04-07status Pending
-
2026-03-26price $95,000
-
2025-09-13$100,000 Active
-
2007-10-15soldstatus $60,000
ⓘ Source: listings_history table (triggers on properties + properties_extension) + one-shot
backfill from property_details.listing_events for pre-trigger history.
Tax reassessment forecast LA · Resets to sale price
- Current annual tax
- $823 · $69/mo
- Projected year-2 tax
- $823 · $69/mo
- Expected delta
- $0/yr ($0/mo · -0.0%)
ⓘ Screening estimate from a state-policy table — verify with the county assessor before closing.
Climate risk First Street
- Flood 1/10 Low FEMA zone X · 0% chance over 30 yrs
- Wildfire 1/10 Low
- Heat 8/10 Severe 7 d/yr ≥109°F today · 19 d/yr by 30 yrs out
- Wind 8/10 Severe 80% chance of damaging wind over 30 yrs
- Air quality 1/10 Low 0 unhealthy d/yr today · 0 by 30 yrs out
Nearby sold comps map
Loading sold comps map…
Walkable amenities ~0.75 mi
Loading nearby amenities…
Taxation est. · year 1
- Rental income
- $14,240
- − Mortgage interest
- −$5,602
- − Property taxes
- −$823
- − Insurance
- −$500
- − Repairs & maintenance
- −$1,139
- − Management
- −$1,139
- − Depreciation
- −$2,909
- Taxable income
- $2,127
- Est. tax owed @ 24.0%
- −$511
- After-tax cash flow
- $3,123/yr
For passive investors: Depreciation is non-cash, so a rental often shows a tax loss while cash-flowing — sheltering income. Rental losses are passive: they offset passive income freely, and up to $25,000/yr can offset ordinary (W-2) income if you actively participate and your MAGI is under $100k (phasing out to $0 by $150k); unused losses carry forward. On sale, claimed depreciation is recaptured at up to 25%, and gains may owe capital-gains tax (a 1031 exchange can defer both). Figures are a year-1 estimate at your 24.0% rate — not tax advice; consult a CPA.
Schools (NCES district)
- District
- Concordia Parish
- NCES district ID
- 2200480
- Math proficiency
- 19% ▼ -39.00%
- Reading proficiency
- 27% ▼ -34.00%
- Median HH income
- $29,931
- Composite
- 18.45/100
- National rank
- #8929
- State rank
- #65 of 98 in LA
Livability — Ferriday
- Score
- 62/100
- State rank
- #215
- US rank
- #16581
Category grades
Schools grade is shown separately in the Schools card above.
Census & demographics
- Census place
- Ferriday, LA
- Population (ZIP)
- 9,382
Population outlook (Concordia County) Hauer SSP2
- Today (2025)
- 18,933 people
- By 2030
- 18,157 · -4.1%
- By 2040
- 16,559 · -12.5%
- By 2050
- 15,067 · -20.4%
- By 2075
- 11,770 · -37.8%
- By 2100
- 8,541 · -54.9%
Race, ethnicity, and origin ACS 2023
- Neighborhood character
- Diverse neighborhood (Simpson 0.55)
- Race & ethnicity
- Black 54% White 40% Hispanic / Latino 3% Two or more races 3%
- Common ancestry
- Lithuanian 2% Iranian 1% Slovak 1%
- Foreign-born
- 4% · Canada
- Languages at home
- 95% English-only · Spanish 3% Other Indo-European 1%
Political lean MEDSL · Concordia
- 2024 margin
- Strong R (+29.4) · D 34.8% · R 64.1% · Other 1.1%
- 2008→2024 swing
- -9.4pp toward R · 2008: -20.0pp · 2024: -29.4pp
- All cycles
- 2024: R+29.4 2020: R+26.9 2016: R+24.8 2012: R+17.2 2008: R+20.0
Not yet ingested
- Civics
- —
Market trends
- HPI YoY
- ▲ 5.84%
- Current HPI
- 108.4427
- Rent YoY
- —
- Metro
- —
- State GDP YoY
- ▲ 3.29%
- F500 in state
- 10
Industry mix (Fortune 500 HQ in LA)
| Industry | F500 HQs | Revenue |
|---|---|---|
| Telecommunications | 2 | $23B |
|
||
| Utilities | 1 | $12B |
|
||
| Wholesale / Distribution | 1 | $5B |
|
||
| Advertising | 1 | $2B |
|
||
Price history
+66.7% since first listed6 events — show timeline
- 2026-05-20 Relisted — MLSU
- 2026-05-20 Price Changed $100,000 MLSU
- 2026-04-07 Pending — MLSU
- 2026-03-26 Price Changed $95,000 MLSU
- 2025-09-13 Listed $100,000 MLSU
- 2007-10-15 Sold (Public Records) $60,000 Public Records
Property tax history
-0.1%/yrLatest (2025): $823 · +22.2% YoY. Source: county tax records.
Cash-flow waterfall
monthlySold comps — $/sqft
last 12 mo · ≤1 miLoading sold comps…