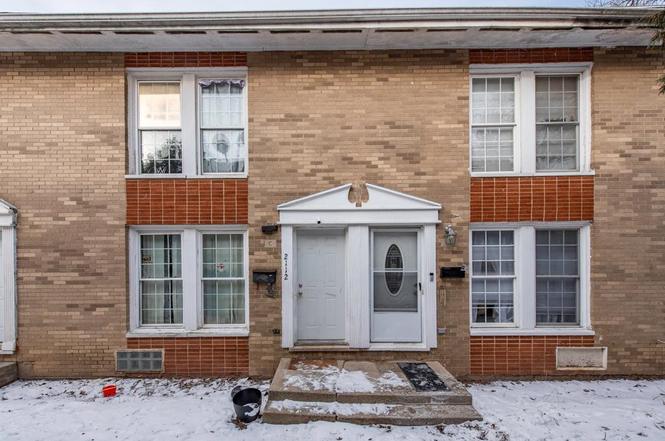
2112 Hebron Ave · Zion, IL
Flood risk 1/10 · Minimal
- FEMA flood zone
- X (unshaded)
- Chance of flooding over 30 yrs
- 0.0%
- Est. flood insurance / yr
- $473 – $860
Fire risk 3/10 · Minor
- Est. fire insurance / yr
- $804 – $1,492
Heat risk 2/10 · Minimal
- Hot days now (above 95°F)
- 7 days/yr
- Hot days in 30 yrs
- 13 days/yr
Wind risk 2/10 · Minimal
- Chance of severe wind over 30 yrs
- —
Air-quality risk 3/10 · Minor
- Unhealthy air days now
- 3 days/yr
- Unhealthy air days in 30 yrs
- 3 days/yr
Risk factors via First Street. Map © Google.
Why this score? — see what drove the B- grade
The composite is a weighted blend of 9 inputs, each scored 0–100. Each bar is that input's sub-score; the figure is the points it added to the 100-point composite (weight × sub-score).
- Cash flow +27.1/30.0
- ARV discount +14.5/15.0
- DSCR +9.4/10.0
- 1% rule +7.9/10.0
- Livability +3.6/5.0
- Rent growth +2.5/5.0
- Condition / age +2.5/5.0
- Schools +1.2/10.0
- Appreciation +0.0/10.0
$135,000
🖨 Deal sheet (PDF) 📄 Offer letter ✓ Due diligence
Listing remarks
Welcome home to this beautifully updated 2-story brick townhouse offering 3 bedrooms and 1.5 baths across 1,268 sq ft of comfortable living space. Renovated approximately 3 years ago, this home features modern finishes, a functional layout, and plenty of natural light throughout. The spacious living and dining areas flow seamlessly, while the kitchen provides ample cabinetry and workspace for everyday living and entertaining. Upstairs you'll find three well-sized bedrooms and a full bath, with a convenient half bath on the main level. The full unfinished basement offers endless potential for additional living space, storage, or a recreation area. Enjoy the convenience of side parking locate
Key facts
- Ample cabinetry
- Updated townhouse
- Solid brick building
Tags
Neighborhood map
What this means for you Summary
Snapshot
- This is a 3-bed/1.5-bath townhouse listed at $135k.
Deal economics
- At list price, monthly cash flow is $382 ($5k/yr) — positive.
- The deal already cash-flows at list — no discount required.
- Meets the 1% rule at list price ($2k rent vs $135k).
- Cap rate 9.7% vs local median 3.8% in Zion — top-decile yield for the area; either an underpriced asset or a hidden risk that comps aren't pricing in. Stress-test before assuming the spread holds.
Location & tenants
- Location reads 71/100 on livability (#353 in IL) — a middle-class / working-renter tenant base. Strengths: cost of living A+, housing A+, health & safety A+; Watch: crime C-, employment C-, commute D+.
- Zion-Benton Twp Hsd 126 (suburban): math 9% / reading 16% proficiency, ranked #531 of 620 in IL (top 86%) — low school quality limits family demand, transient renter base, plan for 1-2y turnover.
- Market conditions: 60 active listings in the ZIP; 8 comparable units currently listed for rent nearby; rentals at typical pace (median 17d on market — plan ~3-4 weeks tenant-placement turnaround); 948 units permitted in Lake County in 2024 (424 in 5+ unit buildings).
- This rent runs 32% of the median local income ($66k/yr) — at the standard rent-burdened threshold; future hikes will face affordability resistance.
Forward outlook
- Local home prices are declining (-3.0%/yr); year-one equity from $933 of loan paydown is wiped out by about $4k of value loss. Plan a longer hold.
- Lake County population projected to shrink 8% by 2050 — rents likely to lag national; underwrite the cash flow, not the appreciation.
- At projected returns (-3.0% appreciation + 3.0% rent growth), your $38k cash investment doubles in ~10 years — after that, you're playing with house money.
Negotiation context
- Only 7 days on market — expect competitive offers; lowballing is unlikely to land.
Questions for the listing agent
- Built in 1963 — when were the roof, HVAC, electrical panel, plumbing, and water heater last replaced?
- Is there a deadline driving the sale (1031 exchange, divorce, estate, relocation)? That informs how much negotiation room exists.
- Schools are F-rated, which usually means shorter tenancies and higher turnover. Who's the typical renter profile here, and what's been the actual vacancy rate?
- What's the average days-on-market for RENTAL listings here right now (not sales)? A rising rental-DOM trend means longer vacancies and softer asking-rent achievability than the comps imply.
- What's the recent tenant-quality profile in this submarket — average credit score on applications, eviction rate, late-payment / NSF rate, and stable-employment percentage? A property-management company in the area should have these aggregated.
- How much new for-sale + rental construction is in the pipeline within 1–3 miles? Heavy new supply typically softens prices + rents 12–24 months out; constrained supply supports both.
Investment metrics
- 1% rule
- 1.29% ✓
- Cap rate
- 9.69%
- Cash-on-cash
- 12.12%
- DSCR
- 1.54
- GRM
- 6.4
CMA / ARV
- ARV (on-the-fly)
- $159,768
- Comps found
- 3
Show comp detail 3 sales within ~0.75 mi
| Address | Dist | Beds/Ba | Sqft | Sold | Price | $/sf | Match |
|---|---|---|---|---|---|---|---|
| 3112 Woodland Dr Unit 2NW | 0.68mi | 2/2.0 (-1) | 1,284 (+1%) | 24mo | $164,000 | $128 | 39 |
| 3161 Woodland Dr #3161 | 0.75mi | 2/2.0 (-1) | 1,387 (+9%) | 15mo | $175,000 | $126 | 30 |
| 3168 Woodland Dr #68 | 0.72mi | 2/2.0 (-1) | 1,387 (+9%) | 19mo | $175,000 | $126 | 28 |
Match score weights: distance 35% · size 25% · config 20% · recency 20%. Top-matched comps best support the ARV.
Projected returns pro-forma
-3.0% appreciation · 3.0% rent growth · sell at horizon
- IRR
- 1.7%
- Equity multiple
- 1.07×
- Total profit
- $2,511
- Equity at exit
- $20,129
- IRR
- 11.4%
- Equity multiple
- 1.89×
- Total profit
- $33,772
- Equity at exit
- $11,672
Cash invested: $37,800 (down + closing). Projections, not guarantees.
Landlord ↔ Tenant lean methodology
- Overall (STATE)
- 43 Moderately Tenant-Leaning
- State Illinois
- 43 Moderately Tenant-Leaning · D+7
- County
- — inherits STATE
- City
- — inherits STATE
ZIP-level market 60099
- Home prices YoY
- -32.5%
- Active inventory
- 60
- Price-to-rent
- 6.4×
Monthly cashflow live
- Estimated rent
- $1,747 high interval (Pro) →
- Mortgage (P&I)
- −$708
- Tax from tax record
- −$234 /mo · $2,810/yr
- Insurance
- −$56
- HOA
- −$0
- Vacancy / Maint / Mgmt
- −$367
- Net cashflow
- $382
Break-even live
Sensitivity live
| Price | -10% $458 | -5% $420 | +0% $382 | +5% $344 | +10% $305 |
|---|---|---|---|---|---|
| Rent | -10% $244 | -5% $313 | +0% $382 | +5% $451 | +10% $520 |
| Rate | -1.0pp $450 | -0.5pp $416 | base $382 | +0.5pp $347 | +1.0pp $311 |
UW: 25.0% down · 7.5% · 30yr · 1.5% tax · 5.0% vac · 8.0% maint · 8.0% mgmt
Financing live
Cash to close
- Down payment
- $33,750
- Closing costs
- $4,050
- Reserves months
- —
- Total cash needed
- —
Loan-product check · same deal, 3 products live
Conventional
25% down · 7.5% · 30yr
- Down + closing
- —
- Monthly P&I
- —
- Monthly cashflow
- —
- DSCR
- —
- Eligible?
- —
Personal DTI + credit; lowest rate.
DSCR
20% down · 8.5% · 30yr
- Down + closing
- —
- Monthly P&I
- —
- Monthly cashflow
- —
- DSCR
- —
- Eligible?
- —
No personal income docs; deal must DSCR.
Hard money
10% down · 12.0% · 12mo
- Down + closing
- —
- Monthly P&I
- —
- Monthly cashflow
- —
- DSCR
- —
- Eligible?
- —
Short-term bridge; refi at stabilization.
Rent comps 8 comps
| Address | Beds | Baths | Sqft | Rent | $/sqft | DOM | Units | Dist |
|---|---|---|---|---|---|---|---|---|
| 2200 Hebron Ave Unit D Zion, IL | 3.0 | 1.5 | 1268 | $1,700 | $1.34 | 16d | 1 | 0.10mi |
| 2200 Hebron Ave Zion, IL | 3.0 | 1.0 | 1268 | $1,700 | $1.34 | 16d | 1 | 0.11mi |
| 2204 Hebron Ave Unit B Zion, IL | 3.0 | 1.0 | 1268 | $1,700 | $1.34 | 16d | 1 | 0.12mi |
| 2024 20th St Zion, IL | 3.0 | 1.0 | 1053 | $2,250 | $2.14 | 22d | 1 | 0.37mi |
| 2101 Eshcol Ave Zion, IL | 3.0 | 2.0 | 1268 | $2,300 | $1.81 | 0d | 1 | 0.81mi |
| 3004 Ezra Ave Zion, IL | 3.0 | 1.0 | 1000 | $2,340 | $2.34 | 0d | 1 | 1.22mi |
| 2902 31st St Zion, IL | 2.0 | 1.0 | 960 | $1,400 | $1.46 | 0d | 1 | 1.23mi |
| 2932 Bethel Blvd Zion, IL | 3.0 | 2.0 | 1240 | $2,100 | $1.69 | 18d | 1 | 1.24mi |
Listing history 2 events
-
2026-03-04status Pending
-
2026-02-25$135,000 Active
ⓘ Source: listings_history table (triggers on properties + properties_extension) + one-shot
backfill from property_details.listing_events for pre-trigger history.
Tax reassessment forecast IL · Partial reset (capped growth)
- Current annual tax
- $2,810 · $234/mo
- Projected year-2 tax
- $2,937 · $245/mo
- Expected delta
- +$127/yr (+$11/mo · 4.5%)
ⓘ Screening estimate from a state-policy table — verify with the county assessor before closing.
Climate risk First Street
- Flood 1/10 Low FEMA zone X (unshaded) · 0% chance over 30 yrs
- Wildfire 3/10 Moderate
- Heat 2/10 Low 7 d/yr ≥95°F today · 13 d/yr by 30 yrs out
- Wind 2/10 Low
- Air quality 3/10 Moderate 3 unhealthy d/yr today · 3 by 30 yrs out
Nearby sold comps map
Loading sold comps map…
Walkable amenities ~0.75 mi
Loading nearby amenities…
Taxation est. · year 1
- Rental income
- $20,966
- − Mortgage interest
- −$7,562
- − Property taxes
- −$2,810
- − Insurance
- −$675
- − Repairs & maintenance
- −$1,677
- − Management
- −$1,677
- − Depreciation
- −$3,927
- Taxable income
- $2,636
- Est. tax owed @ 24.0%
- −$633
- After-tax cash flow
- $3,949/yr
For passive investors: Depreciation is non-cash, so a rental often shows a tax loss while cash-flowing — sheltering income. Rental losses are passive: they offset passive income freely, and up to $25,000/yr can offset ordinary (W-2) income if you actively participate and your MAGI is under $100k (phasing out to $0 by $150k); unused losses carry forward. On sale, claimed depreciation is recaptured at up to 25%, and gains may owe capital-gains tax (a 1031 exchange can defer both). Figures are a year-1 estimate at your 24.0% rate — not tax advice; consult a CPA.
Schools (NCES district)
- District
- Zion-Benton Twp Hsd 126
- NCES district ID
- 1743890
- Math proficiency
- 9% ▼ -6.00%
- Reading proficiency
- 16% ▼ -8.00%
- Median HH income
- $56,473
- Composite
- 12.29/100
- National rank
- #9644
- State rank
- #531 of 620 in IL
Livability — Zion
- Score
- 71/100
- State rank
- #353
- US rank
- #7264
Category grades
Schools grade is shown separately in the Schools card above.
Census & demographics
- Census place
- Zion, IL
- County
- Lake County · 591,991 people
- City population
- 30,881
- Metro
- Chicago-Naperville-Elgin, IL-IN-WI
- Population (ZIP)
- 30,881
- Household income
- $66,109
- Rent vs Own
- Severe rent burden
- 1009.0
Population outlook (Lake County) Hauer SSP2
- Today (2025)
- 700,217 people
- By 2030
- 693,290 · -1.0%
- By 2040
- 673,588 · -3.8%
- By 2050
- 643,556 · -8.1%
- By 2075
- 562,792 · -19.6%
- By 2100
- 457,715 · -34.6%
Race, ethnicity, and origin ACS 2023
- Neighborhood character
- Diverse neighborhood (Simpson 0.70)
- Race & ethnicity
- Hispanic / Latino 40% White 29% Black 23% Two or more races 17% Asian 2% Native American 1%
- Hispanic origin (detail)
- Mexican 30% Puerto Rican 4% Dominican 2%
- Common ancestry
- Romanian 2% Lithuanian 2% Portuguese 1%
- Foreign-born
- 17% · Canada
- Languages at home
- 66% English-only · Spanish 30% Tagalog/Filipino 2%
Political lean MEDSL · Lake
- 2024 margin
- Strong D (+20.8) · D 59.7% · R 38.9% · Other 1.4%
- 2008→2024 swing
- +1.1pp toward D · 2008: 19.6pp · 2024: 20.8pp
- All cycles
- 2024: D+20.8 2020: D+24.1 2016: D+20.3 2012: D+8.1 2008: D+19.6
Not yet ingested
- Civics
- —
Market trends
- HPI YoY
- ▼ -106.90%
- Current HPI
- 222.3484
- Rent YoY
- —
- Metro
- Chicago-Naperville-Elgin, IL-IN-WI
- State GDP YoY
- ▲ 1.59%
- F500 in state
- 60
Industry mix (Fortune 500 HQ in IL)
| Industry | F500 HQs | Revenue |
|---|---|---|
| Insurance | 4 | $201B |
|
||
| Consumer Goods | 4 | $87B |
|
||
| Industrial Machinery | 3 | $64B |
|
||
| Healthcare | 2 | $55B |
|
||
| Retail / Pharmacy | 1 | $148B |
|
||
| Agriculture / Food | 1 | $86B |
|
||
Price history
2 events — show timeline
- 2026-03-04 Pending — MRED as Distributed by MLS Grid
- 2026-02-25 Listed $135,000 MRED as Distributed by MLS Grid
Property tax history
+1.9%/yrLatest (2024): $2,810 · +2.9% YoY. Source: county tax records.
Cash-flow waterfall
monthlySold comps — $/sqft
last 12 mo · ≤1 miLoading sold comps…