 🏷️ Likely Rental
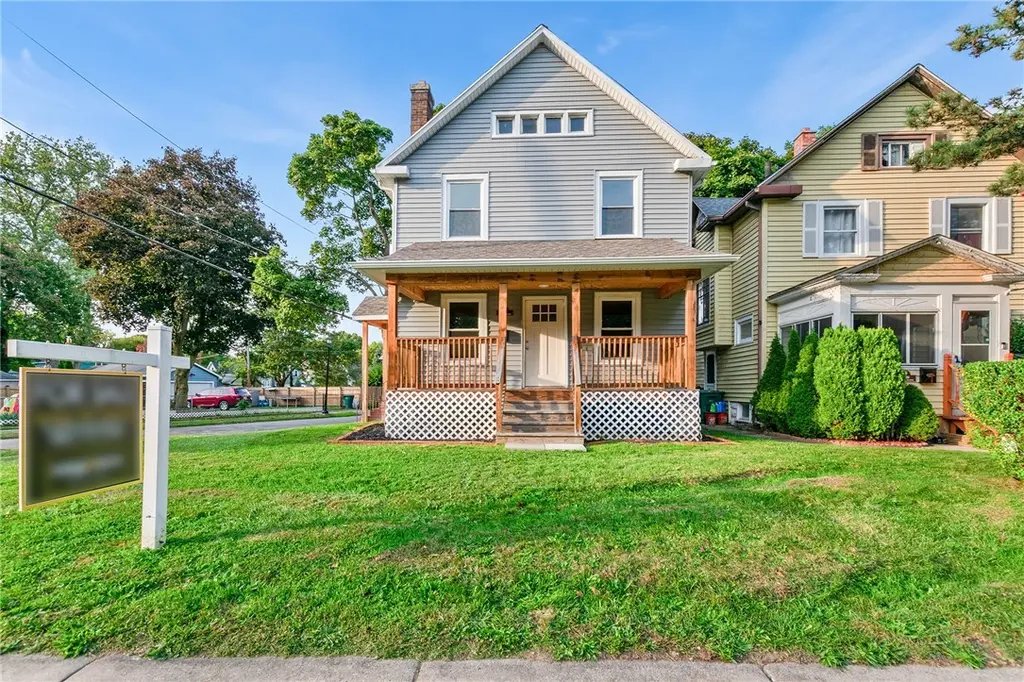
994 Atlantic Ave · Rochester, NY
Flood risk 1/10 · Minimal
- FEMA flood zone
- X (unshaded)
- Chance of flooding over 30 yrs
- 0.0%
- Est. flood insurance / yr
- $473 – $860
Fire risk 3/10 · Minor
- Est. fire insurance / yr
- $691 – $1,283
Heat risk 2/10 · Minimal
- Hot days now (above 96°F)
- 7 days/yr
- Hot days in 30 yrs
- 15 days/yr
Wind risk 1/10 · Minimal
- Chance of severe wind over 30 yrs
- —
Air-quality risk 2/10 · Minimal
- Unhealthy air days now
- 1 days/yr
- Unhealthy air days in 30 yrs
- 2 days/yr
Risk factors via First Street. Map © Google.
Why this score? — see what drove the B- grade
The composite is a weighted blend of 9 inputs, each scored 0–100. Each bar is that input's sub-score; the figure is the points it added to the 100-point composite (weight × sub-score).
- Cash flow +25.2/30.0
- ARV discount +15.0/15.0
- DSCR +8.3/10.0
- 1% rule +5.9/10.0
- Rent growth +4.5/5.0
- Livability +3.8/5.0
- Condition / age +2.5/5.0
- Schools +1.9/10.0
- Appreciation +0.0/10.0
$174,900
🖨 Deal sheet (PDF) 📄 Offer letter ✓ Due diligence
Listing remarks MLS
Needs updating. 24 hours to show please. Tenant occupied.
Key facts
- Quartz countertops
- Renovated
- New kitchen
Tags
Property features AI
Exterior
- Parking: No garage
- Utilities: Public water connected; Sewer connected
- Home design: Two-story home; Resale property; Vinyl siding (see remarks)
- Construction: Existing structure; Vinyl siding
- Exterior features: Gravel driveway; Irregular lot; Road frontage on a main thoroughfare; Lot dimensions approximately 51 x 136
Interior
- Kitchen: Dishwasher; Gas oven; Gas range; Microwave; Refrigerator
- Bedrooms: Total rooms: 8; Room types include living room and other; Has full basement
- Flooring: Hardwood; Tile; Vinyl; Varies
- Bathrooms: 1 full bathroom
- Heating & cooling: Forced air heating (gas); Central air conditioning
- Interior features: Eat-in kitchen; Separate/formal living room; Other interior features (see remarks)
- Laundry & utility: Gas water heater
Neighborhood map
What this means for you Summary
Snapshot
- This is a 4-bed/1.0-bath single-family listed at $175k.
Deal economics
- At list price, monthly cash flow is $390 ($5k/yr) — positive.
- The deal already cash-flows at list — no discount required.
- Meets the 1% rule at list price ($2k rent vs $175k).
Location & tenants
- Location reads 76/100 on livability (#222 in NY, #3,482 nationally) — a middle-class / working-renter tenant base. Strengths: commute A+, cost of living A+, housing A+; Watch: crime F, employment F.
- Rochester City School District (urban): math 21% / reading 26% proficiency, ranked #589 of 590 in NY (top 100%) — low school quality limits family demand, transient renter base, plan for 1-2y turnover; 82% free/reduced lunch — lower-income household profile, screen leases tightly.
- Zoned schools: School 28-Henry Hudson (math 12% / reading 27%, grade F, #1,992 of 2,108 statewide, top 95%, 616 students, 93% FRL); East Lower School (math 2% / reading 22%, grade F, #715 of 729 statewide, top 98%, 304 students, 86% FRL); Edison Career And Technology High School (math 44% / reading 50%, grade D-, #1,007 of 1,100 statewide, top 93%, 1,233 students, 91% FRL).
- Market conditions: Rents rising fast (+7.9%/yr); 199 active listings in the ZIP; 13 comparable units currently listed for rent nearby; rentals at typical pace (median 23d on market — plan ~3-4 weeks tenant-placement turnaround); 46% of comp listings sitting > 30 days — soft ceiling on asking rent; 1,169 units permitted in Monroe County in 2024 (591 in 5+ unit buildings).
- This rent runs 35% of the median local income ($65k/yr) — at the standard rent-burdened threshold; future hikes will face affordability resistance.
Forward outlook
- Local home prices are declining (-3.0%/yr); year-one equity from $1k of loan paydown is wiped out by about $5k of value loss. Plan a longer hold.
- Monroe County population projected to shrink 6% by 2050 — rents likely to lag national; underwrite the cash flow, not the appreciation.
- At projected returns (-3.0% appreciation + 7.9% rent growth), your $49k cash investment doubles in ~8 years — after that, you're playing with house money.
Negotiation context
- Only 10 days on market — expect competitive offers; lowballing is unlikely to land.
- 3 sale attempts since 10y ago with the ask held roughly flat each time — persistent listings suggest the price (not the market) is what's stuck; bring a comps-based counter.
- Current owner paid $40k; list at $175k implies a 337% gain — meaningful room to come down on a strong offer.
Risks & watch-outs
- Watch-outs: built in 1914 — expect roof / HVAC / electrical / plumbing capex.
Questions for the listing agent
- Built in 1914 — when were the roof, HVAC, electrical panel, plumbing, and water heater last replaced?
- Is there a deadline driving the sale (1031 exchange, divorce, estate, relocation)? That informs how much negotiation room exists.
- Schools are D-rated, which usually means shorter tenancies and higher turnover. Who's the typical renter profile here, and what's been the actual vacancy rate?
- Crime grade is F in this area — have there been break-ins, vandalism, or insurance claims at this property in the last 3 years? What carrier currently insures it and at what premium?
- What's the average days-on-market for RENTAL listings here right now (not sales)? A rising rental-DOM trend means longer vacancies and softer asking-rent achievability than the comps imply.
- What's the recent tenant-quality profile in this submarket — average credit score on applications, eviction rate, late-payment / NSF rate, and stable-employment percentage? A property-management company in the area should have these aggregated.
- How much new for-sale + rental construction is in the pipeline within 1–3 miles? Heavy new supply typically softens prices + rents 12–24 months out; constrained supply supports both.
Investment metrics
- 1% rule
- 1.09% ✓
- Cap rate
- 8.97%
- Cash-on-cash
- 9.57%
- DSCR
- 1.43
- GRM
- 7.7
CMA / ARV
- ARV (median comp)
- $267,881
- List price
- $174,900
- Delta
- -34.71%
- Verdict
- UNDERPRICED
- Comps
- 20 within 1.0 mi
Show comp detail 12 sales within ~0.75 mi
| Address | Dist | Beds/Ba | Sqft | Sold | Price | $/sf | Match |
|---|---|---|---|---|---|---|---|
| 970 Atlantic Ave | 0.04mi | 3/1.0 (-1) | 1,249 (-12%) | 2mo | $210,000 | $168 | 71 |
| 120 Brookfield Rd | 0.07mi | 3/1.5 (-1) | 1,568 (+10%) | 3mo | $340,000 | $217 | 71 |
| 115 Allandale Ave | 0.27mi | 3/1.0 (-1) | 1,248 (-12%) | 1mo | $248,000 | $199 | 61 |
| 110 Arch St | 0.70mi | 4/2.0 | 1,417 (-1%) | 2mo | $200,000 | $141 | 60 |
| 139 Carling Rd | 0.37mi | 3/1.0 (-1) | 1,283 (-10%) | 2mo | $275,000 | $214 | 59 |
| 94 Delray Rd | 0.23mi | 3/1.5 (-1) | 1,222 (-14%) | 0mo | $300,000 | $245 | 58 |
| 106 Ohio St | 0.31mi | 3/2.0 (-1) | 1,600 (+12%) | 2mo | $218,000 | $136 | 55 |
| 230 Farmington Rd | 0.72mi | 3/1.0 (-1) | 1,369 (-4%) | 2mo | $250,000 | $183 | 52 |
| 25 Wilsonia Rd | 0.49mi | 3/1.0 (-1) | 1,604 (+12%) | 1mo | $338,000 | $211 | 50 |
| 21 Edmonton Rd | 0.74mi | 4/1.0 | 1,300 (-9%) | 2mo | $300,000 | $231 | 49 |
| 48 Arbordale Ave | 0.59mi | 3/2.5 (-1) | 1,550 (+9%) | 0mo | $285,000 | $184 | 47 |
| 70 Dalkeith Rd | 0.61mi | 3/1.0 (-1) | 1,236 (-13%) | 0mo | $280,000 | $227 | 44 |
Match score weights: distance 35% · size 25% · config 20% · recency 20%. Top-matched comps best support the ARV.
Projected returns pro-forma
-3.0% appreciation · 7.89% rent growth · sell at horizon
- IRR
- 3.2%
- Equity multiple
- 1.13×
- Total profit
- $6,332
- Equity at exit
- $26,078
- IRR
- 16.8%
- Equity multiple
- 2.68×
- Total profit
- $82,075
- Equity at exit
- $15,122
Cash invested: $48,972 (down + closing). Projections, not guarantees.
Landlord ↔ Tenant lean methodology
- Overall (STATE)
- 15 Strongly Tenant-Friendly
- State New York
- 15 Strongly Tenant-Friendly · D+10
- County
- — inherits STATE
- City
- — inherits STATE
ZIP-level market 14609
- Home prices YoY
- -30.4%
- Rents YoY
- 7.9%
- Active inventory
- 199
- Price-to-rent
- 7.7×
Monthly cashflow live
- Estimated rent
- $1,905 high interval (Pro) →
- Mortgage (P&I)
- −$917
- Tax from tax record
- −$124 /mo · $1,493/yr
- Insurance
- −$73
- HOA
- −$0
- Vacancy / Maint / Mgmt
- −$400
- Net cashflow
- $390
Break-even live
Sensitivity live
| Price | -10% $489 | -5% $440 | +0% $390 | +5% $341 | +10% $291 |
|---|---|---|---|---|---|
| Rent | -10% $240 | -5% $315 | +0% $390 | +5% $466 | +10% $541 |
| Rate | -1.0pp $479 | -0.5pp $435 | base $390 | +0.5pp $345 | +1.0pp $299 |
UW: 25.0% down · 7.5% · 30yr · 1.5% tax · 5.0% vac · 8.0% maint · 8.0% mgmt
Financing live
Cash to close
- Down payment
- $43,725
- Closing costs
- $5,247
- Reserves months
- —
- Total cash needed
- —
Loan-product check · same deal, 3 products live
Conventional
25% down · 7.5% · 30yr
- Down + closing
- —
- Monthly P&I
- —
- Monthly cashflow
- —
- DSCR
- —
- Eligible?
- —
Personal DTI + credit; lowest rate.
DSCR
20% down · 8.5% · 30yr
- Down + closing
- —
- Monthly P&I
- —
- Monthly cashflow
- —
- DSCR
- —
- Eligible?
- —
No personal income docs; deal must DSCR.
Hard money
10% down · 12.0% · 12mo
- Down + closing
- —
- Monthly P&I
- —
- Monthly cashflow
- —
- DSCR
- —
- Eligible?
- —
Short-term bridge; refi at stabilization.
Rent comps 13 comps
| Address | Beds | Baths | Sqft | Rent | $/sqft | DOM | Units | Dist |
|---|---|---|---|---|---|---|---|---|
| 1079 Garson Ave Rochester, NY | 3.0 | 1.5 | 1273 | $2,100 | $1.65 | 12d | 1 | 0.43mi |
| — Rochester, NY | 3.0 | 1.0 | 1025 | $1,450 | $1.41 | 45d | 1 | 0.48mi |
| 108 Bowman St Unit 1 Rochester, NY | 3.0 | 1.0 | 1200 | $1,600 | $1.33 | 45d | 1 | 0.59mi |
| 176 Merwin Ave Rochester, NY | 4.0 | 1.5 | 1750 | $2,200 | $1.26 | 45d | 1 | 0.62mi |
| 1600 East Ave Rochester, NY | 3.0 | 1.0–2.0 | 944 | $2,875 | $3.04 | 4d | 1 | 0.66mi |
| 1159 Culver Rd Unit A2 UP Rochester, NY | 3.0 | 1.0 | 1313 | $1,500 | $1.14 | 45d | 1 | 0.72mi |
| 420 Rosewood Ter Rochester, NY | 3.0 | 1.0 | 1246 | $1,300 | $1.04 | 5d | 1 | 0.85mi |
| 195 Parsells Ave Rochester, NY | 4.0 | 1.0 | 1413 | $1,265 | $0.90 | 5d | 1 | 1.03mi |
| 126 Parsells Ave Rochester, NY | 3.0 | 1.0 | 1574 | $1,800 | $1.14 | 45d | 1 | 1.13mi |
| 126 Parsells Ave Rochester, NY | 3.0 | 1.0 | 1574 | $1,800 | $1.14 | 23d | 1 | 1.13mi |
| 214 Culver Rd Apt 2 Rochester, NY | 3.0 | 1.0 | 1700 | $2,400 | $1.41 | 16d | 1 | 1.15mi |
| 36 Morningside Park Rochester, NY | 4.0 | 1.0 | 1446 | $2,400 | $1.66 | 5d | 1 | 1.21mi |
| 733 University Ave #3 Rochester, NY | 3.0 | 1.5 | 1400 | $1,850 | $1.32 | 45d | 1 | 1.33mi |
Listing history 7 events
-
2026-05-13$174,900 Active 312-char remark
-
2024-10-14historical
-
2024-10-01$199,900 Active
-
2016-12-05soldstatus $40,000 Closed Sale or Rented
Show marketing remark (57 chars)
Needs updating. 24 hours to show please. Tenant occupied.
-
2016-11-08status Pending Sale
Show marketing remark (57 chars)
Needs updating. 24 hours to show please. Tenant occupied.
-
2016-10-18price $49,900
Show marketing remark (57 chars)
Needs updating. 24 hours to show please. Tenant occupied.
-
2016-08-29$54,900 Active
Show marketing remark (57 chars)
Needs updating. 24 hours to show please. Tenant occupied.
ⓘ Source: listings_history table (triggers on properties + properties_extension) + one-shot
backfill from property_details.listing_events for pre-trigger history.
Tax reassessment forecast NY · Partial reset (capped growth)
- Current annual tax
- $1,493 · $124/mo
- Projected year-2 tax
- $2,225 · $185/mo
- Expected delta
- +$731/yr (+$61/mo · 49.0%)
ⓘ Screening estimate from a state-policy table — verify with the county assessor before closing.
Climate risk First Street
- Flood 1/10 Low FEMA zone X (unshaded) · 0% chance over 30 yrs
- Wildfire 3/10 Moderate
- Heat 2/10 Low 7 d/yr ≥96°F today · 15 d/yr by 30 yrs out
- Wind 1/10 Low
- Air quality 2/10 Low 1 unhealthy d/yr today · 2 by 30 yrs out
Nearby sold comps map
Loading sold comps map…
Walkable amenities ~0.75 mi
Loading nearby amenities…
Taxation est. · year 1
- Rental income
- $22,860
- − Mortgage interest
- −$9,797
- − Property taxes
- −$1,493
- − Insurance
- −$874
- − Repairs & maintenance
- −$1,829
- − Management
- −$1,829
- − Depreciation
- −$5,088
- Taxable income
- $1,949
- Est. tax owed @ 24.0%
- −$468
- After-tax cash flow
- $4,217/yr
For passive investors: Depreciation is non-cash, so a rental often shows a tax loss while cash-flowing — sheltering income. Rental losses are passive: they offset passive income freely, and up to $25,000/yr can offset ordinary (W-2) income if you actively participate and your MAGI is under $100k (phasing out to $0 by $150k); unused losses carry forward. On sale, claimed depreciation is recaptured at up to 25%, and gains may owe capital-gains tax (a 1031 exchange can defer both). Figures are a year-1 estimate at your 24.0% rate — not tax advice; consult a CPA.
Schools (NCES district)
- District
- Rochester City School District
- NCES district ID
- 3624750
- Math proficiency
- 21% ▬ 0.00%
- Reading proficiency
- 26% ▲ 4.00%
- Median HH income
- $30,923
- Composite
- 18.98/100
- National rank
- #8850
- State rank
- #589 of 590 in NY
Livability — Rochester
- Score
- 76/100
- State rank
- #222
- US rank
- #3482
Category grades
Schools grade is shown separately in the Schools card above.
Census & demographics
- Census place
- Rochester, NY
- County
- Monroe County · 674,131 people
- City population
- 432,803
- Metro
- Rochester, NY
- Population (ZIP)
- 40,274
- Household income
- $64,603
- Rent vs Own
- Severe rent burden
- 2183.0
Population outlook (Monroe County) Hauer SSP2
- Today (2025)
- 759,460 people
- By 2030
- 757,154 · -0.3%
- By 2040
- 740,644 · -2.5%
- By 2050
- 714,443 · -5.9%
- By 2075
- 645,883 · -15.0%
- By 2100
- 547,084 · -28.0%
Race, ethnicity, and origin ACS 2023
- Neighborhood character
- Diverse neighborhood (Simpson 0.69)
- Race & ethnicity
- White 44% Black 28% Hispanic / Latino 20% Two or more races 10% Asian 2%
- Hispanic origin (detail)
- Puerto Rican 15% Cuban 1% Dominican 1%
- Common ancestry
- Romanian 4% Lithuanian 2% Iranian 1%
- Foreign-born
- 8% · Canada
- Languages at home
- 81% English-only · Spanish 14% Russian/Polish/Slavic 2% Other Indo-European 1%
Political lean MEDSL · Monroe
- 2024 margin
- D (+19.1) · D 59.5% · R 40.5%
- 2008→2024 swing
- +1.4pp toward D · 2008: 17.7pp · 2024: 19.1pp
- All cycles
- 2024: D+19.1 2020: D+21.0 2016: D+14.1 2012: D+17.4 2008: D+17.7
Not yet ingested
- Civics
- —
Market trends
- HPI YoY
- ▼ -143.57%
- Current HPI
- 328.7053
- Rent YoY
- ▲ 7.89%
- Metro
- Rochester, NY
- State GDP YoY
- ▲ 2.60%
- F500 in state
- 92
Industry mix (Fortune 500 HQ in NY)
| Industry | F500 HQs | Revenue |
|---|---|---|
| Financial Services | 10 | $950B |
|
||
| Consumer Goods | 9 | $162B |
|
||
| Insurance | 4 | $225B |
|
||
| Telecommunications | 2 | $144B |
|
||
| Pharmaceuticals | 2 | $112B |
|
||
| Media / Entertainment | 2 | $69B |
|
||
Price history
+218.6% since first listed8 events — show timeline
- 2026-05-23 Pending — UNYREIS
- 2026-05-13 Listed $174,900 UNYREIS
- 2024-10-14 Listing Removed — UNYREIS
- 2024-10-01 Listed $199,900 UNYREIS
- 2016-12-05 Sold (MLS) $40,000 UNYREIS
- 2016-11-08 Pending — UNYREIS
- 2016-10-18 Price Changed $49,900 UNYREIS
- 2016-08-29 Listed $54,900 UNYREIS
Property tax history
+6.0%/yrLatest (2025): $1,493 · -7.6% YoY. Source: county tax records.
Cash-flow waterfall
monthlySold comps — $/sqft
last 12 mo · ≤1 miLoading sold comps…