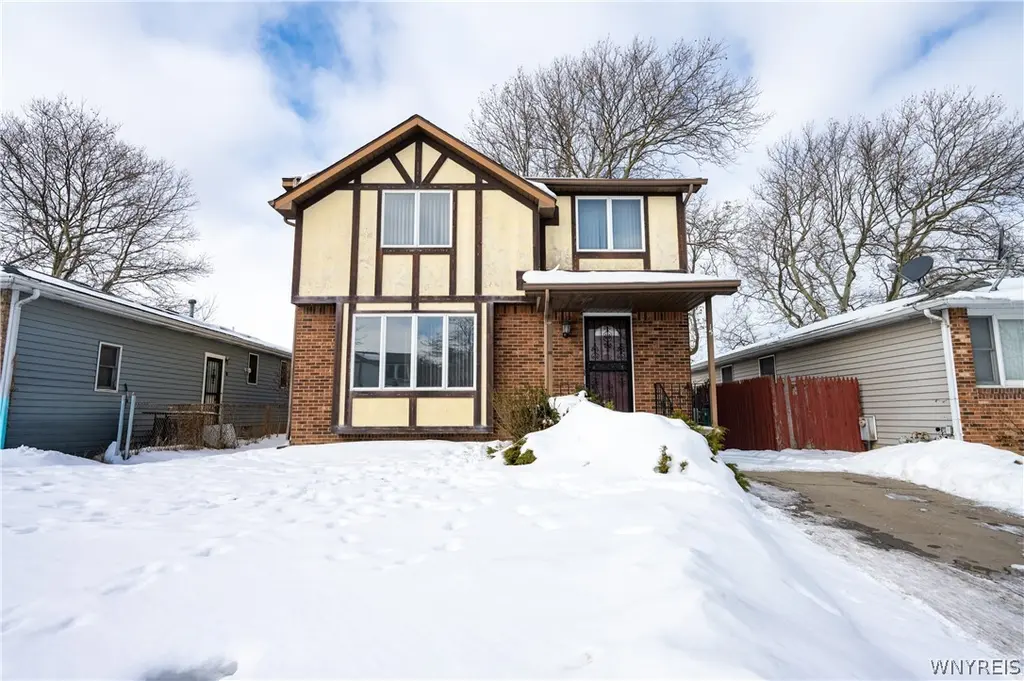
15 John Paul Ct · Buffalo, NY
Flood risk 1/10 · Minimal
- FEMA flood zone
- X (unshaded)
- Chance of flooding over 30 yrs
- 0.0%
- Est. flood insurance / yr
- $473 – $860
Fire risk 1/10 · Minimal
- Est. fire insurance / yr
- $691 – $1,283
Heat risk 3/10 · Minor
- Hot days now (above 92°F)
- 7 days/yr
- Hot days in 30 yrs
- 15 days/yr
Wind risk 1/10 · Minimal
- Chance of severe wind over 30 yrs
- —
Air-quality risk 3/10 · Minor
- Unhealthy air days now
- 2 days/yr
- Unhealthy air days in 30 yrs
- 3 days/yr
Risk factors via First Street. Map © Google.
Why this score? — see what drove the C- grade
The composite is a weighted blend of 9 inputs, each scored 0–100. Each bar is that input's sub-score; the figure is the points it added to the 100-point composite (weight × sub-score).
- Cash flow +17.1/30.0
- Appreciation +9.0/10.0
- ARV discount +7.7/15.0
- DSCR +5.3/10.0
- Livability +3.9/5.0
- 1% rule +3.3/10.0
- Schools +3.3/10.0
- Rent growth +2.5/5.0
- Condition / age +2.5/5.0
$199,999
🖨 Deal sheet (PDF) 📄 Offer letter ✓ Due diligence
Listing remarks
What an incredible opportunity to own a spacious, character-filled home at an affordable price! With low taxes helping to keep your mortgage payment affordable, this is a smart move for both comfort and value. This beautiful property features three generously sized bedrooms, one full bath, and a convenient half bath. The oversized living and dining rooms provide plenty of space for entertaining or relaxing in comfort. The eat-in kitchen offers a fantastic layout for cooking and gathering, while the bonus room just off the kitchen adds even more flexible living space—perfect for a home office, playroom, den, or hobby area. Step outside to the rear patio where you’ll find a charmi
Key facts
- Bonus room
- Pool house
- Eat-in kitchen
Tags
Neighborhood map
What this means for you Summary
Snapshot
- This is a 3-bed/1.5-bath single-family listed at $200k.
Deal economics
- At list price, monthly cash flow is $140 ($2k/yr) — positive.
- The deal already cash-flows at list — no discount required.
- To meet the 1% rule (rent ≥ 1% of price), the offer needs to be $165k (17.4% below list).
- Recommended offer: $165k (17.4% below list) — sets the bar for 1% rule.
Location & tenants
- Location reads 77/100 on livability (#195 in NY, #3,011 nationally) — a middle-class / working-renter tenant base. Strengths: commute A+, housing A+, health & safety A+; Watch: crime F, employment D-.
- Buffalo City School District (urban): math 41% / reading 40% proficiency, ranked #535 of 590 in NY (top 91%) — families likely to look elsewhere, expect single-tenant / working-renter base with shorter leases; 75% free/reduced lunch — lower-income household profile, screen leases tightly.
- Zoned schools: International School (math 8% / reading 17%, grade F, #2,048 of 2,108 statewide, top 97%, 981 students, 92% FRL); Hutchinson Central Technical High School (math 96% / reading 32%, grade B-, #807 of 1,100 statewide, top 73%, 1,175 students, 78% FRL).
- Market conditions: 170 active listings in the ZIP; 10 comparable units currently listed for rent nearby; rentals at typical pace (median 25d on market — plan ~3-4 weeks tenant-placement turnaround); 1,244 units permitted in Erie County in 2024 (563 in 5+ unit buildings).
- This rent runs 39% of the median local income ($50k/yr) — at the standard rent-burdened threshold; future hikes will face affordability resistance.
Forward outlook
- In year one you build about $18k of equity ($1k loan paydown + $16k appreciation (8.1% local appreciation)).
- At projected returns (8.1% appreciation + 3.0% rent growth), your $56k cash investment doubles in ~3 years — after that, you're playing with house money.
- By year 3, paydown + projected appreciation supports a ~$44k cash-out refi (75% LTV) — recoverable capital for the next deal without selling this one.
Negotiation context
- It's been on market 21 days — a 2% lower offer ($197k) is reasonable based on typical stale-listing flexibility.
- Current owner paid $58k; list at $200k implies a 245% gain — meaningful room to come down on a strong offer.
Questions for the listing agent
- Is there a deadline driving the sale (1031 exchange, divorce, estate, relocation)? That informs how much negotiation room exists.
- Crime grade is F in this area — have there been break-ins, vandalism, or insurance claims at this property in the last 3 years? What carrier currently insures it and at what premium?
- What's the average days-on-market for RENTAL listings here right now (not sales)? A rising rental-DOM trend means longer vacancies and softer asking-rent achievability than the comps imply.
- What's the recent tenant-quality profile in this submarket — average credit score on applications, eviction rate, late-payment / NSF rate, and stable-employment percentage? A property-management company in the area should have these aggregated.
- How much new for-sale + rental construction is in the pipeline within 1–3 miles? Heavy new supply typically softens prices + rents 12–24 months out; constrained supply supports both.
Investment metrics
- 1% rule
- 0.83% ✗
- Cap rate
- 7.13%
- Cash-on-cash
- 3.00%
- DSCR
- 1.13
- GRM
- 10.1
CMA / ARV
- ARV (on-the-fly)
- $200,736
- Comps found
- 12
Show comp detail 12 sales within ~0.75 mi
| Address | Dist | Beds/Ba | Sqft | Sold | Price | $/sf | Match |
|---|---|---|---|---|---|---|---|
| 47 John Paul Ct Ct | 0.07mi | 3/2.5 | 1,274 (-9%) | 4mo | $234,900 | $184 | 76 |
| 553 William St | 0.45mi | 3/1.5 | 1,279 (-8%) | 5mo | $231,750 | $181 | 61 |
| 23 Guilford St | 0.58mi | 4/1.5 (+1) | 1,322 (-5%) | 1mo | $190,000 | $144 | 59 |
| 219 Jefferson Ave | 0.65mi | 2/2.0 (-1) | 1,360 (-2%) | 5mo | $154,000 | $113 | 55 |
| 823 S Division St | 0.54mi | 2/1.0 (-1) | 1,236 (-11%) | 2mo | $70,000 | $57 | 48 |
| 634 E Eagle St | 0.57mi | 3/1.0 | 1,279 (-8%) | 13mo | $230,000 | $180 | 47 |
| 57 Jones St | 0.50mi | 4/1.0 (+1) | 1,497 (+7%) | 12mo | $72,000 | $48 | 47 |
| 146 James St | 0.37mi | 3/1.0 | 1,225 (-12%) | 19mo | $31,000 | $25 | 45 |
| 323 Jefferson Ave | 0.61mi | 3/2.0 | 1,220 (-12%) | 5mo | $195,000 | $160 | 45 |
| 95 Peckham St | 0.49mi | 4/1.0 (+1) | 1,249 (-10%) | 18mo | $150,000 | $120 | 38 |
| 595 S Division St | 0.72mi | 3/2.0 | 1,508 (+8%) | 22mo | $235,000 | $156 | 32 |
| 102 Guilford St | 0.73mi | 3/1.0 | 1,572 (+13%) | 17mo | $134,500 | $86 | 29 |
Match score weights: distance 35% · size 25% · config 20% · recency 20%. Top-matched comps best support the ARV.
Projected returns pro-forma
8.06% appreciation · 3.0% rent growth · sell at horizon
- IRR
- 22.4%
- Equity multiple
- 2.64×
- Total profit
- $91,932
- Equity at exit
- $152,740
- IRR
- 20.5%
- Equity multiple
- 5.64×
- Total profit
- $259,922
- Equity at exit
- $303,948
Cash invested: $56,000 (down + closing). Projections, not guarantees.
Landlord ↔ Tenant lean methodology
- Overall (STATE)
- 15 Strongly Tenant-Friendly
- State New York
- 15 Strongly Tenant-Friendly · D+10
- County
- — inherits STATE
- City
- — inherits STATE
ZIP-level market 14206
- Home prices YoY
- 1.8%
- Active inventory
- 170
- Price-to-rent
- 10.1×
Monthly cashflow live
- Estimated rent
- $1,653 high interval (Pro) →
- Mortgage (P&I)
- −$1,049
- Tax from tax record
- −$34 /mo · $404/yr
- Insurance
- −$83
- HOA
- −$0
- Vacancy / Maint / Mgmt
- −$347
- Net cashflow
- $140
Break-even live
Sensitivity live
| Price | -10% $253 | -5% $196 | +0% $140 | +5% $-146 | +10% $-215 |
|---|---|---|---|---|---|
| Rent | -10% $9 | -5% $75 | +0% $140 | +5% $205 | +10% $270 |
| Rate | -1.0pp $241 | -0.5pp $191 | base $140 | +0.5pp $88 | +1.0pp $35 |
UW: 25.0% down · 7.5% · 30yr · 1.5% tax · 5.0% vac · 8.0% maint · 8.0% mgmt
Financing live
Cash to close
- Down payment
- $50,000
- Closing costs
- $6,000
- Reserves months
- —
- Total cash needed
- —
Loan-product check · same deal, 3 products live
Conventional
25% down · 7.5% · 30yr
- Down + closing
- —
- Monthly P&I
- —
- Monthly cashflow
- —
- DSCR
- —
- Eligible?
- —
Personal DTI + credit; lowest rate.
DSCR
20% down · 8.5% · 30yr
- Down + closing
- —
- Monthly P&I
- —
- Monthly cashflow
- —
- DSCR
- —
- Eligible?
- —
No personal income docs; deal must DSCR.
Hard money
10% down · 12.0% · 12mo
- Down + closing
- —
- Monthly P&I
- —
- Monthly cashflow
- —
- DSCR
- —
- Eligible?
- —
Short-term bridge; refi at stabilization.
Rent comps 10 comps
| Address | Beds | Baths | Sqft | Rent | $/sqft | DOM | Units | Dist |
|---|---|---|---|---|---|---|---|---|
| 140 Seymour St Unit First Floor Buffalo, NY | 2.0 | 1.0 | 1300 | $1,800 | $1.38 | 5d | 1 | 0.61mi |
| 140 Seymour St Buffalo, NY | 2.0 | 1.0 | 1300 | $1,800 | $1.38 | 25d | 1 | 0.61mi |
| 47 Lester St Unit Main Floor Buffalo, NY | 3.0 | 1.0 | 900 | $1,000 | $1.11 | 45d | 1 | 1.27mi |
| 901 S Park Ave Unit Lower Buffalo, NY | 4.0 | 1.0 | 1729 | $1,600 | $0.93 | 25d | 1 | 1.33mi |
| 1150 Bailey Ave Buffalo, NY | 4.0 | 1.5 | 1100 | $1,200 | $1.09 | 25d | 1 | 1.39mi |
| 149 Swan St #404 Buffalo, NY | 2.0 | 2.0 | 1237 | $2,050 | $1.66 | 13d | 1 | 1.45mi |
| 149 Swan St #404 Buffalo, NY | 2.0 | 2.0 | 1237 | $2,100 | $1.70 | 25d | 1 | 1.45mi |
| 983 Michigan Ave Buffalo, NY | 2.0 | 1.0–2.0 | 804 | $3,202 | $3.98 | 3d | 58 | 1.46mi |
| 230 Scott St Buffalo, NY | 1.0–2.0 | 1.0–2.0 | 1285 | $2,325 | $1.81 | 3d | 4 | 1.48mi |
| 489 Ellicott St Unit 36 Buffalo, NY | 2.0 | 2.0 | 1000 | $1,550 | $1.55 | 4d | 1 | 1.48mi |
Listing history 3 events
-
2026-03-08status Pending
-
2026-02-15$199,999 Active
-
2005-05-27soldstatus $58,000
ⓘ Source: listings_history table (triggers on properties + properties_extension) + one-shot
backfill from property_details.listing_events for pre-trigger history.
Tax reassessment forecast NY · Partial reset (capped growth)
- Current annual tax
- $404 · $34/mo
- Projected year-2 tax
- $1,892 · $158/mo
- Expected delta
- +$1,488/yr (+$124/mo · 368.8%)
ⓘ Screening estimate from a state-policy table — verify with the county assessor before closing.
Climate risk First Street
- Flood 1/10 Low FEMA zone X (unshaded) · 0% chance over 30 yrs
- Wildfire 1/10 Low
- Heat 3/10 Moderate 7 d/yr ≥92°F today · 15 d/yr by 30 yrs out
- Wind 1/10 Low
- Air quality 3/10 Moderate 2 unhealthy d/yr today · 3 by 30 yrs out
Nearby sold comps map
Loading sold comps map…
Walkable amenities ~0.75 mi
Loading nearby amenities…
Taxation est. · year 1
- Rental income
- $19,832
- − Mortgage interest
- −$11,203
- − Property taxes
- −$404
- − Insurance
- −$1,000
- − Repairs & maintenance
- −$1,587
- − Management
- −$1,587
- − Depreciation
- −$5,818
- Taxable loss
- −$1,766
- Est. tax savings @ 24.0%
- +$424
- After-tax cash flow
- $2,102/yr
For passive investors: Depreciation is non-cash, so a rental often shows a tax loss while cash-flowing — sheltering income. Rental losses are passive: they offset passive income freely, and up to $25,000/yr can offset ordinary (W-2) income if you actively participate and your MAGI is under $100k (phasing out to $0 by $150k); unused losses carry forward. On sale, claimed depreciation is recaptured at up to 25%, and gains may owe capital-gains tax (a 1031 exchange can defer both). Figures are a year-1 estimate at your 24.0% rate — not tax advice; consult a CPA.
Schools (NCES district)
- District
- Buffalo City School District
- NCES district ID
- 3605850
- Math proficiency
- 41% ▲ 11.00%
- Reading proficiency
- 40% ▲ 7.00%
- Median HH income
- $31,665
- Composite
- 33.17/100
- National rank
- #5544
- State rank
- #535 of 590 in NY
Livability — Buffalo
- Score
- 77/100
- State rank
- #195
- US rank
- #3011
Category grades
Schools grade is shown separately in the Schools card above.
Census & demographics
- Census place
- Buffalo, NY
- County
- Erie County · 714,559 people
- City population
- 440,021
- Metro
- Buffalo-Cheektowaga, NY
- Population (ZIP)
- 21,631
- Household income
- $50,450
- Rent vs Own
- Severe rent burden
- 841.0
Population outlook (Erie County) Hauer SSP2
- Today (2025)
- 933,037 people
- By 2030
- 935,181 · +0.2%
- By 2040
- 928,531 · -0.5%
- By 2050
- 905,725 · -2.9%
- By 2075
- 834,037 · -10.6%
- By 2100
- 708,033 · -24.1%
Race, ethnicity, and origin ACS 2023
- Neighborhood character
- Majority White (65%)
- Race & ethnicity
- White 65% Hispanic / Latino 13% Black 12% Two or more races 8% Asian 4%
- Hispanic origin (detail)
- Mexican 2% Puerto Rican 10%
- Common ancestry
- Romanian 25% Lithuanian 1% Italian 1%
- Foreign-born
- 6% · Canada, China
- Languages at home
- 88% English-only · Spanish 5% Other Indo-European 3% Arabic 2%
Political lean MEDSL · Erie
- 2024 margin
- Lean D (+9.7) · D 54.8% · R 45.2%
- 2008→2024 swing
- -7.9pp toward R · 2008: 17.5pp · 2024: 9.7pp
- All cycles
- 2024: D+9.7 2020: D+14.7 2016: D+4.8 2012: D+15.6 2008: D+17.5
Not yet ingested
- Civics
- —
Market trends
- HPI YoY
- ▲ 8.06%
- Current HPI
- 457.3935
- Rent YoY
- —
- Metro
- Buffalo-Cheektowaga, NY
- State GDP YoY
- ▲ 2.60%
- F500 in state
- 92
Industry mix (Fortune 500 HQ in NY)
| Industry | F500 HQs | Revenue |
|---|---|---|
| Financial Services | 10 | $950B |
|
||
| Consumer Goods | 9 | $162B |
|
||
| Insurance | 4 | $225B |
|
||
| Telecommunications | 2 | $144B |
|
||
| Pharmaceuticals | 2 | $112B |
|
||
| Media / Entertainment | 2 | $69B |
|
||
Price history
+244.8% since first listed3 events — show timeline
- 2026-03-08 Pending — WNYREIS
- 2026-02-15 Listed $199,999 WNYREIS
- 2005-05-27 Sold (Public Records) $58,000 Public Records
Property tax history
+1.2%/yrLatest (2025): $404 · +0.0% YoY. Source: county tax records.
Cash-flow waterfall
monthlySold comps — $/sqft
last 12 mo · ≤1 miLoading sold comps…