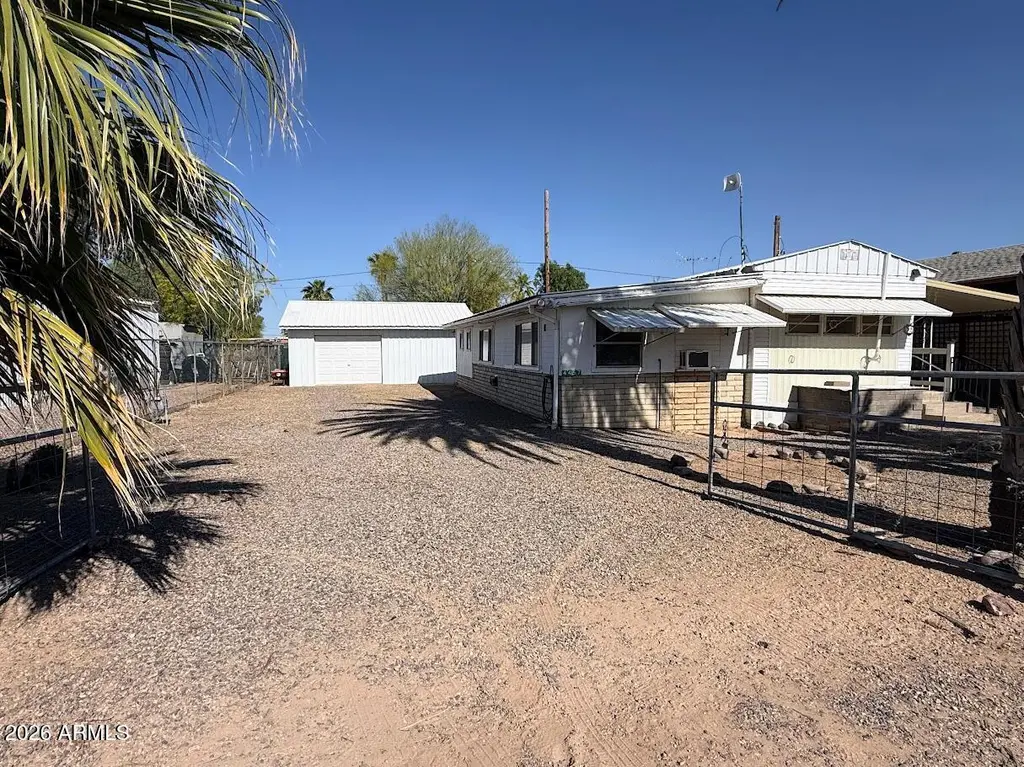
4457 N Lariat Dr · Coolidge, AZ
Flood risk 2/10 · Minimal
- FEMA flood zone
- X (shaded)
- Chance of flooding over 30 yrs
- 0.05%
- Est. flood insurance / yr
- $507 – $1,088
Fire risk 6/10 · Moderate
- Est. fire insurance / yr
- $610 – $1,132
Heat risk 9/10 · Severe
- Hot days now (above 113°F)
- 7 days/yr
- Hot days in 30 yrs
- 19 days/yr
Wind risk 1/10 · Minimal
- Chance of severe wind over 30 yrs
- —
Air-quality risk 1/10 · Minimal
- Unhealthy air days now
- 0 days/yr
- Unhealthy air days in 30 yrs
- 0 days/yr
Risk factors via First Street. Map © Google.
Why this score? — see what drove the B- grade
The composite is a weighted blend of 9 inputs, each scored 0–100. Each bar is that input's sub-score; the figure is the points it added to the 100-point composite (weight × sub-score).
- Cash flow +27.5/30.0
- ARV discount +15.0/15.0
- DSCR +9.6/10.0
- 1% rule +7.5/10.0
- Livability +2.9/5.0
- Rent growth +2.5/5.0
- Condition / age +2.5/5.0
- Schools +1.0/10.0
- Appreciation +0.0/10.0
$150,000
🖨 Deal sheet 📄 Offer letter ✓ Due diligence
Listing remarks MLS
This one is a little different in all the right ways. Offering 3 bedrooms and 2 bathrooms, this property started as a 1972 single-wide manufactured home (originally 2 bed, 1 bath) and has been expanded to include additional living space that truly makes it feel like more than you'd expect. The added-on section gives you a second living area, an additional bedroom, a full bathroom with a walk-in shower, and convenient inside laundry creating flexibility for guests, multi-generational living, or just spreading out. Outside, you'll find a large detached garage with electric, insulation, and a service entry door perfect for projects, storage, or keeping your toys out of the Arizona sun. The fully fenced 6,500 sq ft lot offers privacy, room to move, and no HOA restrictions. Mature trees add shade and character, and there are multiple storage sheds for all your extras. If you're looking for something with space, functionality, and freedom to use it your way, this one is worth a look.
Key facts
- Service entry door
- No hoa restrictions
- Fully fenced lot
Tags
Neighborhood map
What this means for you Summary
Snapshot
- This is a 3-bed/2.0-bath manufactured listed at $150k.
Deal economics
- At list price, monthly cash flow is $443 ($5k/yr) — positive.
- The deal already cash-flows at list — no discount required.
- Meets the 1% rule at list price ($2k rent vs $150k).
- Recommended offer: $141k (6.0% below list) — sets the bar for market timing.
- Cap rate 9.8% vs local median 4.5% in Coolidge — top-decile yield for the area; either an underpriced asset or a hidden risk that comps aren't pricing in. Stress-test before assuming the spread holds.
Location & tenants
- Location reads 57/100 on livability (#235 in AZ) — a working-class tenant base; expect higher turnover. Strengths: cost of living A+, housing A+; Watch: employment D, schools F, amenities F.
- Coolidge Unified District (4442) (town): math 8% / reading 14% proficiency, ranked #229 of 249 in AZ (top 92%) — low school quality limits family demand, transient renter base, plan for 1-2y turnover; 68% free/reduced lunch — lower-income household profile, screen leases tightly.
- Market conditions: 213 active listings in the ZIP; 1 comparable units currently listed for rent nearby; solid renter incomes; 9,504 units permitted in Pinal County in 2024 (776 in 5+ unit buildings).
Forward outlook
- Local home prices are declining (-3.0%/yr); year-one equity from $1k of loan paydown is wiped out by about $4k of value loss. Plan a longer hold.
- At projected returns (-3.0% appreciation + 3.0% rent growth), your $42k cash investment doubles in ~9 years — after that, you're playing with house money.
Negotiation context
- It's been on market 61 days — a 6% lower offer ($141k) is reasonable based on typical stale-listing flexibility.
Risks & watch-outs
- Climate carrying-cost: major wildfire risk; extreme-heat days projected 7→19/yr by 2055 (HVAC capex compounding) — expect insurance premiums to compound above CPI over the hold.
Questions for the listing agent
- It's been on market 61 days. Have you received any prior offers? Is the seller open to a 6% concession, seller financing, or rate buy-down credit?
- Why hasn't it sold? Are there any deal-killer items the seller is aware of (foundation, flood, title, zoning, code violations)?
- Is there a deadline driving the sale (1031 exchange, divorce, estate, relocation)? That informs how much negotiation room exists.
- Schools are F-rated, which usually means shorter tenancies and higher turnover. Who's the typical renter profile here, and what's been the actual vacancy rate?
- What's the average days-on-market for RENTAL listings here right now (not sales)? A rising rental-DOM trend means longer vacancies and softer asking-rent achievability than the comps imply.
- What's the recent tenant-quality profile in this submarket — average credit score on applications, eviction rate, late-payment / NSF rate, and stable-employment percentage? A property-management company in the area should have these aggregated.
- How much new for-sale + rental construction is in the pipeline within 1–3 miles? Heavy new supply typically softens prices + rents 12–24 months out; constrained supply supports both.
Investment metrics
- 1% rule
- 1.25% ✓
- Cap rate
- 9.84%
- Cash-on-cash
- 12.65%
- DSCR
- 1.56
- GRM
- 6.7
CMA / ARV
- ARV (median comp)
- $202,120
- List price
- $150,000
- Delta
- -25.79%
- Verdict
- UNDERPRICED
- Comps
- 12 within 1.0 mi
Show comp detail 6 sales within ~0.75 mi
| Address | Dist | Beds/Ba | Sqft | Sold | Price | $/sf | Match |
|---|---|---|---|---|---|---|---|
| 2683 E Picacho Dr | 0.23mi | 3/2.0 | 1,120 (-3%) | 12mo | $99,000 | $88 | 74 |
| 4525 N Sierra Dr | 0.37mi | 3/2.0 | 1,159 (+0%) | 11mo | $218,500 | $189 | 73 |
| 4545 N Sierra Dr | 0.37mi | 3/2.0 | 1,264 (+9%) | 13mo | $219,000 | $173 | 57 |
| 4565 N Sierra Dr | 0.37mi | 3/2.0 | 1,254 (+8%) | 15mo | $210,000 | $167 | 56 |
| 2744 E Turquoise Trl | 0.18mi | 2/2.0 (-1) | 985 (-15%) | 7mo | $155,000 | $157 | 56 |
| 1975 E Randolph Rd | 0.69mi | 3/2.0 | 1,233 (+7%) | 18mo | $285,000 | $231 | 42 |
Match score weights: distance 35% · size 25% · config 20% · recency 20%. Top-matched comps best support the ARV.
Projected returns pro-forma
-3.0% appreciation · 3.0% rent growth · sell at horizon
- IRR
- 2.4%
- Equity multiple
- 1.09×
- Total profit
- $3,929
- Equity at exit
- $22,365
- IRR
- 12.0%
- Equity multiple
- 1.95×
- Total profit
- $39,858
- Equity at exit
- $12,969
Cash invested: $42,000 (down + closing). Projections, not guarantees.
Landlord ↔ Tenant lean methodology
- Overall (STATE)
- 87 Strongly Landlord-Friendly
- State Arizona
- 87 Strongly Landlord-Friendly · R+3
- County
- — inherits STATE
- City
- — inherits STATE
ZIP-level market 85194
- Home prices YoY
- -24.0%
- Active inventory
- 213
- Price-to-rent
- 6.7×
Monthly cashflow live
- Estimated rent
- $1,873 medium interval (Pro) →
- Mortgage (P&I)
- −$787
- Tax est. 1.5%
- −$188 /mo · $2,250/yr
- Insurance
- −$62
- HOA
- −$0
- Vacancy / Maint / Mgmt
- −$393
- Net cashflow
- $443
Break-even live
UW: 25.0% down · 7.5% · 30yr · 1.5% tax · 5.0% vac · 8.0% maint · 8.0% mgmt
Financing live
Cash to close
- Down payment
- $37,500
- Closing costs
- $4,500
- Reserves months
- —
- Total cash needed
- —
Loan-product check · same deal, 3 products live
Conventional
25% down · 7.5% · 30yr
- Down + closing
- —
- Monthly P&I
- —
- Monthly cashflow
- —
- DSCR
- —
- Eligible?
- —
Personal DTI + credit; lowest rate.
DSCR
20% down · 8.5% · 30yr
- Down + closing
- —
- Monthly P&I
- —
- Monthly cashflow
- —
- DSCR
- —
- Eligible?
- —
No personal income docs; deal must DSCR.
Hard money
10% down · 12.0% · 12mo
- Down + closing
- —
- Monthly P&I
- —
- Monthly cashflow
- —
- DSCR
- —
- Eligible?
- —
Short-term bridge; refi at stabilization.
Rent comps 1 comps
| Address | Beds | Baths | Sqft | Rent | $/sqft | DOM | Units | Dist |
|---|---|---|---|---|---|---|---|---|
| 4577 N Palo Verde Ln Casa Grande, AZ | 4.0 | 2.0 | 1120 | $1,600 | $1.43 | 1d | 1 | 0.14mi |
Listing history 19 events
-
2026-06-18days on market $150,000 Active 61 DOM
-
2026-06-17days on market $150,000 Active 60 DOM
-
2026-06-16days on market $150,000 Active 59 DOM
-
2026-06-15days on market $150,000 Active 58 DOM
-
2026-06-13days on market $150,000 Active 56 DOM
-
2026-06-13days on market $150,000 Active 55 DOM
-
2026-06-09days on market $150,000 Active 52 DOM
-
2026-06-08days on market $150,000 Active 51 DOM
-
2026-06-07days on market $150,000 Active 50 DOM
-
2026-06-04days on market $150,000 Active 47 DOM
-
2026-06-03days on market $150,000 Active 46 DOM
-
2026-06-02days on market $150,000 Active 45 DOM
-
2026-06-01days on market $150,000 Active 44 DOM
-
2026-05-31days on market $150,000 Active 43 DOM
-
2026-04-18$150,000 Active 992-char remark
Show marketing remark (992 chars)
This one is a little different in all the right ways. Offering 3 bedrooms and 2 bathrooms, this property started as a 1972 single-wide manufactured home (originally 2 bed, 1 bath) and has been expanded to include additional living space that truly makes it feel like more than you'd expect. The added-on section gives you a second living area, an additional bedroom, a full bathroom with a walk-in shower, and convenient inside laundry creating flexibility for guests, multi-generational living, or just spreading out. Outside, you'll find a large detached garage with electric, insulation, and a service entry door perfect for projects, storage, or keeping your toys out of the Arizona sun. The fully fenced 6,500 sq ft lot offers privacy, room to move, and no HOA restrictions. Mature trees add shade and character, and there are multiple storage sheds for all your extras. If you're looking for something with space, functionality, and freedom to use it your way, this one is worth a look.
-
2022-05-06soldstatus $160,000
-
2021-06-11soldstatus $45,000
-
2004-04-07soldstatus $44,000
-
1986-06-23soldstatus $21,000
ⓘ Source: listings_history table (triggers on properties + properties_extension) + one-shot
backfill from property_details.listing_events for pre-trigger history.
Climate risk First Street
- Flood 2/10 Low FEMA zone X (shaded) · 5% chance over 30 yrs
- Wildfire 6/10 Major
- Heat 9/10 Extreme 7 d/yr ≥113°F today · 19 d/yr by 30 yrs out
- Wind 1/10 Low
- Air quality 1/10 Low 0 unhealthy d/yr today · 0 by 30 yrs out
Nearby sold comps map
Loading sold comps map…
Walkable amenities ~0.75 mi
Loading nearby amenities…
Taxation est. · year 1
- Rental income
- $22,473
- − Mortgage interest
- −$8,402
- − Property taxes
- −$2,250
- − Insurance
- −$750
- − Repairs & maintenance
- −$1,798
- − Management
- −$1,798
- − Depreciation
- −$4,364
- Taxable income
- $3,112
- Est. tax owed @ 24.0%
- −$747
- After-tax cash flow
- $4,568/yr
For passive investors: Depreciation is non-cash, so a rental often shows a tax loss while cash-flowing — sheltering income. Rental losses are passive: they offset passive income freely, and up to $25,000/yr can offset ordinary (W-2) income if you actively participate and your MAGI is under $100k (phasing out to $0 by $150k); unused losses carry forward. On sale, claimed depreciation is recaptured at up to 25%, and gains may owe capital-gains tax (a 1031 exchange can defer both). Figures are a year-1 estimate at your 24.0% rate — not tax advice; consult a CPA.
Schools (NCES district)
- District
- Coolidge Unified District (4442)
- NCES district ID
- 0402320
- Math proficiency
- 8% ▼ -6.00%
- Reading proficiency
- 14% ▼ -2.00%
- Median HH income
- $49,182
- Composite
- 10.35/100
- National rank
- #9787
- State rank
- #229 of 249 in AZ
Livability — Coolidge
- Score
- 57/100
- State rank
- #235
- US rank
- #22344
Category grades
Schools grade is shown separately in the Schools card above.
Census & demographics
- County
- Pinal County · 399,947 people
- City population
- 19,487
- Metro
- Phoenix-Mesa-Chandler, AZ
- Population (ZIP)
- 8,077
- Household income
- $82,935
- Rent vs Own
- Severe rent burden
- 17.0
Population outlook (Pinal County) Hauer SSP2
- Today (2025)
- 437,574 people
- By 2030
- 446,903 · +2.1%
- By 2040
- 452,589 · +3.4%
- By 2050
- 444,126 · +1.5%
- By 2075
- 430,300 · -1.7%
- By 2100
- 393,536 · -10.1%
Race, ethnicity, and origin ACS 2023
- Neighborhood character
- Predominantly White (66%)
- Race & ethnicity
- White 66% Hispanic / Latino 27% Two or more races 9% Asian 2%
- Hispanic origin (detail)
- Mexican 25%
- Common ancestry
- Portuguese 3% Romanian 3% Lithuanian 2%
- Foreign-born
- 13% · Canada
- Languages at home
- 78% English-only · Spanish 20% Other Asian/Pacific 2%
Political lean MEDSL · Pinal
- 2024 margin
- Strong R (+22.1) · D 38.5% · R 60.6%
- 2008→2024 swing
- -7.6pp toward R · 2008: -14.5pp · 2024: -22.1pp
- All cycles
- 2024: R+22.1 2020: R+17.3 2016: R+19.3 2012: R+17.1 2008: R+14.5
Not yet ingested
- Civics
- —
Market trends
- HPI YoY
- ▼ -79.29%
- Current HPI
- 251.5364
- Rent YoY
- —
- Metro
- Phoenix-Mesa-Chandler, AZ
- State GDP YoY
- ▲ 4.54%
- F500 in state
- 20
Industry mix (Fortune 500 HQ in AZ)
| Industry | F500 HQs | Revenue |
|---|---|---|
| Technology | 2 | $13B |
|
||
| Mining / Metals | 1 | $23B |
|
||
| Environmental Services | 1 | $16B |
|
||
| Metals / Steel | 1 | $14B |
|
||
| Technology Distribution | 1 | $9B |
|
||
| Homebuilding | 1 | $8B |
|
||
Price history
+614.3% since first listed5 events — show timeline
- 2026-04-18 Listed $150,000 ARMLS
- 2022-05-06 Sold (Public Records) $160,000 Public Records
- 2021-06-11 Sold (Public Records) $45,000 Public Records
- 2004-04-07 Sold (Public Records) $44,000 Public Records
- 1986-06-23 Sold (Public Records) $21,000 Public Records
Property tax history
+0.8%/yrLatest (2025): $186 · +4.0% YoY. Source: county tax records.
Cash-flow waterfall
monthlySold comps — $/sqft
last 12 mo · ≤1 miLoading sold comps…