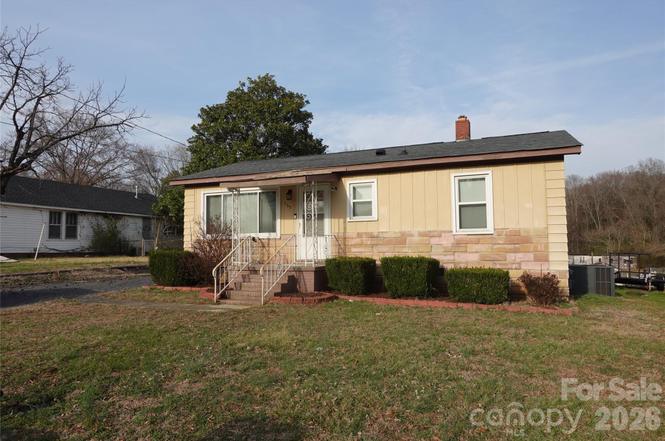
155 Robbins St SW · Concord, NC
Flood risk 1/10 · Minimal
- FEMA flood zone
- X (unshaded)
- Chance of flooding over 30 yrs
- 0.0%
- Est. flood insurance / yr
- $507 – $1,088
Fire risk 1/10 · Minimal
- Est. fire insurance / yr
- $906 – $1,684
Heat risk 6/10 · Moderate
- Hot days now (above 105°F)
- 7 days/yr
- Hot days in 30 yrs
- 17 days/yr
Wind risk 5/10 · Moderate
- Chance of severe wind over 30 yrs
- 22.0%
Air-quality risk 3/10 · Minor
- Unhealthy air days now
- 2 days/yr
- Unhealthy air days in 30 yrs
- 5 days/yr
Risk factors via First Street. Map © Google.
Why this score? — see what drove the F grade
The composite is a weighted blend of 9 inputs, each scored 0–100. Each bar is that input's sub-score; the figure is the points it added to the 100-point composite (weight × sub-score).
- Cash flow +13.0/30.0
- Schools +4.7/10.0
- Livability +4.0/5.0
- DSCR +3.9/10.0
- Rent growth +3.3/5.0
- Condition / age +2.5/5.0
- 1% rule +2.4/10.0
- ARV discount +0.0/15.0
- Appreciation +0.0/10.0
$194,500
🖨 Deal sheet (PDF) 📄 Offer letter ✓ Due diligence
Listing remarks
Welcome home! That's the feel of this 2 bedroom, 1 bath, traditional style home. Completely move-In ready with the exception of a front porch that the owners are preparing for a fresh coat of paint. Situated on 0.22 acres of land with most of it in the fenced in back yard for cookouts or whatever you choose just know you have plenty of space to grow out back. Big ticket improvements that offers future owners a piece of mind includes, new front and rear doors in 2025, back porch where the washer and dryer hook up is was reconstructed in 2025. Double pane windows that fold inward for easy cleaning. New luxury vinyl plank flooring in 2025, new roof in 2024. New vanity and new water heater
Key facts
- 9,583 sq ft lot
- Built 1959
- Listed 100 days
Property features AI
Finance
- HOA & community: No HOA
Exterior
- Parking: Driveway
- Utilities: City water; Public sewer; Electricity connected
- Home design: Single family residence; Residential property; One story; Crawl space foundation; Site-built construction
- Construction: Aluminum and vinyl exterior materials; Site built construction
- Exterior features: Front porch; Back yard fencing; Dirt and paved road access; publicly maintained road
Interior
- Kitchen: Dishwasher; Electric range
- Bedrooms: 2 bedrooms (both on the main level)
- Flooring: Wood floors
- Bathrooms: 1 full bathroom (main level)
- Heating & cooling: Forced air heating (natural gas); Central air conditioning
- Interior features: Insulated windows; Window treatments; Insulated doors; Room count: 1
- Laundry & utility: Laundry area on the porch
Neighborhood map
What this means for you Summary
Snapshot
- This is a 2-bed/1.0-bath single-family listed at $194k.
Deal economics
- At list price, monthly cash flow is $-11 ($-128/yr) — negative.
- To cash-flow at today's rent, offer at most $193k (1.0% below list).
- To meet the 1% rule (rent ≥ 1% of price), the offer needs to be $145k (25.7% below list).
- Recommended offer: $145k (25.7% below list) — sets the bar for 1% rule.
- Cap rate 6.2% vs local median 3.3% in Concord — top-decile yield for the area; either an underpriced asset or a hidden risk that comps aren't pricing in. Stress-test before assuming the spread holds.
Location & tenants
- Location reads 81/100 on livability (#18 in NC, #1,595 nationally) — a professional / high-income tenant draw. Strengths: cost of living A+, housing A+, health & safety A+; Watch: schools C-, commute F.
- Cabarrus County Schools (rural): math 54% / reading 55% proficiency, ranked #44 of 178 in NC (top 25%) — acceptable for families but not a draw, mixed tenant base, ~2y average lease.
- Market conditions: Rents rising (+3.2%/yr); 303 active listings in the ZIP; 21 comparable units currently listed for rent nearby; rentals at typical pace (median 25d on market — plan ~3-4 weeks tenant-placement turnaround); solid renter incomes; 2,485 units permitted in Cabarrus County in 2024 (677 in 5+ unit buildings).
Forward outlook
- Local home prices are declining (-3.0%/yr); year-one equity from $1k of loan paydown is wiped out by about $6k of value loss. Plan a longer hold.
- Cabarrus County population projected at +44% by 2050 — long-run rental-demand tailwind backs the buy-and-hold thesis.
Negotiation context
- It's been on market 101 days — a 9% lower offer ($177k) is reasonable based on typical stale-listing flexibility.
- Current owner paid $28k; list at $194k implies a 582% gain — meaningful room to come down on a strong offer.
Risks & watch-outs
- Watch-outs: built in 1959 — expect roof / HVAC / electrical / plumbing capex.
- Climate carrying-cost: moderate wind risk, 22% chance of damaging wind over 30y; extreme-heat days projected 7→17/yr by 2055 (HVAC capex compounding) — expect insurance premiums to compound above CPI over the hold.
Questions for the listing agent
- What do current leases actually rent for vs. the listed asking? Can we see a recent rent roll and the last 12 months of T-12 income?
- It's been on market 101 days. Have you received any prior offers? Is the seller open to a 26% concession, seller financing, or rate buy-down credit?
- Built in 1959 — when were the roof, HVAC, electrical panel, plumbing, and water heater last replaced?
- Why hasn't it sold? Are there any deal-killer items the seller is aware of (foundation, flood, title, zoning, code violations)?
- Is there a deadline driving the sale (1031 exchange, divorce, estate, relocation)? That informs how much negotiation room exists.
- The area grade is low — what's the realistic commute time and amenity access for the typical tenant pool here? Any planned neighborhood developments (good or bad) we should know about?
- What's the average days-on-market for RENTAL listings here right now (not sales)? A rising rental-DOM trend means longer vacancies and softer asking-rent achievability than the comps imply.
- What's the recent tenant-quality profile in this submarket — average credit score on applications, eviction rate, late-payment / NSF rate, and stable-employment percentage? A property-management company in the area should have these aggregated.
- How much new for-sale + rental construction is in the pipeline within 1–3 miles? Heavy new supply typically softens prices + rents 12–24 months out; constrained supply supports both.
Investment metrics
- 1% rule
- 0.74% ✗
- Cap rate
- 6.23%
- Cash-on-cash
- -0.24%
- DSCR
- 0.99
- GRM
- 11.2
CMA / ARV
- ARV (on-the-fly)
- $133,000
- Comps found
- 12
Show comp detail 12 sales within ~0.75 mi
| Address | Dist | Beds/Ba | Sqft | Sold | Price | $/sf | Match |
|---|---|---|---|---|---|---|---|
| 302 Melrose Dr SW | 0.26mi | 2/1.0 | 896 (+2%) | 5mo | $100,000 | $112 | 80 |
| 210 Mahan St SW | 0.37mi | 2/1.0 | 891 (+2%) | 3mo | $72,500 | $81 | 77 |
| 144 Robbins St SW | 0.04mi | 2/1.0 | 968 (+11%) | 6mo | $235,000 | $243 | 76 |
| 44 Fenix Dr SW | 0.39mi | 2/1.0 | 881 (+1%) | 9mo | $170,000 | $193 | 73 |
| 101 Woody Ct SW | 0.52mi | 3/1.0 (+1) | 868 (-1%) | 1mo | $85,400 | $98 | 68 |
| 294 Broad Dr SW | 0.53mi | 2/1.0 | 837 (-4%) | 1mo | $168,000 | $201 | 67 |
| 124 Powder St SW | 0.08mi | 2/1.0 | 982 (+12%) | 11mo | $120,000 | $122 | 66 |
| 144 Melba Ave SW | 0.21mi | 3/1.0 (+1) | 951 (+9%) | 10mo | $136,000 | $143 | 62 |
| 136 Melba Ave SW | 0.23mi | 3/1.0 (+1) | 968 (+11%) | 5mo | $159,000 | $164 | 62 |
| 196 Princess Ave SW | 0.29mi | 3/1.0 (+1) | 958 (+10%) | 8mo | $207,900 | $217 | 59 |
| 272 Malvern Dr | 0.27mi | 2/1.0 | 796 (-9%) | 16mo | $84,000 | $106 | 59 |
| 102 Swink St | 0.65mi | 1/1.0 (-1) | 755 (-14%) | 19mo | $115,000 | $152 | 26 |
Match score weights: distance 35% · size 25% · config 20% · recency 20%. Top-matched comps best support the ARV.
Projected returns pro-forma
-3.0% appreciation · 3.23% rent growth · sell at horizon
- IRR
- -16.5%
- Equity multiple
- 0.41×
- Total profit
- $-31,959
- Equity at exit
- $29,001
- IRR
- -8.1%
- Equity multiple
- 0.49×
- Total profit
- $-27,713
- Equity at exit
- $16,817
Cash invested: $54,460 (down + closing). Projections, not guarantees.
Landlord ↔ Tenant lean methodology
- Overall (STATE)
- 85 Strongly Landlord-Friendly
- State North Carolina
- 85 Strongly Landlord-Friendly · R+3
- County
- — inherits STATE
- City
- — inherits STATE
ZIP-level market 28025
- Rents YoY
- 3.2%
- Active inventory
- 303
- Price-to-rent
- 11.2×
Monthly cashflow live
- Estimated rent
- $1,445 high interval (Pro) →
- Mortgage (P&I)
- −$1,020
- Tax from tax record
- −$52 /mo · $618/yr
- Insurance
- −$81
- HOA
- −$0
- Vacancy / Maint / Mgmt
- −$304
- Net cashflow
- $-11
Break-even live
Sensitivity live
| Price | -10% $99 | -5% $44 | +0% $-11 | +5% $-66 | +10% $-121 |
|---|---|---|---|---|---|
| Rent | -10% $-125 | -5% $-68 | +0% $-11 | +5% $46 | +10% $103 |
| Rate | -1.0pp $87 | -0.5pp $39 | base $-11 | +0.5pp $-61 | +1.0pp $-112 |
UW: 25.0% down · 7.5% · 30yr · 1.5% tax · 5.0% vac · 8.0% maint · 8.0% mgmt
Financing live
Cash to close
- Down payment
- $48,625
- Closing costs
- $5,835
- Reserves months
- —
- Total cash needed
- —
Loan-product check · same deal, 3 products live
Conventional
25% down · 7.5% · 30yr
- Down + closing
- —
- Monthly P&I
- —
- Monthly cashflow
- —
- DSCR
- —
- Eligible?
- —
Personal DTI + credit; lowest rate.
DSCR
20% down · 8.5% · 30yr
- Down + closing
- —
- Monthly P&I
- —
- Monthly cashflow
- —
- DSCR
- —
- Eligible?
- —
No personal income docs; deal must DSCR.
Hard money
10% down · 12.0% · 12mo
- Down + closing
- —
- Monthly P&I
- —
- Monthly cashflow
- —
- DSCR
- —
- Eligible?
- —
Short-term bridge; refi at stabilization.
Rent comps 21 comps
| Address | Beds | Baths | Sqft | Rent | $/sqft | DOM | Units | Dist |
|---|---|---|---|---|---|---|---|---|
| 179 Booker Dr SW Concord, NC | 3.0 | 1.0 | 776 | $1,050 | $1.35 | 23d | 1 | 0.36mi |
| 91 Sunderland Rd SW Unit 93 Concord, NC | 2.0 | 1.0 | 829 | $1,225 | $1.48 | 25d | 1 | 0.60mi |
| 93 Sunderland Rd SW Concord, NC | 2.0 | 2.0 | 828 | $1,225 | $1.48 | 25d | 1 | 0.61mi |
| 357 Freedom St SW Unit 4A Concord, NC | 2.0 | 1.0 | 832 | $1,150 | $1.38 | 25d | 1 | 0.61mi |
| 373 Spring St SW Unit 1 Concord, NC | 1.0 | 1.0 | 624 | $1,260 | $2.02 | 16d | 1 | 0.75mi |
| 52 Union St S Concord, NC | 1.0 | 1.0 | 658 | $1,650 | $2.51 | 25d | 1 | 0.78mi |
| 23 Market St SW Concord, NC | 2.0 | 1.0–2.0 | 940 | $2,470 | $2.63 | 11d | 118 | 0.79mi |
| 14 Union St S Unit 505 Concord, NC | 1.0 | 1.0 | 550 | $1,300 | $2.36 | 25d | 1 | 0.81mi |
| 14 Union St S Unit 308 Concord, NC | 1.0 | 1.0 | 560 | $1,400 | $2.50 | 25d | 1 | 0.81mi |
| 14 Union St N Concord, NC | 1.0 | 1.0 | 472 | $1,400 | $2.96 | 0d | 3 | 0.85mi |
| 275 Academy Ave NW Concord, NC | 1.0 | 1.0 | 566 | $1,180 | $2.08 | 17d | 1 | 0.88mi |
| 275 Academy Ave NW Concord, NC | 1.0 | 1.0 | 566 | $1,180 | $2.08 | 6d | 1 | 0.88mi |
| 106 Wilshire Ave SW Unit 1 Concord, NC | 1.0 | 1.0 | 750 | $1,100 | $1.47 | 6d | 1 | 0.89mi |
| 299 Brunting Ln SW Concord, NC | 3.0 | 1.0 | 1059 | $1,500 | $1.42 | 25d | 4 | 0.95mi |
| 220 Odell Dr NW Concord, NC | 1.0 | 1.0 | 700 | $1,100 | $1.57 | 25d | 1 | 0.99mi |
| 100 Concord Chase Cir SW Concord, NC | 2.0–3.0 | 1.0–2.0 | 972 | $1,230 | $1.27 | 25d | 1 | 1.14mi |
| 67 Grattan Dr NE Concord, NC | 1.0 | 1.0 | 605 | $1,050 | $1.74 | 25d | 1 | 1.18mi |
| 393 Kerr St NW Concord, NC | 1.0 | 1.0 | 1050 | $650 | $0.62 | 25d | 1 | 1.31mi |
| 14 Highland Ave SW Concord, NC | 2.0 | 1.0 | 864 | $1,349 | $1.56 | 25d | 1 | 1.31mi |
| 220 Highland Ave SW Concord, NC | 2.0 | 1.0 | 838 | $2,200 | $2.63 | 25d | 1 | 1.37mi |
| 1 Buffalo Ave NW Concord, NC | 2.0–3.0 | 1.5–2.0 | 1179 | $1,200 | $1.02 | 11d | 6 | 1.38mi |
Listing history 18 events
-
2026-06-21days on market $194,500 Active 101 DOM
-
2026-06-18days on market $194,500 Active 98 DOM
-
2026-06-17days on market $194,500 Active 97 DOM
-
2026-06-16days on market $194,500 Active 96 DOM
-
2026-06-15days on market $194,500 Active 95 DOM
-
2026-06-13days on market $194,500 Active 93 DOM
-
2026-06-09days on market $194,500 Active 89 DOM
-
2026-06-08days on market $194,500 Active 88 DOM
-
2026-06-07days on market $194,500 Active 87 DOM
-
2026-06-04days on market $194,500 Active 84 DOM
-
2026-06-03days on market $194,500 Active 83 DOM
-
2026-06-02days on market $194,500 Active 82 DOM
-
2026-06-01days on market $194,500 Active 81 DOM
-
2026-05-31days on market $194,500 Active 80 DOM
-
2026-04-19price $199,500
-
2026-03-13$210,500 Active
-
2026-02-27historical $210,500
-
1997-06-01soldstatus $28,500
ⓘ Source: listings_history table (triggers on properties + properties_extension) + one-shot
backfill from property_details.listing_events for pre-trigger history.
Tax reassessment forecast NC · Resets to sale price
- Current annual tax
- $618 · $52/mo
- Projected year-2 tax
- $1,595 · $133/mo
- Expected delta
- +$977/yr (+$81/mo · 157.9%)
ⓘ Screening estimate from a state-policy table — verify with the county assessor before closing.
Climate risk First Street
- Flood 1/10 Low FEMA zone X (unshaded) · 0% chance over 30 yrs
- Wildfire 1/10 Low
- Heat 6/10 Major 7 d/yr ≥105°F today · 17 d/yr by 30 yrs out
- Wind 5/10 Major 22% chance of damaging wind over 30 yrs
- Air quality 3/10 Moderate 2 unhealthy d/yr today · 5 by 30 yrs out
Nearby sold comps map
Loading sold comps map…
Walkable amenities ~0.75 mi
Loading nearby amenities…
Taxation est. · year 1
- Rental income
- $17,345
- − Mortgage interest
- −$10,895
- − Property taxes
- −$618
- − Insurance
- −$972
- − Repairs & maintenance
- −$1,388
- − Management
- −$1,388
- − Depreciation
- −$5,658
- Taxable loss
- −$3,574
- Est. tax savings @ 24.0%
- +$858
- After-tax cash flow
- $730/yr
For passive investors: Depreciation is non-cash, so a rental often shows a tax loss while cash-flowing — sheltering income. Rental losses are passive: they offset passive income freely, and up to $25,000/yr can offset ordinary (W-2) income if you actively participate and your MAGI is under $100k (phasing out to $0 by $150k); unused losses carry forward. On sale, claimed depreciation is recaptured at up to 25%, and gains may owe capital-gains tax (a 1031 exchange can defer both). Figures are a year-1 estimate at your 24.0% rate — not tax advice; consult a CPA.
Schools (NCES district)
- District
- Cabarrus County Schools
- NCES district ID
- 3700530
- Math proficiency
- 54% ▲ 4.00%
- Reading proficiency
- 55% ▲ 3.00%
- Median HH income
- $59,442
- Composite
- 47.42/100
- National rank
- #2282
- State rank
- #44 of 178 in NC
Livability — Concord
- Score
- 81/100
- State rank
- #18
- US rank
- #1595
Category grades
Schools grade is shown separately in the Schools card above.
Census & demographics
- Census place
- Concord, NC
- County
- Cabarrus County · 218,793 people
- City population
- 140,106
- Metro
- Charlotte-Concord-Gastonia, NC-SC
- Population (ZIP)
- 58,334
- Household income
- $79,545
- Rent vs Own
- Severe rent burden
- 1852.0
Population outlook (Cabarrus County) Hauer SSP2
- Today (2025)
- 239,273 people
- By 2030
- 260,754 · +9.0%
- By 2040
- 303,953 · +27.0%
- By 2050
- 344,827 · +44.1%
- By 2075
- 435,623 · +82.1%
- By 2100
- 490,119 · +104.8%
Race, ethnicity, and origin ACS 2023
- Neighborhood character
- Diverse neighborhood (Simpson 0.57)
- Race & ethnicity
- White 61% Black 21% Hispanic / Latino 13% Two or more races 8% Asian 1%
- Hispanic origin (detail)
- Mexican 7% Puerto Rican 1%
- Common ancestry
- Serbian 2% Italian 2% Slovak 1%
- Foreign-born
- 7% · Canada
- Languages at home
- 89% English-only · Spanish 9%
Political lean MEDSL · Cabarrus
- 2024 margin
- Lean R (+7.7) · D 45.5% · R 53.2% · Other 1.3%
- 2008→2024 swing
- +10.7pp toward D · 2008: -18.4pp · 2024: -7.7pp
- All cycles
- 2024: R+7.7 2020: R+9.4 2016: R+20.0 2012: R+20.2 2008: R+18.4
Not yet ingested
- Civics
- —
Market trends
- HPI YoY
- ▼ -282.07%
- Current HPI
- 258.1615
- Rent YoY
- ▲ 3.23%
- Metro
- Charlotte-Concord-Gastonia, NC-SC
- State GDP YoY
- ▲ 3.28%
- F500 in state
- 26
Industry mix (Fortune 500 HQ in NC)
| Industry | F500 HQs | Revenue |
|---|---|---|
| Financial Services | 2 | $213B |
|
||
| Retail | 2 | $95B |
|
||
| Industrial Conglomerate | 1 | $38B |
|
||
| Metals / Steel | 1 | $35B |
|
||
| Utilities | 1 | $30B |
|
||
| Industrial Machinery | 1 | $19B |
|
||
Price history
+600.0% since first listed4 events — show timeline
- 2026-04-19 Price Changed $199,500 CANOPYMLS as Distributed by MLS Grid
- 2026-03-13 Listed $210,500 CANOPYMLS as Distributed by MLS Grid
- 2026-02-27 Coming Soon $210,500 CANOPYMLS as Distributed by MLS Grid
- 1997-06-01 Sold (Public Records) $28,500 Public Records
Property tax history
-1.2%/yrLatest (2025): $618 · +0.0% YoY. Source: county tax records.
Cash-flow waterfall
monthlySold comps — $/sqft
last 12 mo · ≤1 miLoading sold comps…