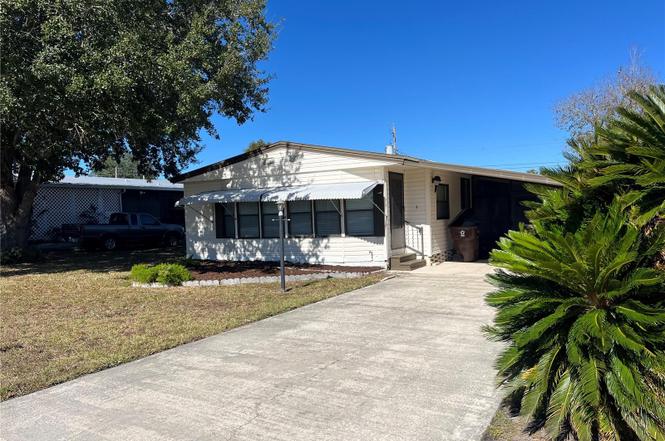
310 Martin Dr · Lakeland, FL
Flood risk 1/10 · Minimal
- FEMA flood zone
- X (unshaded)
- Chance of flooding over 30 yrs
- 0.0%
- Est. flood insurance / yr
- $507 – $1,088
Fire risk 5/10 · Moderate
- Est. fire insurance / yr
- $947 – $1,759
Heat risk 8/10 · Major
- Hot days now (above 108°F)
- 7 days/yr
- Hot days in 30 yrs
- 23 days/yr
Wind risk 9/10 · Severe
- Chance of severe wind over 30 yrs
- 99.0%
Air-quality risk 2/10 · Minimal
- Unhealthy air days now
- 1 days/yr
- Unhealthy air days in 30 yrs
- 1 days/yr
Risk factors via First Street. Map © Google.
Why this score? — see what drove the B- grade
The composite is a weighted blend of 9 inputs, each scored 0–100. Each bar is that input's sub-score; the figure is the points it added to the 100-point composite (weight × sub-score).
- Cash flow +30.0/30.0
- 1% rule +10.0/10.0
- DSCR +10.0/10.0
- ARV discount +7.5/15.0
- Livability +3.9/5.0
- Schools +3.5/10.0
- Rent growth +2.7/5.0
- Condition / age +2.5/5.0
- Appreciation +0.0/10.0
$109,000
🖨 Deal sheet 📄 Offer letter ✓ Due diligence
Listing remarks
Inviting Home in a vibrant 55+ community! This spacious 2-bedroom, 2-bath residence offers 1,248 sq ft of comfortable living, thoughtfully designed for easy Florida living. Enjoy abundant storage with a shed behind the home and additional storage connected to the carport. Relax on your screened patio, perfect for morning coffee or evening breezes, with direct access to your carport for added convenience. The community features a sparkling pool, shuffleboard courts, and a clubhouse accessible by golf cart—making it easy to enjoy an active, social lifestyle. Set on a . 17-acre lot, this home is being sold furnished and is currently vacant, offering the opportunity for a quick closing an
Key facts
- Screened patio
- Shuffleboard courts
- Abundant storage
Tags
Property features AI
Finance
- Other: Partially furnished; Living area about 1,248 square feet; Lot approximately 0.17 acres (60 x 126)
- Financial info: Total monthly fees $46; total annual fees $552; Lease restrictions apply
- HOA & community: Martin Estates / Donna Douglas homeowners association; Monthly HOA $46 (required; approval required); Community clubhouse, pool, shuffleboard court; Golf carts allowed; Senior community; Pets allowed with restrictions
Exterior
- Parking: Carport (1 space)
- Utilities: Public water; Septic tank sewer; Electricity connected; Cable available
- Home design: Manufactured home (double wide); One story; Home faces south; Entry on crawlspace foundation
- Construction: Vinyl siding; Metal roof; Crawlspace foundation; Built as a double wide manufactured home
- Exterior features: Storage; Asphalt road access
Interior
- Kitchen: Dishwasher; Range; Range hood; Microwave; Refrigerator
- Bedrooms: 2 bedrooms
- Flooring: Carpet; Vinyl
- Bathrooms: 2 full bathrooms
- Heating & cooling: Central heating; Central air conditioning
- Interior features: Open floorplan; Programmable thermostat; Walk-in closet(s); 3 total rooms
- Laundry & utility: In-unit laundry (washer and dryer included)
Neighborhood map
What this means for you Summary
Snapshot
- This is a 2-bed/2.0-bath manufactured listed at $109k.
Deal economics
- At list price, monthly cash flow is $599 ($7k/yr) — positive.
- The deal already cash-flows at list — no discount required.
- Meets the 1% rule at list price ($2k rent vs $109k).
- Recommended offer: $96k (12.0% below list) — sets the bar for market timing.
Location & tenants
- Location reads 77/100 on livability (#206 in FL, #3,179 nationally) — a middle-class / working-renter tenant base. Strengths: cost of living A+, housing A+, health & safety A+; Watch: employment D+, amenities F, commute F.
- Polk (suburban): math 39% / reading 43% proficiency, ranked #62 of 73 in FL (top 85%) — families likely to look elsewhere, expect single-tenant / working-renter base with shorter leases.
- Market conditions: Rents flat; 259 active listings in the ZIP; 19 comparable units currently listed for rent nearby; rentals at typical pace (median 24d on market — plan ~3-4 weeks tenant-placement turnaround); 10,384 units permitted in Polk County in 2024 (1,716 in 5+ unit buildings).
- This rent runs 30% of the median local income ($70k/yr) — at the standard rent-burdened threshold; future hikes will face affordability resistance.
Forward outlook
- Local home prices are declining (-3.0%/yr); year-one equity from $754 of loan paydown is wiped out by about $3k of value loss. Plan a longer hold.
- Polk County population projected at +33% by 2050 — long-run rental-demand tailwind backs the buy-and-hold thesis.
- At projected returns (-3.0% appreciation + 0.7% rent growth), your $31k cash investment doubles in ~6 years — after that, you're playing with house money.
Negotiation context
- It's been on market 198 days — a 12% lower offer ($96k) is reasonable based on typical stale-listing flexibility.
Risks & watch-outs
- Climate carrying-cost: severe wind risk, 99% chance of damaging wind over 30y; moderate wildfire risk; extreme-heat days projected 7→23/yr by 2055 (HVAC capex compounding) — expect insurance premiums to compound above CPI over the hold.
Questions for the listing agent
- It's been on market 198 days. Have you received any prior offers? Is the seller open to a 12% concession, seller financing, or rate buy-down credit?
- What does the HOA fee cover, when was the last increase, and are there any pending special assessments or reserve-fund shortfalls?
- Why hasn't it sold? Are there any deal-killer items the seller is aware of (foundation, flood, title, zoning, code violations)?
- Is there a deadline driving the sale (1031 exchange, divorce, estate, relocation)? That informs how much negotiation room exists.
- What's the average days-on-market for RENTAL listings here right now (not sales)? A rising rental-DOM trend means longer vacancies and softer asking-rent achievability than the comps imply.
- What's the recent tenant-quality profile in this submarket — average credit score on applications, eviction rate, late-payment / NSF rate, and stable-employment percentage? A property-management company in the area should have these aggregated.
- How much new for-sale + rental construction is in the pipeline within 1–3 miles? Heavy new supply typically softens prices + rents 12–24 months out; constrained supply supports both.
Investment metrics
- 1% rule
- 1.61% ✓
- Cap rate
- 12.89%
- Cash-on-cash
- 23.55%
- DSCR
- 2.05
- GRM
- 5.2
CMA / ARV
No comps found within radius.
Projected returns pro-forma
-3.0% appreciation · 0.65% rent growth · sell at horizon
- IRR
- 13.9%
- Equity multiple
- 1.54×
- Total profit
- $16,475
- Equity at exit
- $16,252
- IRR
- 20.8%
- Equity multiple
- 2.57×
- Total profit
- $47,790
- Equity at exit
- $9,424
Cash invested: $30,520 (down + closing). Projections, not guarantees.
Landlord ↔ Tenant lean methodology
- Overall (STATE)
- 87 Strongly Landlord-Friendly
- State Florida
- 87 Strongly Landlord-Friendly · R+3
- County
- — inherits STATE
- City
- — inherits STATE
ZIP-level market 33809
- Home prices YoY
- -20.9%
- Rents YoY
- 0.7%
- Active inventory
- 259
- Price-to-rent
- 5.2×
Monthly cashflow live
- Estimated rent
- $1,754 high interval (Pro) →
- Mortgage (P&I)
- −$572
- Tax from tax record
- −$123 /mo · $1,482/yr
- Insurance
- −$45
- HOA
- −$46
- Vacancy / Maint / Mgmt
- −$368
- Net cashflow
- $599
Break-even live
UW: 25.0% down · 7.5% · 30yr · 1.5% tax · 5.0% vac · 8.0% maint · 8.0% mgmt
Financing live
Cash to close
- Down payment
- $27,250
- Closing costs
- $3,270
- Reserves months
- —
- Total cash needed
- —
Loan-product check · same deal, 3 products live
Conventional
25% down · 7.5% · 30yr
- Down + closing
- —
- Monthly P&I
- —
- Monthly cashflow
- —
- DSCR
- —
- Eligible?
- —
Personal DTI + credit; lowest rate.
DSCR
20% down · 8.5% · 30yr
- Down + closing
- —
- Monthly P&I
- —
- Monthly cashflow
- —
- DSCR
- —
- Eligible?
- —
No personal income docs; deal must DSCR.
Hard money
10% down · 12.0% · 12mo
- Down + closing
- —
- Monthly P&I
- —
- Monthly cashflow
- —
- DSCR
- —
- Eligible?
- —
Short-term bridge; refi at stabilization.
Rent comps 19 comps
| Address | Beds | Baths | Sqft | Rent | $/sqft | DOM | Units | Dist |
|---|---|---|---|---|---|---|---|---|
| 111 Lindale St Lakeland, FL | 3.0 | 2.0 | 1400 | $2,350 | $1.68 | 23d | 1 | 0.35mi |
| 142 Lindale St Lakeland, FL | 3.0 | 2.0 | 1480 | $1,895 | $1.28 | 23d | 1 | 0.41mi |
| 8039 Ridgeglen Cir E Lakeland, FL | 3.0 | 2.0 | 1384 | $1,895 | $1.37 | 10d | 1 | 0.56mi |
| 734 Fox Lake Dr Lakeland, FL | 3.0 | 2.0 | 1337 | $1,910 | $1.43 | 3d | 1 | 0.97mi |
| 858 Fox Lake Dr Unit 858 Lakeland, FL | 3.0 | 2.0 | 1302 | $1,495 | $1.15 | 10d | 1 | 0.99mi |
| 236 Village Crest Ct Lakeland, FL | 2.0 | 2.0 | 1142 | $1,550 | $1.36 | 13d | 1 | 1.03mi |
| 239 Village Crest Ct Lakeland, FL | 2.0 | 2.0 | 912 | $1,495 | $1.64 | 23d | 1 | 1.06mi |
| 114 Rosalynn Cir Lakeland, FL | 2.0 | 2.0 | 1033 | $1,450 | $1.40 | 23d | 1 | 1.08mi |
| 124 Rosalynn Cir Lakeland, FL | 2.0 | 2.0 | 1033 | $1,550 | $1.50 | 3d | 1 | 1.09mi |
| 6268 Sandpipers Dr Lakeland, FL | 2.0 | 2.0 | 1484 | $1,995 | $1.34 | 23d | 1 | 1.10mi |
| 259 Village View Ln Lakeland, FL | 2.0 | 2.0 | 885 | $1,600 | $1.81 | 23d | 1 | 1.12mi |
| 235 Leelon Rd Lakeland, FL | 2.0 | 1.0 | 921 | $1,295 | $1.41 | 23d | 1 | 1.20mi |
| 6131 Doe Cir E Lakeland, FL | 3.0 | 2.0 | 1353 | $1,700 | $1.26 | 14d | 1 | 1.22mi |
| 8006 Brookeshire Dr Lakeland, FL | 3.0 | 2.0 | 1301 | $1,890 | $1.45 | 19d | 1 | 1.26mi |
| 165 Shannon Dr Lakeland, FL | 2.0 | 2.0 | 1008 | $1,350 | $1.34 | 3d | 1 | 1.28mi |
| 5818 Bambi Dr Lakeland, FL | 3.0 | 2.0 | 1401 | $2,200 | $1.57 | 23d | 1 | 1.29mi |
| 6031 Crafton Dr Lakeland, FL | 2.0 | 1.0 | 914 | $1,125 | $1.23 | 14d | 1 | 1.37mi |
| 6032 Norton Rd Unit 6032 Lakeland, FL | 2.0 | 2.0 | 880 | $1,295 | $1.47 | 23d | 1 | 1.44mi |
| 206 Mary Catherine Ct Lakeland, FL | 3.0 | 2.0 | 1254 | $1,725 | $1.38 | 23d | 1 | 1.46mi |
HOA detail
- Monthly dues
- $46 · $552/yr
- Likely covers
- pool
Listing history 16 events
-
2026-06-18days on market $109,000 Active 198 DOM
-
2026-06-17days on market $109,000 Active 197 DOM
-
2026-06-16days on market $109,000 Active 196 DOM
-
2026-06-15days on market $109,000 Active 195 DOM
-
2026-06-13days on market $109,000 Active 193 DOM
-
2026-06-10days on market $109,000 Active 190 DOM
-
2026-06-09days on market $109,000 Active 189 DOM
-
2026-06-08days on market $109,000 Active 188 DOM
-
2026-06-07days on market $109,000 Active 187 DOM
-
2026-06-05days on market $109,000 Active 184 DOM
-
2026-06-03days on market $109,000 Active 182 DOM
-
2026-06-01days on market $109,000 Active 181 DOM
-
2026-05-31days on market $109,000 Active 180 DOM
-
2026-05-18price $109,000
-
2026-03-10price $119,000
-
2025-12-02$129,000 Active
ⓘ Source: listings_history table (triggers on properties + properties_extension) + one-shot
backfill from property_details.listing_events for pre-trigger history.
Tax reassessment forecast FL · Resets to sale price
- Current annual tax
- $1,482 · $123/mo
- Projected year-2 tax
- $1,482 · $123/mo
- Expected delta
- $0/yr ($0/mo · 0.0%)
ⓘ Screening estimate from a state-policy table — verify with the county assessor before closing.
Climate risk First Street
- Flood 1/10 Low FEMA zone X (unshaded) · 0% chance over 30 yrs
- Wildfire 5/10 Major
- Heat 8/10 Severe 7 d/yr ≥108°F today · 23 d/yr by 30 yrs out
- Wind 9/10 Extreme 99% chance of damaging wind over 30 yrs
- Air quality 2/10 Low 1 unhealthy d/yr today · 1 by 30 yrs out
Nearby sold comps map
Loading sold comps map…
Walkable amenities ~0.75 mi
Loading nearby amenities…
Taxation est. · year 1
- Rental income
- $21,043
- − Mortgage interest
- −$6,106
- − Property taxes
- −$1,482
- − Insurance
- −$545
- − Repairs & maintenance
- −$1,683
- − Management
- −$1,683
- − HOA
- −$552
- − Depreciation
- −$3,171
- Taxable income
- $5,821
- Est. tax owed @ 24.0%
- −$1,397
- After-tax cash flow
- $5,789/yr
For passive investors: Depreciation is non-cash, so a rental often shows a tax loss while cash-flowing — sheltering income. Rental losses are passive: they offset passive income freely, and up to $25,000/yr can offset ordinary (W-2) income if you actively participate and your MAGI is under $100k (phasing out to $0 by $150k); unused losses carry forward. On sale, claimed depreciation is recaptured at up to 25%, and gains may owe capital-gains tax (a 1031 exchange can defer both). Figures are a year-1 estimate at your 24.0% rate — not tax advice; consult a CPA.
Schools (NCES district)
- District
- Polk
- NCES district ID
- 1201590
- Math proficiency
- 39% ▼ -11.00%
- Reading proficiency
- 43% ▼ -4.00%
- Median HH income
- $43,979
- Composite
- 34.74/100
- National rank
- #5132
- State rank
- #62 of 73 in FL
Livability — Lakeland
- Score
- 77/100
- State rank
- #206
- US rank
- #3179
Category grades
Schools grade is shown separately in the Schools card above.
Census & demographics
- County
- Polk County · 740,051 people
- City population
- 277,690
- Metro
- Lakeland-Winter Haven, FL
- Population (ZIP)
- 30,797
- Household income
- $70,066
- Rent vs Own
- Severe rent burden
- 924.0
Population outlook (Polk County) Hauer SSP2
- Today (2025)
- 752,975 people
- By 2030
- 804,621 · +6.9%
- By 2040
- 906,117 · +20.3%
- By 2050
- 1,000,476 · +32.9%
- By 2075
- 1,197,520 · +59.0%
- By 2100
- 1,271,518 · +68.9%
Race, ethnicity, and origin ACS 2023
- Neighborhood character
- Diverse neighborhood (Simpson 0.55)
- Race & ethnicity
- White 63% Hispanic / Latino 18% Black 11% Two or more races 11% Asian 3%
- Hispanic origin (detail)
- Puerto Rican 9% Cuban 1% Dominican 2%
- Common ancestry
- Lithuanian 2% Italian 2% Romanian 2%
- Foreign-born
- 11% · Canada, Jamaica
- Languages at home
- 81% English-only · Spanish 15% Other Asian/Pacific 2% Other Indo-European 1%
Political lean MEDSL · Polk
- 2024 margin
- Strong R (+20.7) · D 39.2% · R 59.9%
- 2008→2024 swing
- -14.6pp toward R · 2008: -6.1pp · 2024: -20.7pp
- All cycles
- 2024: R+20.7 2020: R+14.4 2016: R+14.1 2012: R+6.8 2008: R+6.1
Not yet ingested
- Civics
- —
Market trends
- HPI YoY
- ▼ -79.46%
- Current HPI
- 301.3054
- Rent YoY
- ▲ 0.65%
- Metro
- Lakeland-Winter Haven, FL
- State GDP YoY
- ▲ 3.28%
- F500 in state
- 36
Industry mix (Fortune 500 HQ in FL)
| Industry | F500 HQs | Revenue |
|---|---|---|
| Industrial Technology | 2 | $29B |
|
||
| Insurance | 2 | $17B |
|
||
| Retail | 1 | $60B |
|
||
| Technology Distribution | 1 | $58B |
|
||
| Homebuilding | 1 | $35B |
|
||
| Technology Manufacturing | 1 | $35B |
|
||
Price history
-15.5% since first listed3 events — show timeline
- 2026-05-18 Price Changed $109,000 Stellar MLS as Distributed by MLS Grid
- 2026-03-10 Price Changed $119,000 Stellar MLS as Distributed by MLS Grid
- 2025-12-02 Listed $129,000 Stellar MLS as Distributed by MLS Grid
Property tax history
+6.8%/yrLatest (2025): $1,482 · +17.0% YoY. Source: county tax records.
Cash-flow waterfall
monthlySold comps — $/sqft
last 12 mo · ≤1 miLoading sold comps…