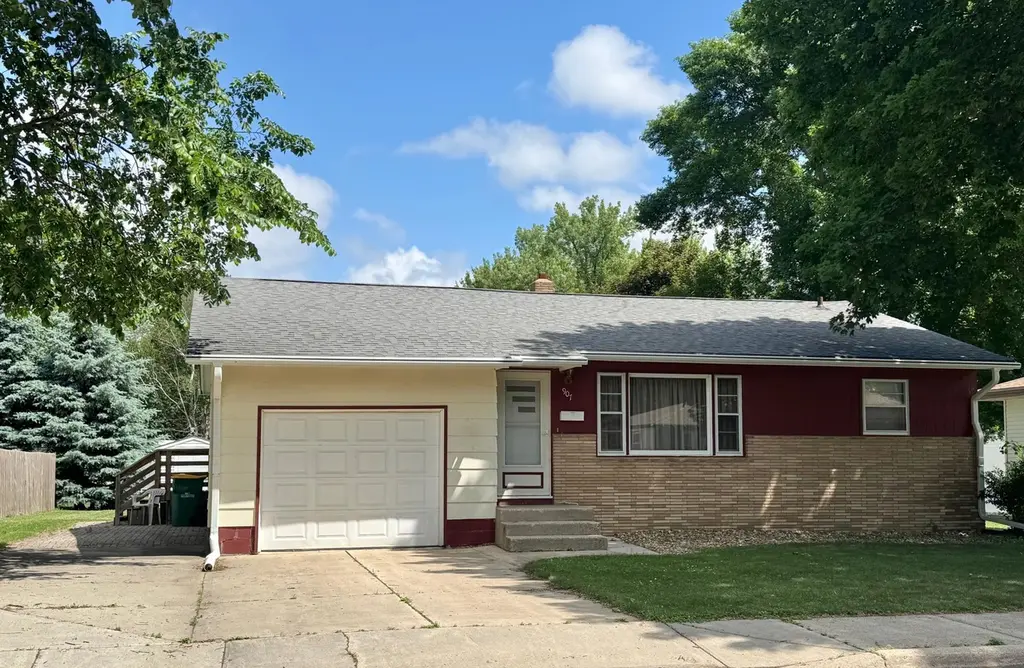
907 Poplar Ave · Marshall, MN
Flood risk 3/10 · Minor
- FEMA flood zone
- X
- Chance of flooding over 30 yrs
- 0.1%
- Est. flood insurance / yr
- $473 – $860
Fire risk 1/10 · Minimal
- Est. fire insurance / yr
- $888 – $1,650
Heat risk 2/10 · Minimal
- Hot days now (above 98°F)
- 7 days/yr
- Hot days in 30 yrs
- 14 days/yr
Wind risk 2/10 · Minimal
- Chance of severe wind over 30 yrs
- —
Air-quality risk 1/10 · Minimal
- Unhealthy air days now
- 0 days/yr
- Unhealthy air days in 30 yrs
- 0 days/yr
Risk factors via First Street. Map © Google.
Why this score? — see what drove the C grade
The composite is a weighted blend of 9 inputs, each scored 0–100. Each bar is that input's sub-score; the figure is the points it added to the 100-point composite (weight × sub-score).
- Cash flow +24.0/30.0
- DSCR +7.7/10.0
- ARV discount +7.5/15.0
- 1% rule +5.7/10.0
- Livability +4.1/5.0
- Schools +4.0/10.0
- Rent growth +2.5/5.0
- Condition / age +2.5/5.0
- Appreciation +0.0/10.0
$155,000
🖨 Deal sheet 📄 Offer letter ✓ Due diligence
Listing remarks MLS
Larger than it looks boasting over 1120 sqft on each level this 4 bedroom 2 bath home is a must see! Enter in the front door into a living room with plenty of natural lighting from the large picture window. This leads to the dining room & kitchen with access to the garage and side yard. Hard wood floors through the dining area and into the flex room (spare bedroom, den or even a separate formal dining room). Two bedrooms and full bath finish off the main floor. The lower level has a large finished family room offering updated paint and natural wood paneling, 4th bedroom with egress window, laundry room and 3/4 bathroom. Sizable yard and extra parking for 2-tandem card in driveway.
Key facts
- New furnace
- Sizable backyard
- New water heater
Tags
Property features AI
Exterior
- Parking: Attached garage with garage door opener and storage (1-car)
- Utilities: City water connected; City sewer connected; Electric with circuit breakers; Natural gas
- Home design: Residential property; One level (with finished basement); Main-level entry
- Construction: Block foundation; Asphalt roof; Built with stone and other exterior materials
- Exterior features: Patio; Stone and other exterior materials; Storage shed; Lot approximately 0.187 acres (70 x 117)
Interior
- Kitchen: Range; Refrigerator; Kitchen includes a breakfast bar and dining area
- Bedrooms: 4 bedrooms (3 bedrooms on one level; primary on main floor)
- Flooring: Hardwood floors
- Bathrooms: One full bathroom on the main floor; One three-quarter bathroom in the basement
- Heating & cooling: Forced air heating; Central air conditioning
- Interior features: Ceiling fans; Hardwood floors; Kitchen window; Natural woodwork; Main floor primary bedroom; Main floor bedroom; Informal dining area / kitchen dining; Breakfast bar; Finished basement with storage and daylight/egress windows; Sump pump
- Laundry & utility: Washer hookup in basement; Washer and dryer listed as appliances; Gas water heater
Neighborhood map
What this means for you Summary
Snapshot
- This is a 4-bed/2.0-bath single-family listed at $155k.
Deal economics
- At list price, monthly cash flow is $304 ($4k/yr) — positive.
- The deal already cash-flows at list — no discount required.
- Meets the 1% rule at list price ($2k rent vs $155k).
- Cap rate 8.6% vs local median 4.2% in Marshall — top-decile yield for the area; either an underpriced asset or a hidden risk that comps aren't pricing in. Stress-test before assuming the spread holds.
Location & tenants
- Location reads 82/100 on livability (#47 in MN, #1,265 nationally) — a professional / high-income tenant draw. Strengths: cost of living A+, housing A+, health & safety A+; Watch: amenities C-, employment C-, commute F.
- Marshall Public School District (town): math 46% / reading 48% proficiency, ranked #163 of 301 in MN (top 54%) — families likely to look elsewhere, expect single-tenant / working-renter base with shorter leases.
- Market conditions: 212 active listings in the ZIP; 91 units permitted in Lyon County in 2024 (72 in 5+ unit buildings).
Forward outlook
- Local home prices are declining (-3.0%/yr); year-one equity from $1k of loan paydown is wiped out by about $5k of value loss. Plan a longer hold.
- Lyon County population projected at -12% by 2050 — secular population decline; favor cash flow + early exit over multi-decade hold.
Negotiation context
- Only 3 days on market — expect competitive offers; lowballing is unlikely to land.
- 5 sale attempts since 16y ago with the ask held roughly flat each time — persistent listings suggest the price (not the market) is what's stuck; bring a comps-based counter.
Questions for the listing agent
- Built in 1960 — when were the roof, HVAC, electrical panel, plumbing, and water heater last replaced?
- Is there a deadline driving the sale (1031 exchange, divorce, estate, relocation)? That informs how much negotiation room exists.
- Schools are A-rated — typically a magnet for longer-tenancy family renters. What's the average tenant stay here, and is there a school-zone premium baked into asking?
- What's the average days-on-market for RENTAL listings here right now (not sales)? A rising rental-DOM trend means longer vacancies and softer asking-rent achievability than the comps imply.
- What's the recent tenant-quality profile in this submarket — average credit score on applications, eviction rate, late-payment / NSF rate, and stable-employment percentage? A property-management company in the area should have these aggregated.
- How much new for-sale + rental construction is in the pipeline within 1–3 miles? Heavy new supply typically softens prices + rents 12–24 months out; constrained supply supports both.
Investment metrics
- 1% rule
- 1.07% ✓
- Cap rate
- 8.64%
- Cash-on-cash
- 8.40%
- DSCR
- 1.37
- GRM
- 7.8
CMA / ARV
No comps found within radius.
Projected returns pro-forma
-3.0% appreciation · 3.0% rent growth · sell at horizon
- IRR
- -3.6%
- Equity multiple
- 0.87×
- Total profit
- $-5,789
- Equity at exit
- $23,111
- IRR
- 6.1%
- Equity multiple
- 1.46×
- Total profit
- $19,812
- Equity at exit
- $13,402
Cash invested: $43,400 (down + closing). Projections, not guarantees.
Landlord ↔ Tenant lean methodology
- Overall (STATE)
- 46 Balanced
- State Minnesota
- 46 Balanced · D+2
- County
- — inherits STATE
- City
- — inherits STATE
ZIP-level market 56258
- Home prices YoY
- -33.1%
- Active inventory
- 212
- Price-to-rent
- 7.8×
Monthly cashflow live
- Estimated rent
- $1,662 medium interval (Pro) →
- Mortgage (P&I)
- −$813
- Tax from tax record
- −$132 /mo · $1,586/yr
- Insurance
- −$65
- HOA
- −$0
- Vacancy / Maint / Mgmt
- −$349
- Net cashflow
- $304
Break-even live
UW: 25.0% down · 7.5% · 30yr · 1.5% tax · 5.0% vac · 8.0% maint · 8.0% mgmt
Financing live
Cash to close
- Down payment
- $38,750
- Closing costs
- $4,650
- Reserves months
- —
- Total cash needed
- —
Loan-product check · same deal, 3 products live
Conventional
25% down · 7.5% · 30yr
- Down + closing
- —
- Monthly P&I
- —
- Monthly cashflow
- —
- DSCR
- —
- Eligible?
- —
Personal DTI + credit; lowest rate.
DSCR
20% down · 8.5% · 30yr
- Down + closing
- —
- Monthly P&I
- —
- Monthly cashflow
- —
- DSCR
- —
- Eligible?
- —
No personal income docs; deal must DSCR.
Hard money
10% down · 12.0% · 12mo
- Down + closing
- —
- Monthly P&I
- —
- Monthly cashflow
- —
- DSCR
- —
- Eligible?
- —
Short-term bridge; refi at stabilization.
Listing history 3 events
-
2026-06-13status $155,000 Pending 3 DOM
-
2026-06-12remarks 695-char remark
-
2026-06-12$155,000 Active 3 DOM
ⓘ Source: listings_history table (triggers on properties + properties_extension) + one-shot
backfill from property_details.listing_events for pre-trigger history.
Tax reassessment forecast MN · Partial reset (capped growth)
- Current annual tax
- $1,586 · $132/mo
- Projected year-2 tax
- $1,661 · $138/mo
- Expected delta
- +$75/yr (+$6/mo · 4.7%)
ⓘ Screening estimate from a state-policy table — verify with the county assessor before closing.
Climate risk First Street
- Flood 3/10 Moderate FEMA zone X · 10% chance over 30 yrs
- Wildfire 1/10 Low
- Heat 2/10 Low 7 d/yr ≥98°F today · 14 d/yr by 30 yrs out
- Wind 2/10 Low
- Air quality 1/10 Low 0 unhealthy d/yr today · 0 by 30 yrs out
Nearby sold comps map
Loading sold comps map…
Walkable amenities ~0.75 mi
Loading nearby amenities…
Taxation est. · year 1
- Rental income
- $19,948
- − Mortgage interest
- −$8,682
- − Property taxes
- −$1,586
- − Insurance
- −$775
- − Repairs & maintenance
- −$1,596
- − Management
- −$1,596
- − Depreciation
- −$4,509
- Taxable income
- $1,204
- Est. tax owed @ 24.0%
- −$289
- After-tax cash flow
- $3,355/yr
For passive investors: Depreciation is non-cash, so a rental often shows a tax loss while cash-flowing — sheltering income. Rental losses are passive: they offset passive income freely, and up to $25,000/yr can offset ordinary (W-2) income if you actively participate and your MAGI is under $100k (phasing out to $0 by $150k); unused losses carry forward. On sale, claimed depreciation is recaptured at up to 25%, and gains may owe capital-gains tax (a 1031 exchange can defer both). Figures are a year-1 estimate at your 24.0% rate — not tax advice; consult a CPA.
Schools (NCES district)
- District
- Marshall Public School District
- NCES district ID
- 2718940
- Math proficiency
- 46% ▼ -13.00%
- Reading proficiency
- 48% ▼ -11.00%
- Median HH income
- $47,798
- Composite
- 40.09/100
- National rank
- #3807
- State rank
- #163 of 301 in MN
Livability — Marshall
- Score
- 82/100
- State rank
- #47
- US rank
- #1265
Category grades
Schools grade is shown separately in the Schools card above.
Census & demographics
- Census place
- Marshall, MN
- County
- Lyon County · 15,888 people
- City population
- 15,888
- Metro
- Marshall, MN
- Population (ZIP)
- 15,888
- Household income
- $72,731
- Rent vs Own
- Severe rent burden
- 483.0
Population outlook (Lyon County) Hauer SSP2
- Today (2025)
- 25,369 people
- By 2030
- 24,890 · -1.9%
- By 2040
- 23,599 · -7.0%
- By 2050
- 22,383 · -11.8%
- By 2075
- 20,076 · -20.9%
- By 2100
- 18,901 · -25.5%
Race, ethnicity, and origin ACS 2023
- Neighborhood character
- Predominantly White (79%)
- Race & ethnicity
- White 79% Hispanic / Latino 7% Asian 6% Black 4% Two or more races 4%
- Hispanic origin (detail)
- Mexican 5%
- Common ancestry
- Portuguese 14% English 6% Lithuanian 6%
- Foreign-born
- 8% · Canada, Philippines
- Languages at home
- 88% English-only · Spanish 6% Other Asian/Pacific 4% Other Indo-European 1%
Political lean MEDSL · Lyon
- 2024 margin
- Solid R (+31.8) · D 33.1% · R 64.9% · Other 2.0%
- 2008→2024 swing
- -30.2pp toward R · 2008: -1.6pp · 2024: -31.8pp
- All cycles
- 2024: R+31.8 2020: R+25.9 2016: R+28.3 2012: R+9.2 2008: R+1.6
Not yet ingested
- Civics
- —
Market trends
- HPI YoY
- ▼ -87.90%
- Current HPI
- 177.471
- Rent YoY
- —
- Metro
- Marshall, MN
- State GDP YoY
- ▲ 2.41%
- F500 in state
- 34
Industry mix (Fortune 500 HQ in MN)
| Industry | F500 HQs | Revenue |
|---|---|---|
| Healthcare | 2 | $407B |
|
||
| Retail | 2 | $150B |
|
||
| Consumer Goods | 2 | $32B |
|
||
| Industrial Machinery | 2 | $6B |
|
||
| Agriculture | 1 | $40B |
|
||
| Healthcare / Medical Devices | 1 | $32B |
|
||
Price history
+21.6% since first listed10 events — show timeline
- 2026-06-09 Listed $155,000 NORTHSTARMLS as Distributed by MLS Grid
- 2019-05-23 Sold (Public Records) $138,000 Public Records
- 2019-05-23 Sold (MLS) $138,000 NORTHSTARMLS as Distributed by MLS Grid
- 2019-05-04 Pending — NORTHSTARMLS as Distributed by MLS Grid
- 2019-03-21 Listed $147,000 NORTHSTARMLS as Distributed by MLS Grid
- 2019-02-02 Listing Removed — NORTHSTARMLS as Distributed by MLS Grid
- 2010-08-02 Listing Removed — REALTOR® Association of the Sioux Empire
- 2010-03-10 Listed $127,500 REALTOR® Association of the Sioux Empire
- 2010-03-02 Listed $127,500 NORTHSTARMLS as Distributed by MLS Grid
- 2010-03-02 Listed $127,500 NORTHSTARMLS as Distributed by MLS Grid
Property tax history
+0.8%/yrLatest (2026): $1,586 · +9.7% YoY. Source: county tax records.
Cash-flow waterfall
monthlySold comps — $/sqft
last 12 mo · ≤1 miLoading sold comps…