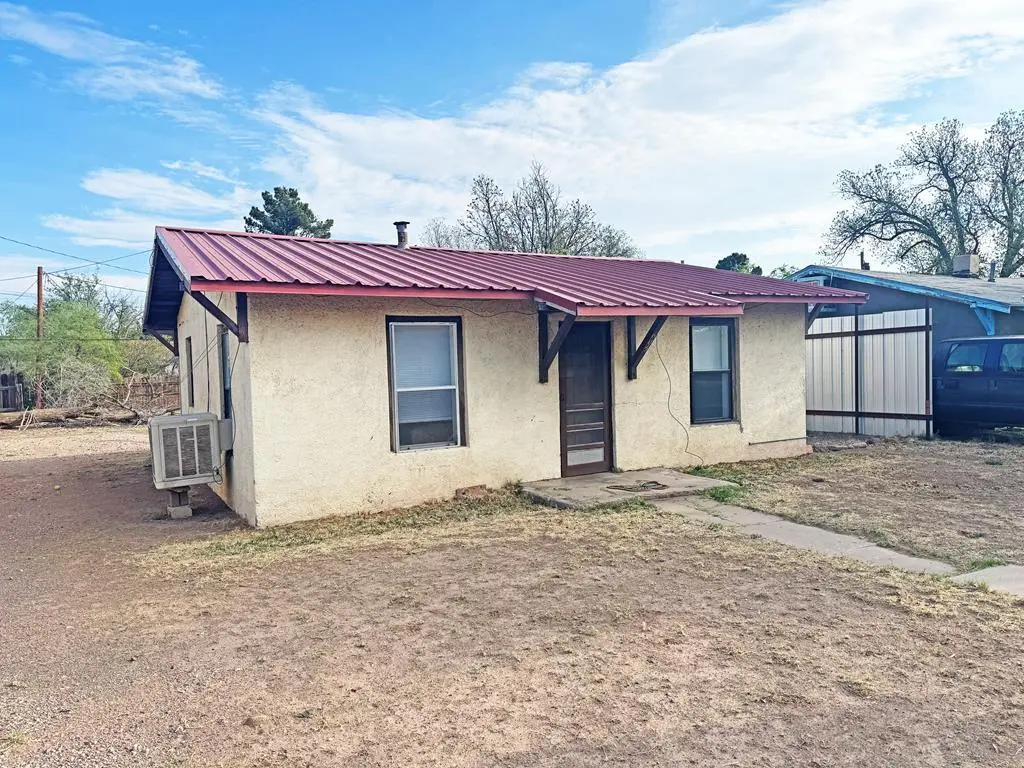
605 E Ave E · Alpine, TX
Flood risk 5/10 · Moderate
- FEMA flood zone
- —
- Chance of flooding over 30 yrs
- 0.65%
- Est. flood insurance / yr
- —
Fire risk 9/10 · Severe
- Est. fire insurance / yr
- $1,222 – $2,270
Heat risk 4/10 · Minor
- Hot days now (above 95°F)
- 4 days/yr
- Hot days in 30 yrs
- 12 days/yr
Wind risk 1/10 · Minimal
- Chance of severe wind over 30 yrs
- —
Air-quality risk 1/10 · Minimal
- Unhealthy air days now
- 0 days/yr
- Unhealthy air days in 30 yrs
- 0 days/yr
Risk factors via First Street. Map © Google.
Why this score? — see what drove the D grade
The composite is a weighted blend of 9 inputs, each scored 0–100. Each bar is that input's sub-score; the figure is the points it added to the 100-point composite (weight × sub-score).
- Cash flow +13.1/30.0
- ARV discount +7.5/15.0
- Schools +4.0/10.0
- DSCR +3.9/10.0
- Livability +3.9/5.0
- 1% rule +3.7/10.0
- Rent growth +2.5/5.0
- Condition / age +2.2/5.0
- Appreciation +0.0/10.0
$135,000
🖨 Deal sheet 📄 Offer letter ✓ Due diligence
Listing remarks MLS
2 bedroom, 1 bath home located within walking distance to SRSU and local amenities. Perfect as a first home or investment property. Additional home available for purchase.
Key facts
- 6,969 sq ft lot
- Built 1940
- Listed 417 days
Neighborhood map
What this means for you Summary
Snapshot
- This is a 2-bed/1.0-bath single-family listed at $135k. Condition is rated fair.
Deal economics
- At list price, monthly cash flow is $-5 ($-55/yr) — negative.
- To cash-flow at today's rent, offer at most $134k (0.5% below list).
- To meet the 1% rule (rent ≥ 1% of price), the offer needs to be $118k (12.9% below list).
- Recommended offer: $118k (12.9% below list) — sets the bar for 1% rule.
Location & tenants
- Location reads 78/100 on livability (#73 in TX, #2,631 nationally) — a middle-class / working-renter tenant base. Strengths: crime A+, cost of living A+, housing A+; Watch: amenities D+, commute F, employment F.
- Alpine ISD (town): math 43% / reading 53% proficiency, ranked #235 of 826 in TX (top 28%) — families likely to look elsewhere, expect single-tenant / working-renter base with shorter leases.
- Market conditions: 167 active listings in the ZIP; 2 comparable units currently listed for rent nearby; 7 units permitted in Brewster County in 2024 (0 in 5+ unit buildings).
Forward outlook
- Local home prices are declining (-3.0%/yr); year-one equity from $933 of loan paydown is wiped out by about $4k of value loss. Plan a longer hold.
- Brewster County population projected at -17% by 2050 — secular population decline; favor cash flow + early exit over multi-decade hold.
Negotiation context
- It's been on market 418 days — a 12% lower offer ($119k) is reasonable based on typical stale-listing flexibility.
- 2 sale attempts with the ask held roughly flat each time — persistent listings suggest the price (not the market) is what's stuck; bring a comps-based counter.
Risks & watch-outs
- Watch-outs: built in 1940 — expect roof / HVAC / electrical / plumbing capex.
- Climate carrying-cost: moderate flood risk; severe wildfire risk — expect insurance premiums to compound above CPI over the hold.
Questions for the listing agent
- What do current leases actually rent for vs. the listed asking? Can we see a recent rent roll and the last 12 months of T-12 income?
- It's been on market 418 days. Have you received any prior offers? Is the seller open to a 13% concession, seller financing, or rate buy-down credit?
- Have any recent inspections been done? Can we get a copy of the seller's disclosures and any deferred-maintenance estimates?
- Built in 1940 — when were the roof, HVAC, electrical panel, plumbing, and water heater last replaced?
- Why hasn't it sold? Are there any deal-killer items the seller is aware of (foundation, flood, title, zoning, code violations)?
- Is there a deadline driving the sale (1031 exchange, divorce, estate, relocation)? That informs how much negotiation room exists.
- The area grade is low — what's the realistic commute time and amenity access for the typical tenant pool here? Any planned neighborhood developments (good or bad) we should know about?
- What's the average days-on-market for RENTAL listings here right now (not sales)? A rising rental-DOM trend means longer vacancies and softer asking-rent achievability than the comps imply.
- What's the recent tenant-quality profile in this submarket — average credit score on applications, eviction rate, late-payment / NSF rate, and stable-employment percentage? A property-management company in the area should have these aggregated.
- How much new for-sale + rental construction is in the pipeline within 1–3 miles? Heavy new supply typically softens prices + rents 12–24 months out; constrained supply supports both.
Investment metrics
- 1% rule
- 0.87% ✗
- Cap rate
- 6.25%
- Cash-on-cash
- -0.14%
- DSCR
- 0.99
- GRM
- 9.6
CMA / ARV
No comps found within radius.
Projected returns pro-forma
-3.0% appreciation · 3.0% rent growth · sell at horizon
- IRR
- -16.5%
- Equity multiple
- 0.41×
- Total profit
- $-22,148
- Equity at exit
- $20,129
- IRR
- -8.3%
- Equity multiple
- 0.48×
- Total profit
- $-19,587
- Equity at exit
- $11,672
Cash invested: $37,800 (down + closing). Projections, not guarantees.
Landlord ↔ Tenant lean methodology
- Overall (STATE)
- 87 Strongly Landlord-Friendly
- State Texas
- 87 Strongly Landlord-Friendly · R+5
- County
- — inherits STATE
- City
- — inherits STATE
ZIP-level market 79830
- Home prices YoY
- -32.6%
- Active inventory
- 167
- Price-to-rent
- 9.6×
Monthly cashflow live
- Estimated rent
- $1,175 medium interval (Pro) →
- Mortgage (P&I)
- −$708
- Tax est. 1.5%
- −$169 /mo · $2,025/yr
- Insurance
- −$56
- HOA
- −$0
- Vacancy / Maint / Mgmt
- −$247
- Net cashflow
- $-5
Break-even live
UW: 25.0% down · 7.5% · 30yr · 1.5% tax · 5.0% vac · 8.0% maint · 8.0% mgmt
Financing live
Cash to close
- Down payment
- $33,750
- Closing costs
- $4,050
- Reserves months
- —
- Total cash needed
- —
Loan-product check · same deal, 3 products live
Conventional
25% down · 7.5% · 30yr
- Down + closing
- —
- Monthly P&I
- —
- Monthly cashflow
- —
- DSCR
- —
- Eligible?
- —
Personal DTI + credit; lowest rate.
DSCR
20% down · 8.5% · 30yr
- Down + closing
- —
- Monthly P&I
- —
- Monthly cashflow
- —
- DSCR
- —
- Eligible?
- —
No personal income docs; deal must DSCR.
Hard money
10% down · 12.0% · 12mo
- Down + closing
- —
- Monthly P&I
- —
- Monthly cashflow
- —
- DSCR
- —
- Eligible?
- —
Short-term bridge; refi at stabilization.
Rent comps 2 comps
| Address | Beds | Baths | Sqft | Rent | $/sqft | DOM | Units | Dist |
|---|---|---|---|---|---|---|---|---|
| 504 East Ave E Unit 3 Alpine, TX | 1.0 | 1.0 | 700 | $750 | $1.07 | 14d | 1 | 0.04mi |
| 1104 Lechuguilla Alpine, TX | 1.0 | 1.0 | 700 | $801 | $1.14 | 43d | 1 | 0.85mi |
Listing history 12 events
-
2026-06-10days on market $135,000 Active 418 DOM
-
2026-06-09days on market $135,000 Active 417 DOM
-
2026-06-08days on market $135,000 Active 416 DOM
-
2026-06-07days on market $135,000 Active 415 DOM
-
2026-06-03days on market $135,000 Active 411 DOM
-
2026-06-02days on market $135,000 Active 410 DOM
-
2026-06-01days on market $135,000 Active 409 DOM
-
2026-05-31days on market $135,000 Active 408 DOM
-
2026-05-31days on market $135,000 Active 407 DOM
-
2026-01-02status Active 171-char remark
Show marketing remark (171 chars)
2 bedroom, 1 bath home located within walking distance to SRSU and local amenities. Perfect as a first home or investment property. Additional home available for purchase.
-
2026-01-01historical 171-char remark
Show marketing remark (171 chars)
2 bedroom, 1 bath home located within walking distance to SRSU and local amenities. Perfect as a first home or investment property. Additional home available for purchase.
-
2025-04-17$135,000 Active 171-char remark
Show marketing remark (171 chars)
2 bedroom, 1 bath home located within walking distance to SRSU and local amenities. Perfect as a first home or investment property. Additional home available for purchase.
ⓘ Source: listings_history table (triggers on properties + properties_extension) + one-shot
backfill from property_details.listing_events for pre-trigger history.
Climate risk First Street
- Flood 5/10 Major 65% chance over 30 yrs
- Wildfire 9/10 Extreme
- Heat 4/10 Moderate 4 d/yr ≥95°F today · 12 d/yr by 30 yrs out
- Wind 1/10 Low
- Air quality 1/10 Low 0 unhealthy d/yr today · 0 by 30 yrs out
Nearby sold comps map
Loading sold comps map…
Walkable amenities ~0.75 mi
Loading nearby amenities…
Taxation est. · year 1
- Rental income
- $14,102
- − Mortgage interest
- −$7,562
- − Property taxes
- −$2,025
- − Insurance
- −$675
- − Repairs & maintenance
- −$1,128
- − Management
- −$1,128
- − Depreciation
- −$3,927
- Taxable loss
- −$2,343
- Est. tax savings @ 24.0%
- +$562
- After-tax cash flow
- $508/yr
For passive investors: Depreciation is non-cash, so a rental often shows a tax loss while cash-flowing — sheltering income. Rental losses are passive: they offset passive income freely, and up to $25,000/yr can offset ordinary (W-2) income if you actively participate and your MAGI is under $100k (phasing out to $0 by $150k); unused losses carry forward. On sale, claimed depreciation is recaptured at up to 25%, and gains may owe capital-gains tax (a 1031 exchange can defer both). Figures are a year-1 estimate at your 24.0% rate — not tax advice; consult a CPA.
Condition & rehab AI · 12 photos
This 2-bedroom home requires moderate renovations to improve its curb appeal and functionality, with a focus on the kitchen and exterior. It's located within walking distance to SRSU and local amenities, making it a good investment property.
Repairs flagged
- Minor kitchen countertops — worn and dated
- Minor bathroom fixtures — basic and dated
- Moderate exterior paint — some discoloration
Value-add opportunities
- Both paint interior walls — enhances curb appeal and interior aesthetics
- Both replace kitchen countertops — modernizes the kitchen and improves functionality
- Both repair exterior paint — enhances curb appeal and property value
Renovation cost estimate screening
| Repair item | Severity | Est. cost |
|---|---|---|
| kitchen countertops · worn and dated | Minor | $500–3,000 |
| bathroom fixtures · basic and dated | Minor | $500–3,000 |
| exterior paint · some discoloration | Moderate | $3,000–15,000 |
| Total estimated repair cost · 3 items | $4,000–21,000 |
Value-add ROI direction
- Both paint interior walls — enhances curb appeal and interior aesthetics ↑
- Both replace kitchen countertops — modernizes the kitchen and improves functionality ↑
- Both repair exterior paint — enhances curb appeal and property value ↑
ⓘ Cost ranges are severity-bucket heuristics (US national rule-of-thumb). Get contractor quotes + a written scope before underwriting a rehab budget.
Schools (NCES district)
- District
- Alpine ISD
- NCES district ID
- 4807950
- Math proficiency
- 43% ▼ -4.00%
- Reading proficiency
- 53% ▲ 2.00%
- Median HH income
- $39,184
- Composite
- 40.06/100
- National rank
- #3814
- State rank
- #235 of 826 in TX
Livability — Alpine
- Score
- 78/100
- State rank
- #73
- US rank
- #2631
Category grades
Schools grade is shown separately in the Schools card above.
Census & demographics
- Census place
- Alpine, TX
- County
- Brewster County · 7,853 people
- City population
- 7,853
- Metro
- nan
- Population (ZIP)
- 7,853
- Household income
- $66,546
- Rent vs Own
- Severe rent burden
- 229.0
Population outlook (Brewster County) Hauer SSP2
- Today (2025)
- 8,850 people
- By 2030
- 8,577 · -3.1%
- By 2040
- 7,903 · -10.7%
- By 2050
- 7,338 · -17.1%
- By 2075
- 5,950 · -32.8%
- By 2100
- 4,678 · -47.1%
Race, ethnicity, and origin ACS 2023
- Neighborhood character
- Majority White (52%)
- Race & ethnicity
- White 52% Hispanic / Latino 46% Two or more races 15% Asian 1%
- Hispanic origin (detail)
- Mexican 37%
- Common ancestry
- Serbian 5% Slovak 3% Romanian 2%
- Foreign-born
- 9% · Canada
- Languages at home
- 69% English-only · Spanish 29% Tagalog/Filipino 1%
Political lean MEDSL · Brewster
- 2024 margin
- R (+12.6) · D 43.0% · R 55.6% · Other 1.4%
- 2008→2024 swing
- -15.5pp toward R · 2008: 3.0pp · 2024: -12.6pp
- All cycles
- 2024: R+12.6 2020: R+4.2 2016: R+4.8 2012: R+5.4 2008: D+3.0
Not yet ingested
- Civics
- —
Market trends
- HPI YoY
- ▼ -86.21%
- Current HPI
- 178.4899
- Rent YoY
- —
- Metro
- nan
- State GDP YoY
- ▲ 3.95%
- F500 in state
- 110
Industry mix (Fortune 500 HQ in TX)
| Industry | F500 HQs | Revenue |
|---|---|---|
| Energy | 16 | $1,198B |
|
||
| Technology | 5 | $198B |
|
||
| Engineering / Construction | 4 | $72B |
|
||
| Energy Services | 3 | $60B |
|
||
| Utilities | 3 | $41B |
|
||
| Healthcare | 2 | $330B |
|
||
Price history
3 events — show timeline
- 2026-01-02 Relisted — ODMLS
- 2026-01-01 Delisted — ODMLS
- 2025-04-17 Listed $135,000 ODMLS
Cash-flow waterfall
monthlySold comps — $/sqft
last 12 mo · ≤1 miLoading sold comps…