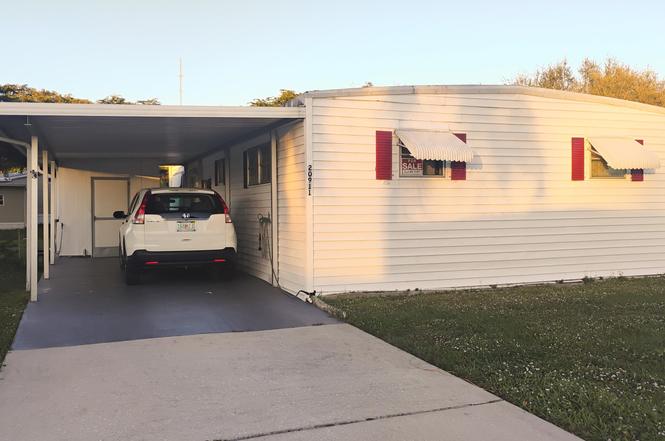
20911 Sunrise Dr · Boca Raton, FL
Flood risk 1/10 · Minimal
- FEMA flood zone
- X (unshaded)
- Chance of flooding over 30 yrs
- 0.0%
- Est. flood insurance / yr
- $507 – $1,088
Fire risk 1/10 · Minimal
- Est. fire insurance / yr
- $947 – $1,759
Heat risk 9/10 · Severe
- Hot days now (above 107°F)
- 7 days/yr
- Hot days in 30 yrs
- 26 days/yr
Wind risk 10/10 · Severe
- Chance of severe wind over 30 yrs
- 99.0%
Air-quality risk 2/10 · Minimal
- Unhealthy air days now
- 2 days/yr
- Unhealthy air days in 30 yrs
- 2 days/yr
Risk factors via First Street. Map © Google.
Why this score? — see what drove the B grade
The composite is a weighted blend of 9 inputs, each scored 0–100. Each bar is that input's sub-score; the figure is the points it added to the 100-point composite (weight × sub-score).
- Cash flow +30.0/30.0
- 1% rule +10.0/10.0
- DSCR +10.0/10.0
- ARV discount +7.5/15.0
- Schools +4.3/10.0
- Livability +3.9/5.0
- Rent growth +2.6/5.0
- Condition / age +2.5/5.0
- Appreciation +0.0/10.0
$119,900
🖨 Deal sheet 📄 Offer letter ✓ Due diligence
Listing remarks
Charming 2-bedroom, 2-bath manufactured home located in a desirable 55+ community in the heart of Boca Raton. This unit offers a functional layout with bright living spaces and great potential for a seasonal retreat or full-time residence. The home includes a carport with storage shed, where you'll find a newer washer and dryer. Additional appliances include refrigerator and oven. A pre-sale inspection was completed in January 2026 for added transparency. Enjoy low annual property taxes and a central Boca location close to shopping, dining, medical facilities, and major roadways. Affordable living in a well-established community!
Key facts
- Close to dining
- Close to shopping
- 4,249 sq ft lot
Tags
Property features AI
Finance
- HOA & community: Community has an association; Monthly association fee of $250; Association covers cable TV, maintenance of grounds, and common areas; Association amenities include clubhouse, laundry, picnic area, shuffleboard court, on-site manager, and library; Senior community; Pets allowed (breed and size restrictions may apply; pet restrictions possible)
Exterior
- Utilities: No utilities listed
- Home design: Mobile home; Single-story; Faces north; Resale condition
- Construction: Modular construction
- Exterior features: Not waterfront; No waterfront features
Interior
- Bedrooms: 2 bedrooms on the main level
- Flooring: Other flooring
- Bathrooms: 2 full bathrooms on the main level
- Heating & cooling: Has heating (type: other); Central individual cooling
- Interior features: Unfurnished; No notable built-in interior features listed
Neighborhood map
What this means for you Summary
Snapshot
- This is a 2-bed/2.0-bath condo listed at $120k.
Deal economics
- At list price, monthly cash flow is $1k ($14k/yr) — positive.
- The deal already cash-flows at list — no discount required.
- Meets the 1% rule at list price ($3k rent vs $120k).
- Recommended offer: $106k (12.0% below list) — sets the bar for market timing.
- Cap rate 17.7% vs local median 2.8% in Boca Raton — top-decile yield for the area; either an underpriced asset or a hidden risk that comps aren't pricing in. Stress-test before assuming the spread holds.
Location & tenants
- Location reads 77/100 on livability (#192 in FL, #3,070 nationally) — a middle-class / working-renter tenant base. Strengths: schools A+, employment A+, health & safety A+; Watch: amenities D, cost of living F.
- Palm Beach (suburban): math 46% / reading 53% proficiency, ranked #34 of 73 in FL (top 47%) — families likely to look elsewhere, expect single-tenant / working-renter base with shorter leases.
- Market conditions: Rents flat; 430 active listings in the ZIP; 40 comparable units currently listed for rent nearby; rentals at typical pace (median 24d on market — plan ~3-4 weeks tenant-placement turnaround); solid renter incomes; 3,974 units permitted in Palm Beach County in 2024 (1,012 in 5+ unit buildings).
- This rent runs 38% of the median local income ($84k/yr) — at the standard rent-burdened threshold; future hikes will face affordability resistance.
Forward outlook
- Local home prices are declining (-3.0%/yr); year-one equity from $829 of loan paydown is wiped out by about $4k of value loss. Plan a longer hold.
- Palm Beach County population projected at +30% by 2050 — long-run rental-demand tailwind backs the buy-and-hold thesis.
- At projected returns (-3.0% appreciation + 0.3% rent growth), your $34k cash investment doubles in ~4 years — after that, you're playing with house money.
Negotiation context
- It's been on market 124 days — a 12% lower offer ($106k) is reasonable based on typical stale-listing flexibility.
Risks & watch-outs
- Climate carrying-cost: severe wind risk, 99% chance of damaging wind over 30y; extreme-heat days projected 7→26/yr by 2055 (HVAC capex compounding) — expect insurance premiums to compound above CPI over the hold.
Questions for the listing agent
- It's been on market 124 days. Have you received any prior offers? Is the seller open to a 12% concession, seller financing, or rate buy-down credit?
- Built in 1972 — when were the roof, HVAC, electrical panel, plumbing, and water heater last replaced?
- What does the HOA fee cover, when was the last increase, and are there any pending special assessments or reserve-fund shortfalls?
- Any open or pending special assessments — roof, HVAC, plumbing, elevator, façade? What's the per-unit balance and payoff schedule, and is the seller paying it off at close or rolling it to the buyer?
- Why hasn't it sold? Are there any deal-killer items the seller is aware of (foundation, flood, title, zoning, code violations)?
- Is there a deadline driving the sale (1031 exchange, divorce, estate, relocation)? That informs how much negotiation room exists.
- Schools are A-rated — typically a magnet for longer-tenancy family renters. What's the average tenant stay here, and is there a school-zone premium baked into asking?
- What's the average days-on-market for RENTAL listings here right now (not sales)? A rising rental-DOM trend means longer vacancies and softer asking-rent achievability than the comps imply.
- What's the recent tenant-quality profile in this submarket — average credit score on applications, eviction rate, late-payment / NSF rate, and stable-employment percentage? A property-management company in the area should have these aggregated.
- How much new apartment / multifamily construction is in the pipeline within 1–3 miles? Heavy new supply (>2% of stock underway) typically softens rents 12–24 months out; light construction supports rent growth.
Investment metrics
- 1% rule
- 2.24% ✓
- Cap rate
- 17.67%
- Cash-on-cash
- 40.63%
- DSCR
- 2.81
- GRM
- 3.7
CMA / ARV
No comps found within radius.
Projected returns pro-forma
-3.0% appreciation · 0.33% rent growth · sell at horizon
- IRR
- 33.8%
- Equity multiple
- 2.37×
- Total profit
- $46,075
- Equity at exit
- $17,877
- IRR
- 39.2%
- Equity multiple
- 4.17×
- Total profit
- $106,546
- Equity at exit
- $10,367
Cash invested: $33,572 (down + closing). Projections, not guarantees.
Landlord ↔ Tenant lean methodology
- Overall (STATE)
- 87 Strongly Landlord-Friendly
- State Florida
- 87 Strongly Landlord-Friendly · R+3
- County
- — inherits STATE
- City
- — inherits STATE
ZIP-level market 33433
- Rents YoY
- 0.3%
- Active inventory
- 430
- Price-to-rent
- 3.7×
Monthly cashflow live
- Estimated rent
- $2,688 high interval (Pro) →
- Mortgage (P&I)
- −$629
- Tax from tax record
- −$58 /mo · $698/yr
- Insurance
- −$50
- HOA
- −$250
- Vacancy / Maint / Mgmt
- −$565
- Net cashflow
- $1,137
Break-even live
UW: 25.0% down · 7.5% · 30yr · 1.5% tax · 5.0% vac · 8.0% maint · 8.0% mgmt
Financing live
Cash to close
- Down payment
- $29,975
- Closing costs
- $3,597
- Reserves months
- —
- Total cash needed
- —
Loan-product check · same deal, 3 products live
Conventional
25% down · 7.5% · 30yr
- Down + closing
- —
- Monthly P&I
- —
- Monthly cashflow
- —
- DSCR
- —
- Eligible?
- —
Personal DTI + credit; lowest rate.
DSCR
20% down · 8.5% · 30yr
- Down + closing
- —
- Monthly P&I
- —
- Monthly cashflow
- —
- DSCR
- —
- Eligible?
- —
No personal income docs; deal must DSCR.
Hard money
10% down · 12.0% · 12mo
- Down + closing
- —
- Monthly P&I
- —
- Monthly cashflow
- —
- DSCR
- —
- Eligible?
- —
Short-term bridge; refi at stabilization.
Rent comps 40 comps
| Address | Beds | Baths | Sqft | Rent | $/sqft | DOM | Units | Dist |
|---|---|---|---|---|---|---|---|---|
| 8458 Boca Glades Blvd E Boca Raton, FL | 2.0 | 2.0 | 1307 | $3,200 | $2.45 | 5d | 1 | 0.22mi |
| 8540 Chevy Chase Dr Unit 8540 Boca Raton, FL | 1.0 | 1.0 | 908 | $2,000 | $2.20 | 24d | 1 | 0.25mi |
| 8588 Bella Vista Dr Boca Raton, FL | 2.0 | 2.0 | 1332 | $2,999 | $2.25 | 24d | 1 | 0.26mi |
| 8440 Boca Glades Blvd E Boca Raton, FL | 2.0 | 2.0 | 1307 | $3,400 | $2.60 | 22d | 1 | 0.37mi |
| 8657 Boca Glades Blvd E Unit C Boca Raton, FL | 3.0 | 2.0 | 1098 | $2,800 | $2.55 | 24d | 1 | 0.37mi |
| 8729 Chevy Chase Dr Boca Raton, FL | 2.0 | 2.0 | 1332 | $2,000 | $1.50 | 24d | 1 | 0.38mi |
| 8732 Bella Vista Dr #42 Boca Raton, FL | 2.0 | 2.0 | 908 | $1,900 | $2.09 | 24d | 1 | 0.39mi |
| 20867 Wendall Ter Boca Raton, FL | 2.0 | 1.5 | 908 | $1,800 | $1.98 | 24d | 1 | 0.42mi |
| 8744 Bella Vista Dr Boca Raton, FL | 2.0 | 2.0 | 1332 | $2,100 | $1.58 | 5d | 1 | 0.42mi |
| 20886 Vinesta Cir Unit 313 Boca Raton, FL | 2.0 | 2.0 | 1332 | $1,800 | $1.35 | 24d | 1 | 0.42mi |
| 8833 Bella Vista Dr #8833 Boca Raton, FL | 2.0 | 2.0 | 908 | $3,250 | $3.58 | 24d | 1 | 0.50mi |
| 21214 Lago Cir Unit 8f Boca Raton, FL | 2.0 | 2.0 | 1216 | $4,200 | $3.45 | 24d | 1 | 0.56mi |
| 20927 Sedgewick Dr Unit 20927 Boca Raton, FL | 2.0 | 1.0 | 908 | $1,950 | $2.15 | 24d | 1 | 0.62mi |
| 8425 Casa del Lago Unit C Boca Raton, FL | 2.0 | 2.0 | 1216 | $2,100 | $1.73 | 22d | 1 | 0.64mi |
| 21362 Juego Cir Unit 33f Boca Raton, FL | 2.0 | 2.0 | 1216 | $3,500 | $2.88 | 24d | 1 | 0.74mi |
| 21411 Juego Cir Unit 32b Boca Raton, FL | 2.0 | 2.0 | 1216 | $1,950 | $1.60 | 24d | 1 | 0.74mi |
| 7911 Eastlake Dr Unit H Boca Raton, FL | 2.0 | 2.0 | 1216 | $2,200 | $1.81 | 24d | 1 | 0.74mi |
| 7944 Eastlake Dr Unit D Boca Raton, FL | 2.0 | 2.0 | 1216 | $2,100 | $1.73 | 24d | 1 | 0.76mi |
| 8045 Eastlake Dr Unit 1-G Boca Raton, FL | 2.0 | 2.0 | 1216 | $2,750 | $2.26 | 24d | 1 | 0.78mi |
| 1405 Bridgewood Dr Unit 1405 Boca Raton, FL | 2.0 | 2.5 | 1400 | $3,100 | $2.21 | 24d | 1 | 0.78mi |
| 1405 Bridgewood Dr Unit 1405 Boca Raton, FL | 2.0 | 2.5 | 1400 | $3,000 | $2.14 | 22d | 1 | 0.78mi |
| 21643 Cypress Rd Unit 14C Boca Raton, FL | 2.0 | 2.5 | 1426 | $2,590 | $1.82 | 3d | 1 | 0.80mi |
| 20525 S Charlston St Boca Raton, FL | 2.0–3.0 | 2.0 | 1484 | $3,439 | $2.32 | 1d | 2 | 0.82mi |
| 2404 Bridgewood Dr Boca Raton, FL | 2.0 | 2.5 | 1400 | $4,700 | $3.36 | 24d | 1 | 0.82mi |
| 8334 Cypress Ln Unit 1A Boca Raton, FL | 2.0 | 2.0 | 1216 | $3,000 | $2.47 | 24d | 1 | 0.85mi |
| 21650 Juego Cir Unit 24b Boca Raton, FL | 2.0 | 2.0 | 1216 | $3,000 | $2.47 | 24d | 1 | 0.86mi |
| 3705 Bridgewood Dr Boca Raton, FL | 2.0 | 2.0 | 1400 | $3,500 | $2.50 | 24d | 1 | 0.89mi |
| 8436 Cypress Ln Unit 7d Boca Raton, FL | 2.0 | 2.0 | 1216 | $2,450 | $2.01 | 17d | 1 | 0.94mi |
| 8436 Cypress Ln Unit 7d Boca Raton, FL | 2.0 | 2.0 | 1216 | $2,450 | $2.01 | 15d | 1 | 0.94mi |
| 9280 Sable Ridge Cir Apt B Boca Raton, FL | 2.0 | 2.0 | 1475 | $2,700 | $1.83 | 3d | 1 | 0.95mi |
| 3604 Bridgewood Dr Boca Raton, FL | 2.0 | 2.5 | 1400 | $2,450 | $1.75 | 24d | 1 | 0.95mi |
| 9292 Sabal Ridge Cir Unit D Boca Raton, FL | 2.0 | 2.0 | 1475 | $2,650 | $1.80 | 11d | 1 | 0.98mi |
| 9292 Sabal Ridge Cir Unit D Boca Raton, FL | 2.0 | 2.0 | 1475 | $2,650 | $1.80 | 24d | 1 | 0.98mi |
| 9256 Sabal Ridge Cir Unit D Boca Raton, FL | 2.0 | 2.0 | 1475 | $2,695 | $1.83 | 24d | 1 | 0.98mi |
| 21535 Cypress Hammock Dr Unit 36J Boca Raton, FL | 2.0 | 2.0 | 1266 | $2,200 | $1.74 | 24d | 1 | 0.99mi |
| 21529 Cypress Hammock Dr Unit 35J Boca Raton, FL | 2.0 | 2.0 | 1266 | $2,395 | $1.89 | 12d | 1 | 1.01mi |
| 9260 Ketay Cir #2 Boca Raton, FL | 2.0 | 2.0 | 1279 | $2,200 | $1.72 | 24d | 1 | 1.01mi |
| 21820 Cypress Cir Unit 25e Boca Raton, FL | 1.0 | 1.0 | 1216 | $1,000 | $0.82 | 22d | 1 | 1.03mi |
| 21500 Cypress Hammock Dr Unit 38C Boca Raton, FL | 2.0 | 2.0 | 1266 | $2,500 | $1.97 | 24d | 1 | 1.03mi |
| 3205 Bridgewood Dr #3205 Boca Raton, FL | 2.0 | 2.5 | 1400 | $3,200 | $2.29 | 24d | 1 | 1.05mi |
HOA detail condo
- Monthly dues
- $250 · $3,000/yr
- Assessments
- None detected in remarks — confirm with the listing agent.
Listing history 12 events
-
2026-06-18days on market $119,900 Active 124 DOM
-
2026-06-17days on market $119,900 Active 123 DOM
-
2026-06-16days on market $119,900 Active 122 DOM
-
2026-06-15days on market $119,900 Active 121 DOM
-
2026-06-13days on market $119,900 Active 119 DOM
-
2026-06-09days on market $119,900 Active 115 DOM
-
2026-06-07days on market $119,900 Active 113 DOM
-
2026-06-04days on market $119,900 Active 110 DOM
-
2026-06-03days on market $119,900 Active 109 DOM
-
2026-06-01days on market $119,900 Active 107 DOM
-
2026-05-31days on market $119,900 Active 106 DOM
-
2026-02-14$119,900 Active
ⓘ Source: listings_history table (triggers on properties + properties_extension) + one-shot
backfill from property_details.listing_events for pre-trigger history.
Tax reassessment forecast FL · Resets to sale price
- Current annual tax
- $698 · $58/mo
- Projected year-2 tax
- $995 · $83/mo
- Expected delta
- +$298/yr (+$25/mo · 42.7%)
ⓘ Screening estimate from a state-policy table — verify with the county assessor before closing.
Climate risk First Street
- Flood 1/10 Low FEMA zone X (unshaded) · 0% chance over 30 yrs
- Wildfire 1/10 Low
- Heat 9/10 Extreme 7 d/yr ≥107°F today · 26 d/yr by 30 yrs out
- Wind 10/10 Extreme 99% chance of damaging wind over 30 yrs
- Air quality 2/10 Low 2 unhealthy d/yr today · 2 by 30 yrs out
Nearby sold comps map
Loading sold comps map…
Walkable amenities ~0.75 mi
Loading nearby amenities…
Taxation est. · year 1
- Rental income
- $32,257
- − Mortgage interest
- −$6,716
- − Property taxes
- −$698
- − Insurance
- −$600
- − Repairs & maintenance
- −$2,581
- − Management
- −$2,581
- − HOA
- −$3,000
- − Depreciation
- −$3,488
- Taxable income
- $12,595
- Est. tax owed @ 24.0%
- −$3,023
- After-tax cash flow
- $10,618/yr
For passive investors: Depreciation is non-cash, so a rental often shows a tax loss while cash-flowing — sheltering income. Rental losses are passive: they offset passive income freely, and up to $25,000/yr can offset ordinary (W-2) income if you actively participate and your MAGI is under $100k (phasing out to $0 by $150k); unused losses carry forward. On sale, claimed depreciation is recaptured at up to 25%, and gains may owe capital-gains tax (a 1031 exchange can defer both). Figures are a year-1 estimate at your 24.0% rate — not tax advice; consult a CPA.
Schools (NCES district)
- District
- Palm Beach
- NCES district ID
- 1201500
- Math proficiency
- 46% ▼ -16.00%
- Reading proficiency
- 53% ▼ -4.00%
- Median HH income
- $53,943
- Composite
- 42.72/100
- National rank
- #3160
- State rank
- #34 of 73 in FL
Livability — Boca Raton
- Score
- 77/100
- State rank
- #192
- US rank
- #3070
Category grades
Schools grade is shown separately in the Schools card above.
Census & demographics
- County
- Palm Beach County · 1,438,312 people
- City population
- 250,102
- Metro
- Miami-Fort Lauderdale-Pompano Beach, FL
- Population (ZIP)
- 47,005
- Household income
- $84,091
- Rent vs Own
- Severe rent burden
- 2900.0
Population outlook (Palm Beach County) Hauer SSP2
- Today (2025)
- 1,637,487 people
- By 2030
- 1,743,255 · +6.5%
- By 2040
- 1,948,712 · +19.0%
- By 2050
- 2,132,979 · +30.3%
- By 2075
- 2,530,027 · +54.5%
- By 2100
- 2,706,979 · +65.3%
Race, ethnicity, and origin ACS 2023
- Neighborhood character
- Predominantly White (68%)
- Race & ethnicity
- White 68% Hispanic / Latino 18% Two or more races 15% Asian 4% Black 2%
- Hispanic origin (detail)
- Mexican 1% Puerto Rican 2% Cuban 2% Dominican 1%
- Common ancestry
- Romanian 6% Scotch-Irish 5% Russian 3%
- Foreign-born
- 27% · Canada, Jamaica, China
- Languages at home
- 65% English-only · Spanish 15% Other Indo-European 10% Russian/Polish/Slavic 3%
Political lean MEDSL · Palm Beach
- 2024 margin
- Toss-up / Even · D 50.0% · R 49.2%
- 2008→2024 swing
- -22.1pp toward R · 2008: 22.9pp · 2024: 0.8pp
- All cycles
- 2024: D+0.8 2020: D+12.8 2016: D+15.3 2012: D+17.0 2008: D+22.9
Not yet ingested
- Civics
- —
Market trends
- HPI YoY
- ▼ -227.85%
- Current HPI
- 306.738
- Rent YoY
- ▲ 0.33%
- Metro
- Miami-Fort Lauderdale-Pompano Beach, FL
- State GDP YoY
- ▲ 3.28%
- F500 in state
- 36
Industry mix (Fortune 500 HQ in FL)
| Industry | F500 HQs | Revenue |
|---|---|---|
| Industrial Technology | 2 | $29B |
|
||
| Insurance | 2 | $17B |
|
||
| Retail | 1 | $60B |
|
||
| Technology Distribution | 1 | $58B |
|
||
| Homebuilding | 1 | $35B |
|
||
| Technology Manufacturing | 1 | $35B |
|
||
Price history
1 event — show timeline
- 2026-02-14 Listed $119,900 Beaches MLS
Property tax history
+2.8%/yrLatest (2025): $698 · +5.0% YoY. Source: county tax records.
Cash-flow waterfall
monthlySold comps — $/sqft
last 12 mo · ≤1 miLoading sold comps…