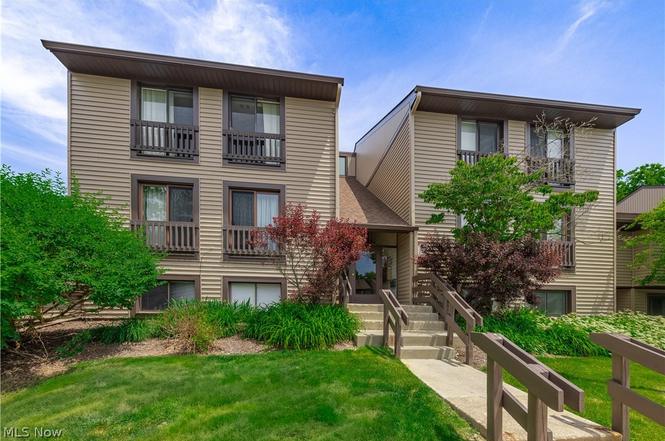
1115 Canyon View Rd #103 · Northfield, OH
Flood risk 1/10 · Minimal
- FEMA flood zone
- X (unshaded)
- Chance of flooding over 30 yrs
- 0.0%
- Est. flood insurance / yr
- $507 – $1,088
Fire risk 2/10 · Minimal
- Est. fire insurance / yr
- $713 – $1,323
Heat risk 3/10 · Minor
- Hot days now (above 97°F)
- 7 days/yr
- Hot days in 30 yrs
- 18 days/yr
Wind risk 1/10 · Minimal
- Chance of severe wind over 30 yrs
- —
Air-quality risk 2/10 · Minimal
- Unhealthy air days now
- 1 days/yr
- Unhealthy air days in 30 yrs
- 3 days/yr
Risk factors via First Street. Map © Google.
Why this score? — see what drove the D grade
The composite is a weighted blend of 9 inputs, each scored 0–100. Each bar is that input's sub-score; the figure is the points it added to the 100-point composite (weight × sub-score).
- Cash flow +9.2/30.0
- ARV discount +7.5/15.0
- Schools +6.6/10.0
- 1% rule +5.6/10.0
- Livability +4.0/5.0
- DSCR +2.6/10.0
- Rent growth +2.5/5.0
- Condition / age +2.5/5.0
- Appreciation +0.0/10.0
$175,000
🖨 Deal sheet 📄 Offer letter ✓ Due diligence
Listing remarks
Rarely does a Greenwood Village condo offer this level of craftsmanship and attention to detail! Enjoy carefree living in one the most desirable settings, where modern updates, exceptional amenities, and direct access to the natural beauty of the Cuyahoga Valley National Park come together. This one-of-a-kind unit offers open-concept living and dining areas filled with character and natural light, creating a warm and inviting atmosphere. The updated kitchen features granite countertops, an expansive breakfast bar, abundant cabinetry, and stunning custom built-ins with glass display shelving, and decorative millwork and detailed moldings add both elegance and functionality. Relax and unwind
Key facts
- Custom closet
- Enclosed sunroom
- Walk-in closet
Tags
Property features AI
Finance
- Financial info: Pets allowed: dogs and cats (with number limits)
- HOA & community: Homeowners association (Greenwood Village); Association fees: $273 semi-annually and $351.08 monthly; Association covers management, insurance, grounds and structure maintenance, parking, recreation facilities, snow removal, trash, and water; Community amenities include clubhouse, fitness center, lake, and playground
Exterior
- Parking: 1-car garage with garage door opener (garage faces side); Assigned parking; Additional parking available
- Utilities: Public water; Public sewer
- Home design: Single-story unit; Attached property; Updated/remodeled condition
- Construction: Wood siding exterior; Asphalt roof; Built according to public records
- Exterior features: Enclosed glass porch/patio; Patio; Porch; Private pool
Interior
- Kitchen: Built-in oven; Cooktop; Range; Dishwasher; Refrigerator
- Bedrooms: 2 main-level bedrooms
- Bathrooms: 2 full bathrooms (both on the main level)
- Heating & cooling: Forced air heating (gas); Central air conditioning
- Interior features: Breakfast bar; Eat-in kitchen; Granite counters; Open floorplan; Walk-in closet(s); Double pane windows
- Laundry & utility: In-unit washer and dryer
Neighborhood map
What this means for you Summary
Snapshot
- This is a 2-bed/2.0-bath condo listed at $175k.
Deal economics
- At list price, monthly cash flow is $-131 ($-2k/yr) — negative.
- To cash-flow at today's rent, offer at most $152k (13.2% below list).
- Meets the 1% rule at list price ($2k rent vs $175k).
- Recommended offer: $152k (13.2% below list) — sets the bar for cash-flow.
Location & tenants
- Location reads 79/100 on livability (#143 in OH, #2,208 nationally) — a middle-class / working-renter tenant base. Strengths: schools A+, crime A+, cost of living A+; Watch: amenities F, commute F.
- Nordonia Hills City (suburban): math 72% / reading 79% proficiency, ranked #71 of 656 in OH (top 11%) — strong family-tenant draw, lease renewals of 3-5y typical; only 17% free/reduced lunch — higher-income household profile.
- Market conditions: 69 active listings in the ZIP; solid renter incomes; 1,114 units permitted in Summit County in 2024 (397 in 5+ unit buildings).
Forward outlook
- Local home prices are declining (-3.0%/yr); year-one equity from $1k of loan paydown is wiped out by about $5k of value loss. Plan a longer hold.
- Summit County population projected to shrink 6% by 2050 — rents likely to lag national; underwrite the cash flow, not the appreciation.
Negotiation context
- Only 3 days on market — expect competitive offers; lowballing is unlikely to land.
- 4 sale attempts since 14y ago with the ask held roughly flat each time — persistent listings suggest the price (not the market) is what's stuck; bring a comps-based counter.
- Current owner paid $86k; list at $175k implies a 103% gain — meaningful room to come down on a strong offer.
Risks & watch-outs
- Watch-outs: HOA is 21% of rent.
Questions for the listing agent
- What do current leases actually rent for vs. the listed asking? Can we see a recent rent roll and the last 12 months of T-12 income?
- Built in 1973 — when were the roof, HVAC, electrical panel, plumbing, and water heater last replaced?
- What does the HOA fee cover, when was the last increase, and are there any pending special assessments or reserve-fund shortfalls?
- Any open or pending special assessments — roof, HVAC, plumbing, elevator, façade? What's the per-unit balance and payoff schedule, and is the seller paying it off at close or rolling it to the buyer?
- Is there a deadline driving the sale (1031 exchange, divorce, estate, relocation)? That informs how much negotiation room exists.
- Schools are A-rated — typically a magnet for longer-tenancy family renters. What's the average tenant stay here, and is there a school-zone premium baked into asking?
- The area grade is low — what's the realistic commute time and amenity access for the typical tenant pool here? Any planned neighborhood developments (good or bad) we should know about?
- What's the average days-on-market for RENTAL listings here right now (not sales)? A rising rental-DOM trend means longer vacancies and softer asking-rent achievability than the comps imply.
- What's the recent tenant-quality profile in this submarket — average credit score on applications, eviction rate, late-payment / NSF rate, and stable-employment percentage? A property-management company in the area should have these aggregated.
- How much new apartment / multifamily construction is in the pipeline within 1–3 miles? Heavy new supply (>2% of stock underway) typically softens rents 12–24 months out; light construction supports rent growth.
Investment metrics
- 1% rule
- 1.06% ✓
- Cap rate
- 5.40%
- Cash-on-cash
- -3.20%
- DSCR
- 0.86
- GRM
- 7.9
CMA / ARV
No comps found within radius.
Projected returns pro-forma
-3.0% appreciation · 3.0% rent growth · sell at horizon
- IRR
- -21.4%
- Equity multiple
- 0.26×
- Total profit
- $-36,418
- Equity at exit
- $26,093
- IRR
- -14.6%
- Equity multiple
- 0.16×
- Total profit
- $-41,355
- Equity at exit
- $15,131
Cash invested: $49,000 (down + closing). Projections, not guarantees.
Landlord ↔ Tenant lean methodology
- Overall (STATE)
- 73 Landlord-Friendly
- State Ohio
- 73 Landlord-Friendly · R+6
- County
- — inherits STATE
- City
- — inherits STATE
ZIP-level market 44067
- Active inventory
- 69
- Price-to-rent
- 7.9×
Monthly cashflow live
- Estimated rent
- $1,854 medium interval (Pro) →
- Mortgage (P&I)
- −$918
- Tax from tax record
- −$208 /mo · $2,500/yr
- Insurance
- −$73
- HOA
- −$396
- Vacancy / Maint / Mgmt
- −$389
- Net cashflow
- $-131
Break-even live
UW: 25.0% down · 7.5% · 30yr · 1.5% tax · 5.0% vac · 8.0% maint · 8.0% mgmt
Financing live
Cash to close
- Down payment
- $43,750
- Closing costs
- $5,250
- Reserves months
- —
- Total cash needed
- —
Loan-product check · same deal, 3 products live
Conventional
25% down · 7.5% · 30yr
- Down + closing
- —
- Monthly P&I
- —
- Monthly cashflow
- —
- DSCR
- —
- Eligible?
- —
Personal DTI + credit; lowest rate.
DSCR
20% down · 8.5% · 30yr
- Down + closing
- —
- Monthly P&I
- —
- Monthly cashflow
- —
- DSCR
- —
- Eligible?
- —
No personal income docs; deal must DSCR.
Hard money
10% down · 12.0% · 12mo
- Down + closing
- —
- Monthly P&I
- —
- Monthly cashflow
- —
- DSCR
- —
- Eligible?
- —
Short-term bridge; refi at stabilization.
HOA detail condo
- Monthly dues
- $396 · $4,752/yr
- Assessments
- None detected in remarks — confirm with the listing agent.
Listing history 4 events
-
2026-06-18days on market $175,000 Active 3 DOM
-
2026-06-17days on market $175,000 Active 2 DOM
-
2026-06-16remarks 699-char remark
-
2026-06-16$175,000 Active 1 DOM
ⓘ Source: listings_history table (triggers on properties + properties_extension) + one-shot
backfill from property_details.listing_events for pre-trigger history.
Tax reassessment forecast OH · Partial reset (capped growth)
- Current annual tax
- $2,500 · $208/mo
- Projected year-2 tax
- $2,615 · $218/mo
- Expected delta
- +$115/yr (+$10/mo · 4.6%)
ⓘ Screening estimate from a state-policy table — verify with the county assessor before closing.
Climate risk First Street
- Flood 1/10 Low FEMA zone X (unshaded) · 0% chance over 30 yrs
- Wildfire 2/10 Low
- Heat 3/10 Moderate 7 d/yr ≥97°F today · 18 d/yr by 30 yrs out
- Wind 1/10 Low
- Air quality 2/10 Low 1 unhealthy d/yr today · 3 by 30 yrs out
Nearby sold comps map
Loading sold comps map…
Walkable amenities ~0.75 mi
Loading nearby amenities…
Taxation est. · year 1
- Rental income
- $22,242
- − Mortgage interest
- −$9,803
- − Property taxes
- −$2,500
- − Insurance
- −$875
- − Repairs & maintenance
- −$1,779
- − Management
- −$1,779
- − HOA
- −$4,752
- − Depreciation
- −$5,091
- Taxable loss
- −$4,337
- Est. tax savings @ 24.0%
- +$1,041
- After-tax cash flow
- $-528/yr
For passive investors: Depreciation is non-cash, so a rental often shows a tax loss while cash-flowing — sheltering income. Rental losses are passive: they offset passive income freely, and up to $25,000/yr can offset ordinary (W-2) income if you actively participate and your MAGI is under $100k (phasing out to $0 by $150k); unused losses carry forward. On sale, claimed depreciation is recaptured at up to 25%, and gains may owe capital-gains tax (a 1031 exchange can defer both). Figures are a year-1 estimate at your 24.0% rate — not tax advice; consult a CPA.
Schools (NCES district)
- District
- Nordonia Hills City
- NCES district ID
- 3905004
- Math proficiency
- 72% ▼ -9.00%
- Reading proficiency
- 79% ▼ -3.00%
- Median HH income
- $74,658
- Composite
- 66.26/100
- National rank
- #428
- State rank
- #71 of 656 in OH
Livability — Northfield
- Score
- 79/100
- State rank
- #143
- US rank
- #2208
Category grades
Schools grade is shown separately in the Schools card above.
Census & demographics
- County
- Summit · 539,389 people
- Metro
- Akron, OH
- Population (ZIP)
- 19,917
- Household income
- $89,082
- Rent vs Own
- Severe rent burden
- 13.4
Population outlook (Summit County) Hauer SSP2
- Today (2025)
- 546,583 people
- By 2030
- 544,028 · -0.5%
- By 2040
- 531,363 · -2.8%
- By 2050
- 514,923 · -5.8%
- By 2075
- 481,765 · -11.9%
- By 2100
- 432,265 · -20.9%
Race, ethnicity, and origin ACS 2023
- Neighborhood character
- Predominantly White (85%)
- Race & ethnicity
- White 85% Black 6% Two or more races 4% Asian 3% Hispanic / Latino 2%
- Common ancestry
- Romanian 14% Slovak 3% Lithuanian 1%
- Foreign-born
- 6% · Canada, China
- Languages at home
- 94% English-only · Other Indo-European 2% Chinese 1% Spanish 1%
Political lean MEDSL · Summit
- 2024 margin
- Lean D (+7.0) · D 53.0% · R 46.0%
- 2008→2024 swing
- -9.6pp toward R · 2008: 16.6pp · 2024: 7.0pp
- All cycles
- 2024: D+7.0 2020: D+9.6 2016: D+8.2 2012: D+14.8 2008: D+16.6
Not yet ingested
- Civics
- —
Market trends
- HPI YoY
- ▼ -112.75%
- Current HPI
- 198.7729
- Rent YoY
- —
- Metro
- —
- State GDP YoY
- ▲ 1.98%
- F500 in state
- 48
Industry mix (Fortune 500 HQ in OH)
| Industry | F500 HQs | Revenue |
|---|---|---|
| Insurance | 3 | $145B |
|
||
| Industrial Machinery | 3 | $49B |
|
||
| Financial Services | 3 | $24B |
|
||
| Consumer Goods | 2 | $93B |
|
||
| Aerospace / Defense | 2 | $47B |
|
||
| Utilities | 2 | $33B |
|
||
Price history
+66.7% since first listed10 events — show timeline
- 2026-06-15 Listed $175,000 MLSNOW
- 2015-10-13 Sold (Public Records) $86,000 Public Records
- 2015-10-13 Sold (MLS) $86,000 MLSNOW
- 2015-08-28 Listing Removed — MLSNOW
- 2015-08-28 Listed $89,999 MLSNOW
- 2015-03-31 Listing Removed — MLSNOW
- 2015-03-04 Listed $97,000 MLSNOW
- 2012-07-30 Sold (Public Records) $92,000 Public Records
- 2012-07-30 Sold (MLS) $92,000 MLSNOW
- 2012-04-03 Listed $105,000 MLSNOW
Property tax history
+3.7%/yrLatest (2025): $2,500 · +12.4% YoY. Source: county tax records.
Cash-flow waterfall
monthlySold comps — $/sqft
last 12 mo · ≤1 miLoading sold comps…