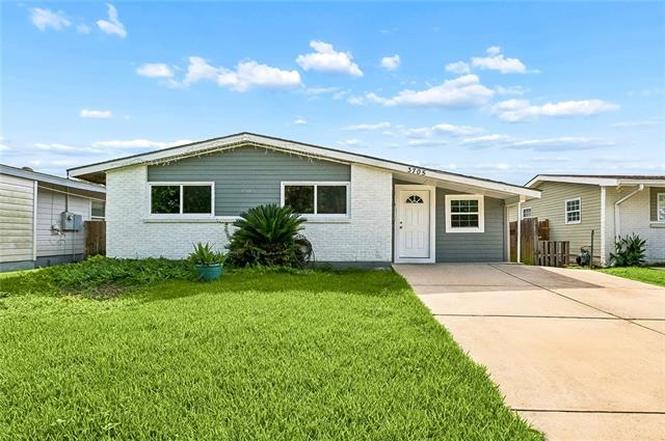
3705 Colorado St · Kenner, LA
Flood risk 8/10 · Major
- FEMA flood zone
- X
- Chance of flooding over 30 yrs
- 0.6%
- Est. flood insurance / yr
- $507 – $1,088
Fire risk 1/10 · Minimal
- Est. fire insurance / yr
- $1,269 – $2,357
Heat risk 10/10 · Severe
- Hot days now (above 108°F)
- 7 days/yr
- Hot days in 30 yrs
- 21 days/yr
Wind risk 10/10 · Severe
- Chance of severe wind over 30 yrs
- 99.0%
Air-quality risk 3/10 · Minor
- Unhealthy air days now
- 2 days/yr
- Unhealthy air days in 30 yrs
- 3 days/yr
Risk factors via First Street. Map © Google.
Why this score? — see what drove the C- grade
The composite is a weighted blend of 9 inputs, each scored 0–100. Each bar is that input's sub-score; the figure is the points it added to the 100-point composite (weight × sub-score).
- Cash flow +24.8/30.0
- DSCR +8.0/10.0
- 1% rule +5.5/10.0
- ARV discount +4.5/15.0
- Livability +3.9/5.0
- Schools +2.5/10.0
- Condition / age +2.5/5.0
- Rent growth +1.5/5.0
- Appreciation +0.0/10.0
$168,500
🖨 Deal sheet 📄 Offer letter ✓ Due diligence
Listing remarks MLS
Don't miss this charming Ranch Style home in a prime location near Williams Blvd. and West Esplanade! Featuring an open floor plan with 3 bedrooms and 2 bathrooms, this home also offers a spacious bonus room (12' x 22.5') that could be used for a home office, playroom, media room, or additional living space. The laundry room is conveniently located inside the home. Step outside to enjoy the nice backyard, complete with side-yard access for added convenience.
Key facts
- Open floor plan
- Laundry room
- Side-yard access
Tags
Property features AI
Exterior
- Parking: Driveway
- Utilities: Public water; Public sewer
- Home design: Single-story; Shingle roof; Average condition
- Construction: Slab foundation
- Exterior features: Fence; Outside city limits; Rectangular lot; Lot dimensions approximately 60 x 100
Interior
- Kitchen: Oven; Refrigerator
- Bathrooms: 2 full bathrooms
- Heating & cooling: Central air; Has heating
- Interior features: Ceiling fan(s)
- Laundry & utility: Washer hookup; Dryer hookup
Neighborhood map
What this means for you Summary
Snapshot
- This is a 3-bed/2.0-bath single-family listed at $168k.
Deal economics
- At list price, monthly cash flow is $288 ($3k/yr) — positive.
- The deal already cash-flows at list — no discount required.
- Meets the 1% rule at list price ($2k rent vs $168k).
- Cap rate 8.8% vs local median 5.3% in Kenner — top-decile yield for the area; either an underpriced asset or a hidden risk that comps aren't pricing in. Stress-test before assuming the spread holds.
Location & tenants
- Location reads 78/100 on livability (#6 in LA, #2,414 nationally) — a middle-class / working-renter tenant base. Strengths: cost of living A+, housing A+, health & safety A+; Watch: amenities C-, employment C-, crime D.
- Jefferson Parish (suburban): math 24% / reading 34% proficiency, ranked #44 of 98 in LA (top 45%) — low school quality limits family demand, transient renter base, plan for 1-2y turnover; 70% free/reduced lunch — lower-income household profile, screen leases tightly.
- Market conditions: Rents falling (-4.2%/yr); 292 active listings in the ZIP; 40 comparable units currently listed for rent nearby; rentals at typical pace (median 24d on market — plan ~3-4 weeks tenant-placement turnaround); 48% of comp listings sitting > 30 days — soft ceiling on asking rent; 518 units permitted in Jefferson Parish in 2024 (43 in 5+ unit buildings).
- This rent runs 32% of the median local income ($67k/yr) — at the standard rent-burdened threshold; future hikes will face affordability resistance.
Forward outlook
- Local home prices are declining (-3.0%/yr); year-one equity from $1k of loan paydown is wiped out by about $5k of value loss. Plan a longer hold.
Negotiation context
- Only 1 days on market — expect competitive offers; lowballing is unlikely to land.
- 3 sale attempts since 3y ago with the ask held roughly flat each time — persistent listings suggest the price (not the market) is what's stuck; bring a comps-based counter.
- Current owner paid $39k; list at $168k implies a 337% gain — meaningful room to come down on a strong offer.
Risks & watch-outs
- Watch-outs: flood insurance adds $66/mo; built in 1958 — expect roof / HVAC / electrical / plumbing capex.
- Climate carrying-cost: severe flood risk; severe wind risk, 99% chance of damaging wind over 30y; extreme-heat days projected 7→21/yr by 2055 (HVAC capex compounding) — expect insurance premiums to compound above CPI over the hold.
Questions for the listing agent
- Built in 1958 — when were the roof, HVAC, electrical panel, plumbing, and water heater last replaced?
- What's the actual annual flood-insurance premium (NFIP or private), and is the property in a SFHA with mandatory coverage?
- Is there a deadline driving the sale (1031 exchange, divorce, estate, relocation)? That informs how much negotiation room exists.
- Crime grade is D in this area — have there been break-ins, vandalism, or insurance claims at this property in the last 3 years? What carrier currently insures it and at what premium?
- What's the average days-on-market for RENTAL listings here right now (not sales)? A rising rental-DOM trend means longer vacancies and softer asking-rent achievability than the comps imply.
- What's the recent tenant-quality profile in this submarket — average credit score on applications, eviction rate, late-payment / NSF rate, and stable-employment percentage? A property-management company in the area should have these aggregated.
- How much new for-sale + rental construction is in the pipeline within 1–3 miles? Heavy new supply typically softens prices + rents 12–24 months out; constrained supply supports both.
Investment metrics
- 1% rule
- 1.05% ✓
- Cap rate
- 8.82%
- Cash-on-cash
- 9.02%
- DSCR
- 1.40
- GRM
- 7.9
CMA / ARV
- ARV (on-the-fly)
- $158,112
- Comps found
- 12
Show comp detail 12 sales within ~0.75 mi
| Address | Dist | Beds/Ba | Sqft | Sold | Price | $/sf | Match |
|---|---|---|---|---|---|---|---|
| 3612 California Ave | 0.09mi | 3/1.0 | 1,281 (-1%) | 3mo | $125,000 | $98 | 88 |
| 3711 Arkansas Ave | 0.12mi | 3/1.0 | 1,300 (+0%) | 3mo | $85,000 | $65 | 87 |
| 3620 Arkansas Ave | 0.10mi | 3/1.0 | 1,269 (-2%) | 4mo | $119,900 | $94 | 85 |
| 3620 Arizona Ave | 0.15mi | 3/2.0 | 1,400 (+8%) | 3mo | $189,900 | $136 | 77 |
| 3911 Connecticut Ave | 0.28mi | 2/2.0 (-1) | 1,265 (-2%) | 1mo | $180,000 | $142 | 77 |
| 3520 Colorado Ave | 0.16mi | 3/1.0 | 1,231 (-5%) | 4mo | $150,000 | $122 | 77 |
| 3811 Connecticut Ave | 0.16mi | 3/3.0 | 1,384 (+7%) | 7mo | $165,000 | $119 | 72 |
| 3907 Connecticut Ave | 0.26mi | 3/1.5 | 1,150 (-11%) | 1mo | $122,000 | $106 | 66 |
| 3512 California Ave | 0.20mi | 3/1.0 | 1,134 (-12%) | 0mo | $105,000 | $93 | 65 |
| 3321 California Ave | 0.44mi | 4/2.0 (+1) | 1,382 (+7%) | 0mo | $248,000 | $179 | 63 |
| 3933 Delaware Ave | 0.33mi | 4/2.0 (+1) | 1,448 (+12%) | 6mo | $235,000 | $162 | 55 |
| 3217 Illinois Ave | 0.75mi | 3/2.0 | 1,475 (+14%) | 6mo | $245,000 | $166 | 37 |
Match score weights: distance 35% · size 25% · config 20% · recency 20%. Top-matched comps best support the ARV.
Projected returns pro-forma
-3.0% appreciation · 0.0% rent growth · sell at horizon
- IRR
- -8.4%
- Equity multiple
- 0.70×
- Total profit
- $-14,152
- Equity at exit
- $25,124
- IRR
- -3.2%
- Equity multiple
- 0.81×
- Total profit
- $-8,810
- Equity at exit
- $14,569
Cash invested: $47,180 (down + closing). Projections, not guarantees.
Landlord ↔ Tenant lean methodology
- Overall (STATE)
- 90 Strongly Landlord-Friendly
- State Louisiana
- 90 Strongly Landlord-Friendly · R+12
- County
- — inherits STATE
- City
- — inherits STATE
ZIP-level market 70065
- Rents YoY
- -4.2%
- Active inventory
- 292
- Price-to-rent
- 7.9×
Monthly cashflow live
- Estimated rent
- $1,776 high interval (Pro) →
- Mortgage (P&I)
- −$884
- Tax from tax record
- −$94 /mo · $1,132/yr
- Insurance
- −$70
- Flood insurance flood zone
- −$66 /mo · $798/yr
- HOA
- −$0
- Vacancy / Maint / Mgmt
- −$373
- Net cashflow
- $288
Break-even live
UW: 25.0% down · 7.5% · 30yr · 1.5% tax · 5.0% vac · 8.0% maint · 8.0% mgmt
Financing live
Cash to close
- Down payment
- $42,125
- Closing costs
- $5,055
- Reserves months
- —
- Total cash needed
- —
Loan-product check · same deal, 3 products live
Conventional
25% down · 7.5% · 30yr
- Down + closing
- —
- Monthly P&I
- —
- Monthly cashflow
- —
- DSCR
- —
- Eligible?
- —
Personal DTI + credit; lowest rate.
DSCR
20% down · 8.5% · 30yr
- Down + closing
- —
- Monthly P&I
- —
- Monthly cashflow
- —
- DSCR
- —
- Eligible?
- —
No personal income docs; deal must DSCR.
Hard money
10% down · 12.0% · 12mo
- Down + closing
- —
- Monthly P&I
- —
- Monthly cashflow
- —
- DSCR
- —
- Eligible?
- —
Short-term bridge; refi at stabilization.
Rent comps 40 comps
| Address | Beds | Baths | Sqft | Rent | $/sqft | DOM | Units | Dist |
|---|---|---|---|---|---|---|---|---|
| 3611 Arizona Ave Kenner, LA | 4.0 | 2.0 | 1287 | $1,900 | $1.48 | 4d | 1 | 0.20mi |
| 1500 W Esplanade Ave Kenner, LA | 3.0 | 2.0 | 1725 | $1,750 | $1.01 | 2d | 2 | 0.35mi |
| 1500 W Esplanade Ave Unit 29D Kenner, LA | 3.0 | 2.0 | 1725 | $1,900 | $1.10 | 1d | 1 | 0.35mi |
| 1500 W Esplanade Ave Kenner, LA | 2.0–3.0 | 2.0 | 1587 | $2,000 | $1.26 | 43d | 1 | 0.35mi |
| 3423 Delaware Ave Kenner, LA | 4.0 | 2.0 | 1215 | $1,800 | $1.48 | 4d | 1 | 0.36mi |
| 1400 W Esplanade Ave Kenner, LA | 2.0 | 1.0–2.5 | 801 | $1,370 | $1.71 | 43d | 1 | 0.39mi |
| 49 Antigua Dr Unit C Kenner, LA | 2.0 | 1.5 | 1150 | $1,450 | $1.26 | 43d | 1 | 0.43mi |
| 53 Antigua Dr Unit D Kenner, LA | 2.0 | 1.5 | 1325 | $1,500 | $1.13 | 23d | 1 | 0.43mi |
| 4018 Arkansas Ave Kenner, LA | 3.0 | 2.0 | 1200 | $1,800 | $1.50 | 3d | 1 | 0.46mi |
| 1740 Vintage Dr Unit A Kenner, LA | 2.0 | 1.5 | 1019 | $1,250 | $1.23 | 43d | 1 | 0.52mi |
| 1740 Vintage Dr Unit C Kenner, LA | 2.0 | 1.5 | 1019 | $1,150 | $1.13 | 43d | 1 | 0.52mi |
| 3308 Delaware Ave Unit C Kenner, LA | 2.0 | 1.5 | 1125 | $1,400 | $1.24 | 43d | 1 | 0.52mi |
| 4101 Delaware Ave #6 Kenner, LA | 2.0 | 1.5 | 1050 | $1,350 | $1.29 | 23d | 1 | 0.53mi |
| 4101 Delaware Ave Kenner, LA | 2.0 | 1.5 | 1100 | $1,499 | $1.36 | 43d | 1 | 0.53mi |
| 3304 Delaware Ave Unit B Kenner, LA | 2.0 | 1.5 | 1100 | $1,295 | $1.18 | 4d | 1 | 0.53mi |
| 1617 Newport Pl #23 Kenner, LA | 2.0 | 1.5 | 1125 | $1,395 | $1.24 | 4d | 1 | 0.57mi |
| 1617 Newport Pl #23 Kenner, LA | 2.0 | 1.5 | 1125 | $1,400 | $1.24 | 43d | 1 | 0.57mi |
| 1600 Newport Pl #4 Kenner, LA | 3.0 | 2.0 | 1400 | $1,550 | $1.11 | 3d | 1 | 0.57mi |
| 61 Emile Ave Kenner, LA | 3.0 | 2.0 | 1450 | $1,900 | $1.31 | 44d | 1 | 0.58mi |
| 1620 Newport Pl Kenner, LA | 3.0 | 2.0 | 1450 | $1,550 | $1.07 | 4d | 1 | 0.59mi |
| 1616 Newport Pl Unit A Kenner, LA | 3.0 | 2.0 | 1100 | $1,500 | $1.36 | 43d | 1 | 0.60mi |
| 1717 42nd St Unit D Kenner, LA | 3.0 | 2.0 | 1380 | $1,550 | $1.12 | 43d | 1 | 0.60mi |
| 1625 42nd St Kenner, LA | 3.0 | 2.0 | 1550 | $1,550 | $1.00 | 43d | 1 | 0.62mi |
| 1621 42nd St Kenner, LA | 3.0 | 2.0 | 1550 | $1,550 | $1.00 | 43d | 1 | 0.62mi |
| 1201 W Esplanade Ave Kenner, LA | 1.0–2.0 | 1.0–2.0 | 746 | $1,110 | $1.49 | 43d | 1 | 0.64mi |
| 4144 Georgia Ave Unit D Kenner, LA | 2.0 | 2.0 | 1050 | $1,450 | $1.38 | 23d | 1 | 0.68mi |
| 4145 Idaho Ave Unit D Kenner, LA | 2.0 | 2.5 | 1200 | $1,550 | $1.29 | 43d | 1 | 0.69mi |
| 2150 42nd St Unit D226 Kenner, LA | 2.0 | 2.0 | 1612 | $1,820 | $1.13 | 23d | 1 | 0.74mi |
| 2150 42nd St Unit A301 Kenner, LA | 2.0 | 2.0 | 1100 | $1,395 | $1.27 | 4d | 1 | 0.74mi |
| 2150 42nd St Unit B316 Kenner, LA | 2.0 | 2.0 | 1100 | $1,410 | $1.28 | 4d | 1 | 0.74mi |
| 2150 42nd St Unit B310 Kenner, LA | 2.0 | 2.0 | 1100 | $1,495 | $1.36 | 14d | 1 | 0.74mi |
| 3245 Iowa Ave Kenner, LA | 4.0 | 2.0 | 1800 | $2,300 | $1.28 | 21d | 1 | 0.75mi |
| 4245 Illinois Ave Kenner, LA | 3.0 | 2.0 | 1720 | $2,300 | $1.34 | 43d | 1 | 0.83mi |
| 3318 Cannes Pl Kenner, LA | 3.0 | 2.0 | 1700 | $2,100 | $1.24 | 43d | 1 | 0.83mi |
| 4329 Idaho Ave Unit B Kenner, LA | 2.0 | 1.5 | 1120 | $1,425 | $1.27 | 21d | 1 | 0.89mi |
| 4129 Chateau Blvd Unit C Kenner, LA | 2.0 | 1.5 | 1400 | $1,425 | $1.02 | 4d | 1 | 0.92mi |
| 1516 Mayfield St Kenner, LA | 3.0 | 2.0 | 1407 | $1,900 | $1.35 | 44d | 1 | 0.92mi |
| 1516 Mayfield St Kenner, LA | 3.0 | 2.0 | 1407 | $1,900 | $1.35 | 43d | 1 | 0.92mi |
| 4520 Williams Blvd Kenner, LA | 2.0 | 1.0 | 738 | $1,310 | $1.78 | 1d | 15 | 0.93mi |
| 3136 Lexington Ave Kenner, LA | 4.0 | 3.0 | 1722 | $2,300 | $1.34 | 23d | 1 | 0.94mi |
Listing history 2 events
-
2026-06-18remarks 462-char remark
-
2026-06-18$168,500 Active 1 DOM
ⓘ Source: listings_history table (triggers on properties + properties_extension) + one-shot
backfill from property_details.listing_events for pre-trigger history.
Tax reassessment forecast LA · Resets to sale price
- Current annual tax
- $1,132 · $94/mo
- Projected year-2 tax
- $1,132 · $94/mo
- Expected delta
- $0/yr ($0/mo · 0.0%)
ⓘ Screening estimate from a state-policy table — verify with the county assessor before closing.
Climate risk First Street
- Flood 8/10 Severe FEMA zone X · 60% chance over 30 yrs
- Wildfire 1/10 Low
- Heat 10/10 Extreme 7 d/yr ≥108°F today · 21 d/yr by 30 yrs out
- Wind 10/10 Extreme 99% chance of damaging wind over 30 yrs
- Air quality 3/10 Moderate 2 unhealthy d/yr today · 3 by 30 yrs out
Nearby sold comps map
Loading sold comps map…
Walkable amenities ~0.75 mi
Loading nearby amenities…
Taxation est. · year 1
- Rental income
- $21,309
- − Mortgage interest
- −$9,439
- − Property taxes
- −$1,132
- − Insurance
- −$1,640
- − Repairs & maintenance
- −$1,705
- − Management
- −$1,705
- − Depreciation
- −$4,902
- Taxable income
- $788
- Est. tax owed @ 24.0%
- −$189
- After-tax cash flow
- $3,270/yr
For passive investors: Depreciation is non-cash, so a rental often shows a tax loss while cash-flowing — sheltering income. Rental losses are passive: they offset passive income freely, and up to $25,000/yr can offset ordinary (W-2) income if you actively participate and your MAGI is under $100k (phasing out to $0 by $150k); unused losses carry forward. On sale, claimed depreciation is recaptured at up to 25%, and gains may owe capital-gains tax (a 1031 exchange can defer both). Figures are a year-1 estimate at your 24.0% rate — not tax advice; consult a CPA.
Schools (NCES district)
- District
- Jefferson Parish
- NCES district ID
- 2200840
- Math proficiency
- 24% ▼ -36.00%
- Reading proficiency
- 34% ▼ -30.00%
- Median HH income
- $48,421
- Composite
- 25.19/100
- National rank
- #7511
- State rank
- #44 of 98 in LA
Livability — Kenner
- Score
- 78/100
- State rank
- #6
- US rank
- #2414
Category grades
Schools grade is shown separately in the Schools card above.
Census & demographics
- Census place
- Kenner, LA
- County
- Jefferson Parish · 426,999 people
- City population
- 66,707
- Metro
- New Orleans-Metairie, LA
- Population (ZIP)
- 48,936
- Household income
- $67,285
- Rent vs Own
- Severe rent burden
- 1906.0
Population outlook (Jefferson County) Hauer SSP2
- Today (2025)
- 451,696 people
- By 2030
- 455,451 · +0.8%
- By 2040
- 458,308 · +1.5%
- By 2050
- 461,031 · +2.1%
- By 2075
- 476,351 · +5.5%
- By 2100
- 499,377 · +10.6%
Race, ethnicity, and origin ACS 2023
- Neighborhood character
- Diverse neighborhood (Simpson 0.69)
- Race & ethnicity
- White 47% Hispanic / Latino 27% Two or more races 15% Black 15% Asian 6%
- Hispanic origin (detail)
- Mexican 2% Puerto Rican 3% Cuban 2%
- Common ancestry
- Lithuanian 9% Slovak 1% Italian 1%
- Foreign-born
- 19% · Canada, China, Vietnam
- Languages at home
- 72% English-only · Spanish 21% Other Indo-European 3% Arabic 1%
Political lean MEDSL · Jefferson
- 2024 margin
- R (+12.9) · D 42.5% · R 55.5% · Other 2.1%
- 2008→2024 swing
- +13.6pp toward D · 2008: -26.6pp · 2024: -12.9pp
- All cycles
- 2024: R+12.9 2020: R+11.1 2016: R+14.8 2012: R+18.4 2008: R+26.6
Not yet ingested
- Civics
- —
Market trends
- HPI YoY
- ▼ -214.79%
- Current HPI
- 139.5115
- Rent YoY
- ▼ -4.19%
- Metro
- New Orleans-Metairie, LA
- State GDP YoY
- ▲ 3.29%
- F500 in state
- 10
Industry mix (Fortune 500 HQ in LA)
| Industry | F500 HQs | Revenue |
|---|---|---|
| Telecommunications | 2 | $23B |
|
||
| Utilities | 1 | $12B |
|
||
| Wholesale / Distribution | 1 | $5B |
|
||
| Advertising | 1 | $2B |
|
||
Price history
+337.1% since first listed5 events — show timeline
- 2026-06-16 Listed $168,500 AcadianaMLS
- 2026-06-16 Listed $168,500 GSREIN
- 2023-10-28 Rental Removed $1,675 GSREIN
- 2023-08-18 Listed for Rent $1,675 GSREIN
- 1985-12-01 Sold (Public Records) $38,550 Public Records
Property tax history
+2.5%/yrLatest (2025): $1,132 · -0.4% YoY. Source: county tax records.
Cash-flow waterfall
monthlySold comps — $/sqft
last 12 mo · ≤1 miLoading sold comps…