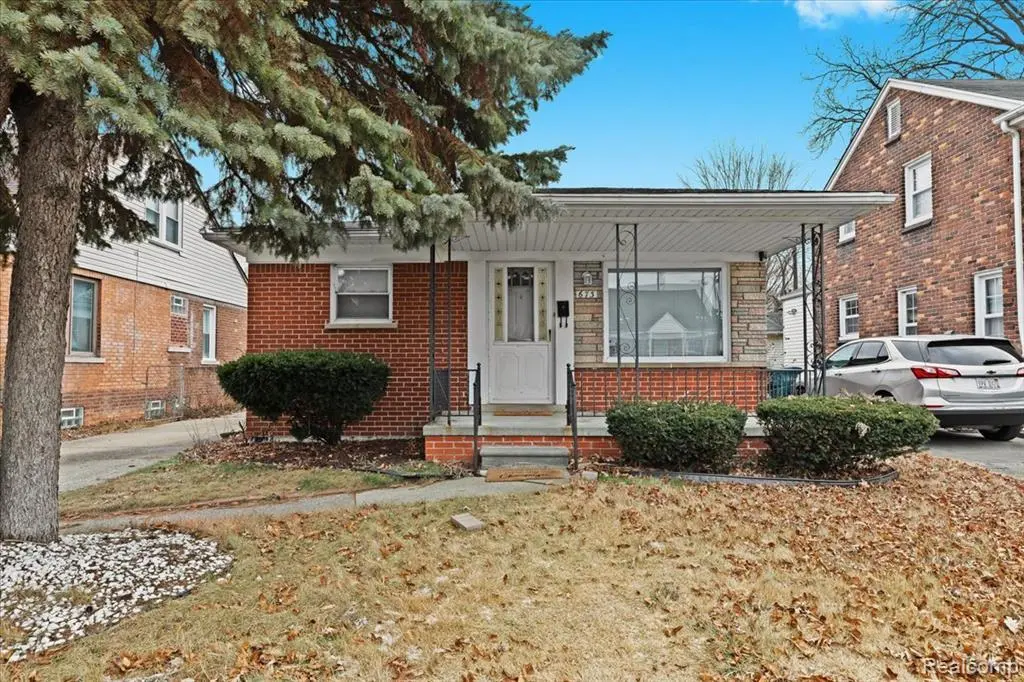
673 Winchester Ave · Lincoln Park, MI
Flood risk 3/10 · Minor
- FEMA flood zone
- X (unshaded)
- Chance of flooding over 30 yrs
- 0.2%
- Est. flood insurance / yr
- $473 – $860
Fire risk 1/10 · Minimal
- Est. fire insurance / yr
- $784 – $1,456
Heat risk 3/10 · Minor
- Hot days now (above 96°F)
- 7 days/yr
- Hot days in 30 yrs
- 15 days/yr
Wind risk 2/10 · Minimal
- Chance of severe wind over 30 yrs
- —
Air-quality risk 3/10 · Minor
- Unhealthy air days now
- 3 days/yr
- Unhealthy air days in 30 yrs
- 5 days/yr
Risk factors via First Street. Map © Google.
Why this score? — see what drove the F grade
The composite is a weighted blend of 9 inputs, each scored 0–100. Each bar is that input's sub-score; the figure is the points it added to the 100-point composite (weight × sub-score).
- Cash flow +8.8/30.0
- Livability +4.0/5.0
- Rent growth +3.7/5.0
- 1% rule +2.5/10.0
- Condition / age +2.5/5.0
- DSCR +2.4/10.0
- Schools +2.0/10.0
- ARV discount +0.0/15.0
- Appreciation +0.0/10.0
$174,900
🖨 Deal sheet (PDF) 📄 Offer letter ✓ Due diligence
Listing remarks MLS
OPPORTUNITY AWAITS WITH THIS CHARMING 3-BEDROOM, 1-BATH RANCH FULL OF POTENTIAL! THE SPACIOUS EAT-IN KITCHEN OPENS TO THE LIVING ROOM THROUGH A LARGE PASS-THROUGH WALL, CREATING A BRIGHT AND CONNECTED LIVING SPACE. EACH BEDROOM FEATURES GENEROUS CLOSET SPACE. HARDWOOD FLOORS RUN THROUGHOUT MUCH OF THE MAIN LEVEL, ADDING WARMTH AND CHARACTER. THE OVERSIZED FULL BATH OFFERS SOLID BONES ALONG WITH A LARGE LINEN CLOSET FOR EXTRA STORAGE. A PARTIALLY FINISHED BASEMENT PROVIDING ENDLESS POSSIBILITIES AND COULD NEARLY DOUBLE YOUR LIVING SPACE ONCE FINISHED. ALL APPLIANCES ARE INCLUDED. WONDERFUL LOCATION, CLOSE TO SHOPPING, FREEWAY, AND SCHOOLS! ALL DATA IS APPROXIMATE. BUYERS AGENT TO VERIFY ALL INFORMATION.
Key facts
- Large linen closet
- Oversized full bath
- Eat-in kitchen
Tags
Property features AI
Exterior
- Parking: No garage
- Utilities: Public water; Public sewer
- Home design: Single-family residence; One story; Ground-level entry with steps; Brick construction
- Construction: Block foundation
- Exterior features: Paved road access; No pool
Interior
- Bedrooms: Total rooms: 5
- Bathrooms: One full bathroom
- Heating & cooling: Central air conditioning; Forced air heating; Natural gas heating
- Interior features: Partially finished basement; Basement present
Neighborhood map
What this means for you Summary
Snapshot
- This is a 3-bed/1.0-bath single-family listed at $175k.
Deal economics
- At list price, monthly cash flow is $-145 ($-2k/yr) — negative.
- To cash-flow at today's rent, offer at most $149k (14.7% below list).
- To meet the 1% rule (rent ≥ 1% of price), the offer needs to be $132k (24.5% below list).
- Recommended offer: $132k (24.5% below list) — sets the bar for 1% rule.
Location & tenants
- Location reads 80/100 on livability (#82 in MI, #1,720 nationally) — a professional / high-income tenant draw. Strengths: amenities A+, commute A+, cost of living A+; Watch: crime F, employment D-.
- Lincoln Park School District (suburban): math 15% / reading 32% proficiency, ranked #440 of 540 in MI (top 82%) — low school quality limits family demand, transient renter base, plan for 1-2y turnover; 72% free/reduced lunch — lower-income household profile, screen leases tightly.
- Zoned schools: Earl F Carr School (math 27% / reading 42%, grade F, #744 of 1,397 statewide, top 57%, 290 students, 90% FRL); Lincoln Park Middle School (math 12% / reading 35%, grade F, #399 of 493 statewide, top 81%, 1,105 students, 86% FRL); Lincoln Park High School (math 5% / reading 33%, grade F, #630 of 713 statewide, top 88%, 1,367 students, 79% FRL).
- Market conditions: Rents rising fast (+4.7%/yr); 154 active listings in the ZIP; 27 comparable units currently listed for rent nearby; rentals at typical pace (median 17d on market — plan ~3-4 weeks tenant-placement turnaround); 2,639 units permitted in Wayne County in 2024 (1,216 in 5+ unit buildings).
Forward outlook
- Local home prices are declining (-3.0%/yr); year-one equity from $1k of loan paydown is wiped out by about $5k of value loss. Plan a longer hold.
- Wayne County population projected at -17% by 2050 — secular population decline; favor cash flow + early exit over multi-decade hold.
Negotiation context
- Only 3 days on market — expect competitive offers; lowballing is unlikely to land.
- 6 sale attempts since 13y ago with the ask held roughly flat each time — persistent listings suggest the price (not the market) is what's stuck; bring a comps-based counter.
- Current owner paid $30k; list at $175k implies a 493% gain — meaningful room to come down on a strong offer.
Questions for the listing agent
- What do current leases actually rent for vs. the listed asking? Can we see a recent rent roll and the last 12 months of T-12 income?
- Built in 1963 — when were the roof, HVAC, electrical panel, plumbing, and water heater last replaced?
- Is there a deadline driving the sale (1031 exchange, divorce, estate, relocation)? That informs how much negotiation room exists.
- Schools are D-rated, which usually means shorter tenancies and higher turnover. Who's the typical renter profile here, and what's been the actual vacancy rate?
- Crime grade is F in this area — have there been break-ins, vandalism, or insurance claims at this property in the last 3 years? What carrier currently insures it and at what premium?
- The area grade is low — what's the realistic commute time and amenity access for the typical tenant pool here? Any planned neighborhood developments (good or bad) we should know about?
- What's the average days-on-market for RENTAL listings here right now (not sales)? A rising rental-DOM trend means longer vacancies and softer asking-rent achievability than the comps imply.
- What's the recent tenant-quality profile in this submarket — average credit score on applications, eviction rate, late-payment / NSF rate, and stable-employment percentage? A property-management company in the area should have these aggregated.
- How much new for-sale + rental construction is in the pipeline within 1–3 miles? Heavy new supply typically softens prices + rents 12–24 months out; constrained supply supports both.
Investment metrics
- 1% rule
- 0.75% ✗
- Cap rate
- 5.29%
- Cash-on-cash
- -3.57%
- DSCR
- 0.84
- GRM
- 11.0
CMA / ARV
- ARV (on-the-fly)
- $144,960
- Comps found
- 12
Show comp detail 12 sales within ~0.75 mi
| Address | Dist | Beds/Ba | Sqft | Sold | Price | $/sf | Match |
|---|---|---|---|---|---|---|---|
| 816 London Ave | 0.37mi | 3/1.0 | 944 (-2%) | 2mo | $187,000 | $198 | 78 |
| 939 Stewart Ave | 0.37mi | 3/1.0 | 912 (-5%) | 1mo | $138,000 | $151 | 73 |
| 866 Clinton St | 0.47mi | 3/1.0 | 1,000 (+4%) | 2mo | $177,500 | $178 | 70 |
| 673 Leblanc St | 0.40mi | 3/1.0 | 1,092 (+14%) | 1mo | $177,900 | $163 | 58 |
| 981 Harrison Blvd | 0.74mi | 2/1.0 (-1) | 952 (-1%) | 5mo | $142,500 | $150 | 55 |
| 645 Riverbank St | 0.59mi | 3/1.5 | 1,036 (+8%) | 4mo | $165,000 | $159 | 54 |
| 573 Leblanc St | 0.41mi | 3/1.0 | 1,092 (+14%) | 5mo | $133,000 | $122 | 54 |
| 2458 River Dr | 0.55mi | 3/1.0 | 1,078 (+12%) | 1mo | $144,000 | $134 | 53 |
| 654 Ford Blvd | 0.43mi | 3/1.0 | 1,100 (+15%) | 4mo | $150,000 | $136 | 52 |
| 677 Lindbergh St | 0.70mi | 2/1.0 (-1) | 900 (-6%) | 1mo | $164,000 | $182 | 51 |
| 552 Bondie St | 0.72mi | 3/1.0 | 1,041 (+8%) | 4mo | $120,000 | $115 | 49 |
| 1120 Mayflower Ave | 0.71mi | 3/1.0 | 864 (-10%) | 2mo | $100,000 | $116 | 48 |
Match score weights: distance 35% · size 25% · config 20% · recency 20%. Top-matched comps best support the ARV.
Projected returns pro-forma
-3.0% appreciation · 4.65% rent growth · sell at horizon
- IRR
- -20.5%
- Equity multiple
- 0.28×
- Total profit
- $-35,373
- Equity at exit
- $26,078
- IRR
- -10.5%
- Equity multiple
- 0.32×
- Total profit
- $-33,251
- Equity at exit
- $15,122
Cash invested: $48,972 (down + closing). Projections, not guarantees.
Landlord ↔ Tenant lean methodology
- Overall (STATE)
- 62 Landlord-Friendly
- State Michigan
- 62 Landlord-Friendly · EVEN
- County
- — inherits STATE
- City
- — inherits STATE
ZIP-level market 48146
- Home prices YoY
- -32.7%
- Rents YoY
- 4.7%
- Active inventory
- 154
- Price-to-rent
- 11.0×
Monthly cashflow live
- Estimated rent
- $1,320 high interval (Pro) →
- Mortgage (P&I)
- −$917
- Tax from tax record
- −$198 /mo · $2,378/yr
- Insurance
- −$73
- HOA
- −$0
- Vacancy / Maint / Mgmt
- −$277
- Net cashflow
- $-145
Break-even live
Sensitivity live
| Price | -10% $-46 | -5% $-96 | +0% $-145 | +5% $-195 | +10% $-244 |
|---|---|---|---|---|---|
| Rent | -10% $-250 | -5% $-198 | +0% $-145 | +5% $-93 | +10% $-41 |
| Rate | -1.0pp $-57 | -0.5pp $-101 | base $-145 | +0.5pp $-191 | +1.0pp $-237 |
UW: 25.0% down · 7.5% · 30yr · 1.5% tax · 5.0% vac · 8.0% maint · 8.0% mgmt
Financing live
Cash to close
- Down payment
- $43,725
- Closing costs
- $5,247
- Reserves months
- —
- Total cash needed
- —
Loan-product check · same deal, 3 products live
Conventional
25% down · 7.5% · 30yr
- Down + closing
- —
- Monthly P&I
- —
- Monthly cashflow
- —
- DSCR
- —
- Eligible?
- —
Personal DTI + credit; lowest rate.
DSCR
20% down · 8.5% · 30yr
- Down + closing
- —
- Monthly P&I
- —
- Monthly cashflow
- —
- DSCR
- —
- Eligible?
- —
No personal income docs; deal must DSCR.
Hard money
10% down · 12.0% · 12mo
- Down + closing
- —
- Monthly P&I
- —
- Monthly cashflow
- —
- DSCR
- —
- Eligible?
- —
Short-term bridge; refi at stabilization.
Rent comps 27 comps
| Address | Beds | Baths | Sqft | Rent | $/sqft | DOM | Units | Dist |
|---|---|---|---|---|---|---|---|---|
| 708 Highland St Unit 1 Wyandotte, MI | 2.0 | 1.0 | 800 | $950 | $1.19 | 19d | 1 | 0.47mi |
| 750 Harrison Blvd Unit 5 Lincoln Park, MI | 2.0 | 1.0 | 800 | $995 | $1.24 | 6d | 1 | 0.63mi |
| 610 Harrison Blvd Unit 46 Lincoln Park, MI | 2.0 | 1.0 | 800 | $995 | $1.24 | 4d | 1 | 0.64mi |
| 610 Harrison Blvd Apt 43 Lincoln Park, MI | 2.0 | 1.0 | 800 | $1,050 | $1.31 | 26d | 1 | 0.64mi |
| 720 Harrison Blvd Unit 20 Lincoln Park, MI | 2.0 | 1.0 | 800 | $1,025 | $1.28 | 4d | 1 | 0.64mi |
| 1343 Pagel Ave Unit 2-Upper Lincoln Park, MI | 2.0 | 1.0 | 1000 | $1,250 | $1.25 | 19d | 1 | 0.66mi |
| 424 4th St Wyandotte, MI | 2.0 | 1.0 | 925 | $1,350 | $1.46 | 26d | 1 | 0.74mi |
| 1163 17th St Wyandotte, MI | 3.0 | 1.0 | 1010 | $1,695 | $1.68 | 45d | 1 | 0.94mi |
| 177 N Riverbank St Wyandotte, MI | 2.0 | 1.0 | 671 | $1,600 | $2.38 | 0d | 1 | 0.98mi |
| 1130 21st St Wyandotte, MI | 3.0 | 1.0 | 864 | $1,420 | $1.64 | 0d | 1 | 0.98mi |
| 170 Bondie St Wyandotte, MI | 3.0 | 1.0 | 1080 | $1,399 | $1.30 | 4d | 1 | 1.00mi |
| 168 Bondie St Wyandotte, MI | 3.0 | 1.0 | 1080 | $1,295 | $1.20 | 6d | 1 | 1.00mi |
| 4573 3rd St Ecorse, MI | 2.0 | 1.0 | 1000 | $1,300 | $1.30 | 16d | 1 | 1.01mi |
| 146 Bondie St Wyandotte, MI | 2.0 | 1.0 | 820 | $1,650 | $2.01 | 0d | 1 | 1.02mi |
| 1581 Empire Ave Lincoln Park, MI | 2.0 | 1.0 | 900 | $1,350 | $1.50 | 26d | 1 | 1.08mi |
| 850 Biddle Ave Unit 2 Wyandotte, MI | 2.0 | 1.0 | 800 | $1,300 | $1.62 | 0d | 1 | 1.12mi |
| 1159 McKinley St Wyandotte, MI | 3.0 | 1.0 | 1050 | $1,350 | $1.29 | 0d | 1 | 1.13mi |
| 1650 19th St Wyandotte, MI | 3.0 | 2.0 | 1100 | $1,899 | $1.73 | 19d | 1 | 1.16mi |
| 4581 High St Unit 13 Ecorse, MI | 2.0 | 1.0 | 700 | $1,050 | $1.50 | 26d | 1 | 1.19mi |
| 1750 Saint Johns Blvd Unit 17 Lincoln Park, MI | 2.0 | 1.0 | 750 | $1,025 | $1.37 | 26d | 1 | 1.20mi |
| 1760 Saint Johns Blvd Apt 14 Lincoln Park, MI | 2.0 | 1.0 | 750 | $995 | $1.33 | 26d | 1 | 1.21mi |
| 4163 Burns Ave Lincoln Park, MI | 3.0 | 1.0 | 900 | $1,500 | $1.67 | 3d | 1 | 1.27mi |
| 1537 Chandler Ave Lincoln Park, MI | 2.0 | 1.0 | 725 | $1,100 | $1.52 | 19d | 1 | 1.32mi |
| 1331 Pingree Ave Lincoln Park, MI | 2.0 | 1.0 | 725 | $1,300 | $1.79 | 1d | 1 | 1.32mi |
| 4471 High St Unit 81-13 Ecorse, MI | 2.0 | 1.0 | 700 | $1,050 | $1.50 | 26d | 1 | 1.33mi |
| 4471 High St Unit 71-7 Ecorse, MI | 2.0 | 1.0 | 700 | $1,150 | $1.64 | 26d | 1 | 1.33mi |
| 4435 High St Ecorse, MI | 2.0 | 1.0 | 792 | $1,095 | $1.38 | 6d | 1 | 1.39mi |
Listing history 3 events
-
2026-06-21days on market $174,900 Active 3 DOM
-
2026-06-19remarks 699-char remark
-
2026-06-19$174,900 Active 1 DOM
ⓘ Source: listings_history table (triggers on properties + properties_extension) + one-shot
backfill from property_details.listing_events for pre-trigger history.
Tax reassessment forecast MI · Partial reset (capped growth)
- Current annual tax
- $2,378 · $198/mo
- Projected year-2 tax
- $2,536 · $211/mo
- Expected delta
- +$158/yr (+$13/mo · 6.6%)
ⓘ Screening estimate from a state-policy table — verify with the county assessor before closing.
Climate risk First Street
- Flood 3/10 Moderate FEMA zone X (unshaded) · 20% chance over 30 yrs
- Wildfire 1/10 Low
- Heat 3/10 Moderate 7 d/yr ≥96°F today · 15 d/yr by 30 yrs out
- Wind 2/10 Low
- Air quality 3/10 Moderate 3 unhealthy d/yr today · 5 by 30 yrs out
Nearby sold comps map
Loading sold comps map…
Walkable amenities ~0.75 mi
Loading nearby amenities…
Taxation est. · year 1
- Rental income
- $15,839
- − Mortgage interest
- −$9,797
- − Property taxes
- −$2,378
- − Insurance
- −$874
- − Repairs & maintenance
- −$1,267
- − Management
- −$1,267
- − Depreciation
- −$5,088
- Taxable loss
- −$4,833
- Est. tax savings @ 24.0%
- +$1,160
- After-tax cash flow
- $-586/yr
For passive investors: Depreciation is non-cash, so a rental often shows a tax loss while cash-flowing — sheltering income. Rental losses are passive: they offset passive income freely, and up to $25,000/yr can offset ordinary (W-2) income if you actively participate and your MAGI is under $100k (phasing out to $0 by $150k); unused losses carry forward. On sale, claimed depreciation is recaptured at up to 25%, and gains may owe capital-gains tax (a 1031 exchange can defer both). Figures are a year-1 estimate at your 24.0% rate — not tax advice; consult a CPA.
Schools (NCES district)
- District
- Lincoln Park School District
- NCES district ID
- 2621600
- Math proficiency
- 15% ▼ -5.00%
- Reading proficiency
- 32% ▬ 0.00%
- Median HH income
- $41,486
- Composite
- 19.93/100
- National rank
- #8678
- State rank
- #440 of 540 in MI
Livability — Lincoln Park
- Score
- 80/100
- State rank
- #82
- US rank
- #1720
Category grades
Schools grade is shown separately in the Schools card above.
Census & demographics
- Census place
- Lincoln Park, MI
- County
- Wayne County · 1,562,939 people
- City population
- 39,257
- Metro
- Detroit-Warren-Dearborn, MI
- Population (ZIP)
- 39,257
- Household income
- $58,616
- Rent vs Own
- Severe rent burden
- 1142.0
Population outlook (Wayne County) Hauer SSP2
- Today (2025)
- 1,675,273 people
- By 2030
- 1,620,300 · -3.3%
- By 2040
- 1,502,341 · -10.3%
- By 2050
- 1,384,039 · -17.4%
- By 2075
- 1,124,592 · -32.9%
- By 2100
- 881,193 · -47.4%
Race, ethnicity, and origin ACS 2023
- Neighborhood character
- Diverse neighborhood (Simpson 0.57)
- Race & ethnicity
- White 60% Hispanic / Latino 25% Two or more races 12% Black 9% Native American 1%
- Hispanic origin (detail)
- Mexican 19% Puerto Rican 3%
- Common ancestry
- Romanian 6% Lithuanian 4% Slovak 1%
- Foreign-born
- 9% · Canada
- Languages at home
- 80% English-only · Spanish 17% Arabic 2%
Political lean MEDSL · Wayne
- 2024 margin
- Strong D (+29.0) · D 62.7% · R 33.7% · Other 3.6%
- 2008→2024 swing
- -20.5pp toward R · 2008: 49.5pp · 2024: 29.0pp
- All cycles
- 2024: D+29.0 2020: D+38.1 2016: D+37.3 2012: D+46.9 2008: D+49.5
Not yet ingested
- Civics
- —
Market trends
- HPI YoY
- ▼ -108.25%
- Current HPI
- 222.8545
- Rent YoY
- ▲ 4.65%
- Metro
- Detroit-Warren-Dearborn, MI
- State GDP YoY
- ▲ 1.37%
- F500 in state
- 28
Industry mix (Fortune 500 HQ in MI)
| Industry | F500 HQs | Revenue |
|---|---|---|
| Automotive Parts | 3 | $48B |
|
||
| Automotive | 2 | $372B |
|
||
| Chemicals | 1 | $45B |
|
||
| Automotive Retail | 1 | $29B |
|
||
| Healthcare / Medical Devices | 1 | $23B |
|
||
| Automotive Technology | 1 | $20B |
|
||
Price history
+513.7% since first listed10 events — show timeline
- 2026-06-18 Listed $174,900 REALCOMP
- 2026-06-18 Listed $174,900 MiRealSource-MiMLS
- 2013-11-14 Listing Removed — MiRealSource-MiMLS
- 2013-11-14 Listing Removed — REALCOMP
- 2013-10-02 Listed $59,900 MiRealSource-MiMLS
- 2013-10-02 Listed $59,900 REALCOMP
- 2013-05-01 Sold (MLS) $29,500 REALCOMP
- 2013-05-01 Sold (MLS) $29,500 MiRealSource-MiMLS
- 2013-04-08 Listed $28,500 REALCOMP
- 2013-04-08 Listed $28,500 MiRealSource-MiMLS
Property tax history
+2.2%/yrLatest (2025): $2,378 · +1.3% YoY. Source: county tax records.
Cash-flow waterfall
monthlySold comps — $/sqft
last 12 mo · ≤1 miLoading sold comps…