 Multi-family
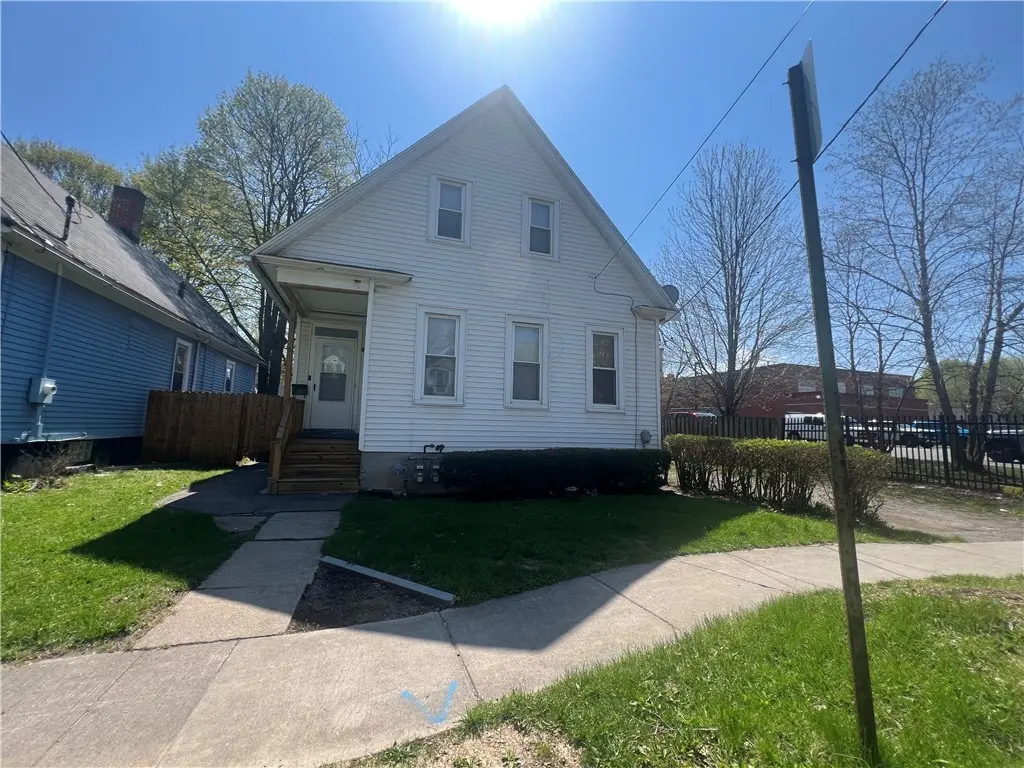
5 Saint Jacob St · Rochester, NY
Flood risk 3/10 · Minor
- FEMA flood zone
- X (unshaded)
- Chance of flooding over 30 yrs
- 0.12%
- Est. flood insurance / yr
- $473 – $860
Fire risk 1/10 · Minimal
- Est. fire insurance / yr
- $691 – $1,283
Heat risk 2/10 · Minimal
- Hot days now (above 95°F)
- 7 days/yr
- Hot days in 30 yrs
- 15 days/yr
Wind risk 1/10 · Minimal
- Chance of severe wind over 30 yrs
- —
Air-quality risk 2/10 · Minimal
- Unhealthy air days now
- 1 days/yr
- Unhealthy air days in 30 yrs
- 2 days/yr
Risk factors via First Street. Map © Google.
Why this score? — see what drove the B grade
The composite is a weighted blend of 9 inputs, each scored 0–100. Each bar is that input's sub-score; the figure is the points it added to the 100-point composite (weight × sub-score).
- Cash flow +30.0/30.0
- ARV discount +10.6/15.0
- 1% rule +10.0/10.0
- DSCR +10.0/10.0
- Rent growth +4.7/5.0
- Livability +3.8/5.0
- Condition / age +2.5/5.0
- Schools +1.9/10.0
- Appreciation +0.0/10.0
$129,900
🖨 Deal sheet 📄 Offer letter ✓ Due diligence
Multi-family units
County records classify this as Multi-Family (2-4 Unit). Listing-text estimate: 1 unit. estimate disagrees with records
Listing remarks
Spacious Multi-Family Opportunity on the West Side! Don’t miss this versatile 2-unit property has space, updates, and income potential! The front unit lives like a single-family home, featuring 5 bedrooms with a convenient first-floor bedroom—perfect for flexible living arrangements. Generous living space throughout makes this ideal for large households or tenants seeking room to spread out. The property has been well-maintained with key updates already completed, including vinyl windows, vinyl siding, and a roof just 5 years old. Mechanical updates add peace of mind with a hot water tank only 2 years old. In the rear, you’ll find a private studio unit with its own entr
Key facts
- First-floor bedroom
- 2-unit property
- Private studio unit
Tags
Property features AI
Finance
- Financial info: Property is a 2-unit multi-family with separate meters and month-to-month tenancy for one unit; Operating expenses include maintenance and trash; Owner pays water and trash; rent includes water and trash; One unit's rent listed at $550
Exterior
- Parking: Carport
- Utilities: Public water connected; Sewer connected
- Home design: Two-story building; Residential multi-use zoning; Existing structure
- Construction: Vinyl siding; Asphalt roof; Block foundation; Built (existing)
- Exterior features: Partial fencing; Fence; Near public transit; Rectangular residential lot; City street frontage
Interior
- Kitchen: Gas water heater
- Bedrooms: One unit with 5 bedrooms
- Flooring: Hardwood; Laminate; Varies
- Bathrooms: Two full bathrooms total; Each unit has one full bathroom
- Heating & cooling: Gas forced-air heating
- Interior features: Central vacuum; Storm windows with wood frames
- Laundry & utility: Separate gas and electric meters for units (two of each)
Neighborhood map
What this means for you Summary
Snapshot
- This is a 5-bed/2.5-bath multifamily listed at $130k.
Deal economics
- At list price, monthly cash flow is $2k ($23k/yr) — positive.
- The deal already cash-flows at list — no discount required.
- Meets the 1% rule at list price ($3k rent vs $130k).
- Recommended offer: $126k (3.0% below list) — sets the bar for market timing.
- Cap rate 24.1% vs local median 9.3% in Rochester — top-decile yield for the area; either an underpriced asset or a hidden risk that comps aren't pricing in. Stress-test before assuming the spread holds.
Location & tenants
- Location reads 76/100 on livability (#222 in NY, #3,482 nationally) — a middle-class / working-renter tenant base. Strengths: commute A+, cost of living A+, housing A+; Watch: schools D+, crime F, employment F.
- Rochester City School District (urban): math 21% / reading 26% proficiency, ranked #589 of 590 in NY (top 100%) — low school quality limits family demand, transient renter base, plan for 1-2y turnover; 82% free/reduced lunch — lower-income household profile, screen leases tightly.
- Market conditions: Rents rising fast (+8.9%/yr); 114 active listings in the ZIP; 3 comparable units currently listed for rent nearby; rentals leasing fast (median 10d on market — plan ~1-2 weeks tenant-placement turnaround); lower-income renter base — watch delinquency; 1,169 units permitted in Monroe County in 2024 (591 in 5+ unit buildings).
- At $3,482/mo this rent would consume 118% of the median local household income ($35k/yr) (locally 2756% of renters already pay >50% of income on rent) — very limited rent-growth headroom before tenants either downsize or default.
Forward outlook
- Local home prices are declining (-3.0%/yr); year-one equity from $898 of loan paydown is wiped out by about $4k of value loss. Plan a longer hold.
- Monroe County population projected to shrink 6% by 2050 — rents likely to lag national; underwrite the cash flow, not the appreciation.
- At projected returns (-3.0% appreciation + 8.0% rent growth), your $36k cash investment doubles in ~2 years — after that, you're playing with house money.
Negotiation context
- It's been on market 49 days — a 3% lower offer ($126k) is reasonable based on typical stale-listing flexibility.
Risks & watch-outs
- Watch-outs: built in 1910 — expect roof / HVAC / electrical / plumbing capex.
Questions for the listing agent
- It's been on market 49 days. Have you received any prior offers? Is the seller open to a 3% concession, seller financing, or rate buy-down credit?
- Built in 1910 — when were the roof, HVAC, electrical panel, plumbing, and water heater last replaced?
- Is there a deadline driving the sale (1031 exchange, divorce, estate, relocation)? That informs how much negotiation room exists.
- Schools are D-rated, which usually means shorter tenancies and higher turnover. Who's the typical renter profile here, and what's been the actual vacancy rate?
- Crime grade is F in this area — have there been break-ins, vandalism, or insurance claims at this property in the last 3 years? What carrier currently insures it and at what premium?
- What's the average days-on-market for RENTAL listings here right now (not sales)? A rising rental-DOM trend means longer vacancies and softer asking-rent achievability than the comps imply.
- What's the recent tenant-quality profile in this submarket — average credit score on applications, eviction rate, late-payment / NSF rate, and stable-employment percentage? A property-management company in the area should have these aggregated.
- How much new apartment / multifamily construction is in the pipeline within 1–3 miles? Heavy new supply (>2% of stock underway) typically softens rents 12–24 months out; light construction supports rent growth.
Investment metrics
- 1% rule
- 2.68% ✓
- Cap rate
- 24.07%
- Cash-on-cash
- 63.50%
- DSCR
- 3.83
- GRM
- 3.1
CMA / ARV
- ARV (median comp)
- $139,516
- List price
- $129,900
- Delta
- -6.89%
- Verdict
- FAIR
- Comps
- 20 within 1.0 mi
Show comp detail 12 sales within ~0.75 mi
| Address | Dist | Beds/Ba | Sqft | Sold | Price | $/sf | Match |
|---|---|---|---|---|---|---|---|
| 72 Bernard St | 0.30mi | 4/2.0 (-1) | 2,022 (-0%) | 1mo | $182,500 | $90 | 77 |
| 115 Ernst St | 0.34mi | 4/2.0 (-1) | 2,016 (-1%) | 4mo | $59,900 | $30 | 72 |
| 373 Weaver St St | 0.43mi | 6/2.0 (+1) | 2,065 (+2%) | 5mo | $79,999 | $39 | 66 |
| 130-132 Weyl | 0.49mi | 4/2.0 (-1) | 2,016 (-1%) | 14mo | $118,000 | $59 | 57 |
| 621 Joseph Ave | 0.52mi | 6/2.0 (+1) | 2,119 (+4%) | 8mo | $115,000 | $54 | 55 |
| 292-294 Carter St | 0.44mi | 6/2.0 (+1) | 2,240 (+10%) | 2mo | $80,000 | $36 | 54 |
| 130 Weyl St | 0.50mi | 4/2.0 (-1) | 2,016 (-1%) | 19mo | $85,000 | $42 | 53 |
| 15-17 Wilkins St | 0.61mi | 4/2.0 (-1) | 1,920 (-6%) | 6mo | $101,070 | $53 | 50 |
| 546 Bernard St | 0.37mi | 4/2.5 (-1) | 1,876 (-8%) | 20mo | $140,000 | $75 | 48 |
| 812 Norton St | 0.65mi | 5/2.0 | 1,777 (-12%) | 10mo | $124,500 | $70 | 38 |
| 40 Peckham St | 0.57mi | 5/2.0 | 1,794 (-12%) | 16mo | $45,000 | $25 | 38 |
| 660 Norton St | 0.73mi | 4/2.0 (-1) | 2,210 (+9%) | 20mo | $70,000 | $32 | 28 |
Match score weights: distance 35% · size 25% · config 20% · recency 20%. Top-matched comps best support the ARV.
Projected returns pro-forma
-3.0% appreciation · 8.0% rent growth · sell at horizon
- IRR
- 68.0%
- Equity multiple
- 4.30×
- Total profit
- $119,940
- Equity at exit
- $19,369
- IRR
- 73.7%
- Equity multiple
- 10.51×
- Total profit
- $346,070
- Equity at exit
- $11,231
Cash invested: $36,372 (down + closing). Projections, not guarantees.
Landlord ↔ Tenant lean methodology
- Overall (STATE)
- 15 Strongly Tenant-Friendly
- State New York
- 15 Strongly Tenant-Friendly · D+10
- County
- — inherits STATE
- City
- — inherits STATE
ZIP-level market 14621
- Home prices YoY
- -4.0%
- Rents YoY
- 8.9%
- Active inventory
- 114
- Price-to-rent
- 5.4×
Monthly cashflow live
- Estimated rent
- $3,482 medium interval (Pro) →
- Mortgage (P&I)
- −$681
- Tax from tax record
- −$91 /mo · $1,090/yr
- Insurance
- −$54
- HOA
- −$0
- Vacancy / Maint / Mgmt
- −$731
- Net cashflow
- $1,925
Break-even live
2-unit breakdown (identical units grouped — click to expand)
| Units | Beds | Baths | Est. rent |
|---|---|---|---|
| 1× unit | 5 | 2 | $2,014 |
| 1× unit | 0 | 1 | $1,468 |
| Total (2 units) | $3,482 | ||
UW: 25.0% down · 7.5% · 30yr · 1.5% tax · 5.0% vac · 8.0% maint · 8.0% mgmt
Financing live
Cash to close
- Down payment
- $32,475
- Closing costs
- $3,897
- Reserves months
- —
- Total cash needed
- —
Loan-product check · same deal, 3 products live
Conventional
25% down · 7.5% · 30yr
- Down + closing
- —
- Monthly P&I
- —
- Monthly cashflow
- —
- DSCR
- —
- Eligible?
- —
Personal DTI + credit; lowest rate.
DSCR
20% down · 8.5% · 30yr
- Down + closing
- —
- Monthly P&I
- —
- Monthly cashflow
- —
- DSCR
- —
- Eligible?
- —
No personal income docs; deal must DSCR.
Hard money
10% down · 12.0% · 12mo
- Down + closing
- —
- Monthly P&I
- —
- Monthly cashflow
- —
- DSCR
- —
- Eligible?
- —
Short-term bridge; refi at stabilization.
Rent comps 3 comps
| Address | Beds | Baths | Sqft | Rent | $/sqft | DOM | Units | Dist |
|---|---|---|---|---|---|---|---|---|
| 207 Lux St Rochester, NY | 4.0 | 1.5 | 1728 | $2,150 | $1.24 | 10d | 1 | 0.69mi |
| 117 Northaven Ter Rochester, NY | 4.0 | 2.0 | 1460 | $1,975 | $1.35 | 10d | 1 | 0.94mi |
| 59 Clark Ave Rochester, NY | 4.0 | 1.0 | 1728 | $1,800 | $1.04 | 2d | 1 | 1.40mi |
Listing history 16 events
-
2026-06-18days on market $129,900 Active 49 DOM
-
2026-06-17days on market $129,900 Active 48 DOM
-
2026-06-16days on market $129,900 Active 47 DOM
-
2026-06-15days on market $129,900 Active 46 DOM
-
2026-06-13days on market $129,900 Active 44 DOM
-
2026-06-13pricedays on market $129,900 Active 43 DOM
-
2026-06-10days on market $134,900 Active 41 DOM
-
2026-06-09days on market $134,900 Active 40 DOM
-
2026-06-09days on market $134,900 Active 39 DOM
-
2026-06-07days on market $134,900 Active 38 DOM
-
2026-06-05days on market $134,900 Active 35 DOM
-
2026-06-03days on market $134,900 Active 34 DOM
-
2026-06-03days on market $134,900 Active 33 DOM
-
2026-06-01days on market $134,900 Active 32 DOM
-
2026-05-31days on market $134,900 Active 31 DOM
-
2026-04-30$139,900 Active 1333-char remark
ⓘ Source: listings_history table (triggers on properties + properties_extension) + one-shot
backfill from property_details.listing_events for pre-trigger history.
Tax reassessment forecast NY · Partial reset (capped growth)
- Current annual tax
- $1,090 · $91/mo
- Projected year-2 tax
- $1,643 · $137/mo
- Expected delta
- +$553/yr (+$46/mo · 50.7%)
ⓘ Screening estimate from a state-policy table — verify with the county assessor before closing.
Climate risk First Street
- Flood 3/10 Moderate FEMA zone X (unshaded) · 12% chance over 30 yrs
- Wildfire 1/10 Low
- Heat 2/10 Low 7 d/yr ≥95°F today · 15 d/yr by 30 yrs out
- Wind 1/10 Low
- Air quality 2/10 Low 1 unhealthy d/yr today · 2 by 30 yrs out
Nearby sold comps map
Loading sold comps map…
Walkable amenities ~0.75 mi
Loading nearby amenities…
Taxation est. · year 1
- Rental income
- $41,784
- − Mortgage interest
- −$7,276
- − Property taxes
- −$1,090
- − Insurance
- −$650
- − Repairs & maintenance
- −$3,343
- − Management
- −$3,343
- − Depreciation
- −$3,779
- Taxable income
- $22,304
- Est. tax owed @ 24.0%
- −$5,353
- After-tax cash flow
- $17,742/yr
For passive investors: Depreciation is non-cash, so a rental often shows a tax loss while cash-flowing — sheltering income. Rental losses are passive: they offset passive income freely, and up to $25,000/yr can offset ordinary (W-2) income if you actively participate and your MAGI is under $100k (phasing out to $0 by $150k); unused losses carry forward. On sale, claimed depreciation is recaptured at up to 25%, and gains may owe capital-gains tax (a 1031 exchange can defer both). Figures are a year-1 estimate at your 24.0% rate — not tax advice; consult a CPA.
Schools (NCES district)
- District
- Rochester City School District
- NCES district ID
- 3624750
- Math proficiency
- 21% ▬ 0.00%
- Reading proficiency
- 26% ▲ 4.00%
- Median HH income
- $30,923
- Composite
- 18.98/100
- National rank
- #8850
- State rank
- #589 of 590 in NY
Livability — Rochester
- Score
- 76/100
- State rank
- #222
- US rank
- #3482
Category grades
Schools grade is shown separately in the Schools card above.
Census & demographics
- Census place
- Rochester, NY
- County
- Monroe County · 674,131 people
- City population
- 432,803
- Metro
- Rochester, NY
- Population (ZIP)
- 32,381
- Household income
- $35,383
- Rent vs Own
- Severe rent burden
- 2756.0
Population outlook (Monroe County) Hauer SSP2
- Today (2025)
- 759,460 people
- By 2030
- 757,154 · -0.3%
- By 2040
- 740,644 · -2.5%
- By 2050
- 714,443 · -5.9%
- By 2075
- 645,883 · -15.0%
- By 2100
- 547,084 · -28.0%
Race, ethnicity, and origin ACS 2023
- Neighborhood character
- Diverse neighborhood (Simpson 0.66)
- Race & ethnicity
- Hispanic / Latino 40% Black 40% White 14% Two or more races 12% Asian 1%
- Hispanic origin (detail)
- Mexican 1% Puerto Rican 32% Dominican 3%
- Common ancestry
- Romanian 1% Lithuanian 1% Serbian 1%
- Foreign-born
- 8% · Canada, Jamaica
- Languages at home
- 65% English-only · Spanish 30% Other Asian/Pacific 2% French/Haitian/Cajun 1%
Political lean MEDSL · Monroe
- 2024 margin
- D (+19.1) · D 59.5% · R 40.5%
- 2008→2024 swing
- +1.4pp toward D · 2008: 17.7pp · 2024: 19.1pp
- All cycles
- 2024: D+19.1 2020: D+21.0 2016: D+14.1 2012: D+17.4 2008: D+17.7
Not yet ingested
- Civics
- —
Market trends
- HPI YoY
- ▼ -10.66%
- Current HPI
- 254.1805
- Rent YoY
- ▲ 8.88%
- Metro
- Rochester, NY
- State GDP YoY
- ▲ 2.60%
- F500 in state
- 92
Industry mix (Fortune 500 HQ in NY)
| Industry | F500 HQs | Revenue |
|---|---|---|
| Financial Services | 10 | $950B |
|
||
| Consumer Goods | 9 | $162B |
|
||
| Insurance | 4 | $225B |
|
||
| Telecommunications | 2 | $144B |
|
||
| Pharmaceuticals | 2 | $112B |
|
||
| Media / Entertainment | 2 | $69B |
|
||
Price history
-7.1% since first listed3 events — show timeline
- 2026-06-10 Price Changed $129,900 UNYREIS
- 2026-05-30 Price Changed $134,900 UNYREIS
- 2026-04-30 Listed $139,900 UNYREIS
Property tax history
+3.5%/yrLatest (2025): $1,090 · +0.7% YoY. Source: county tax records.
Cash-flow waterfall
monthlySold comps — $/sqft
last 12 mo · ≤1 miLoading sold comps…