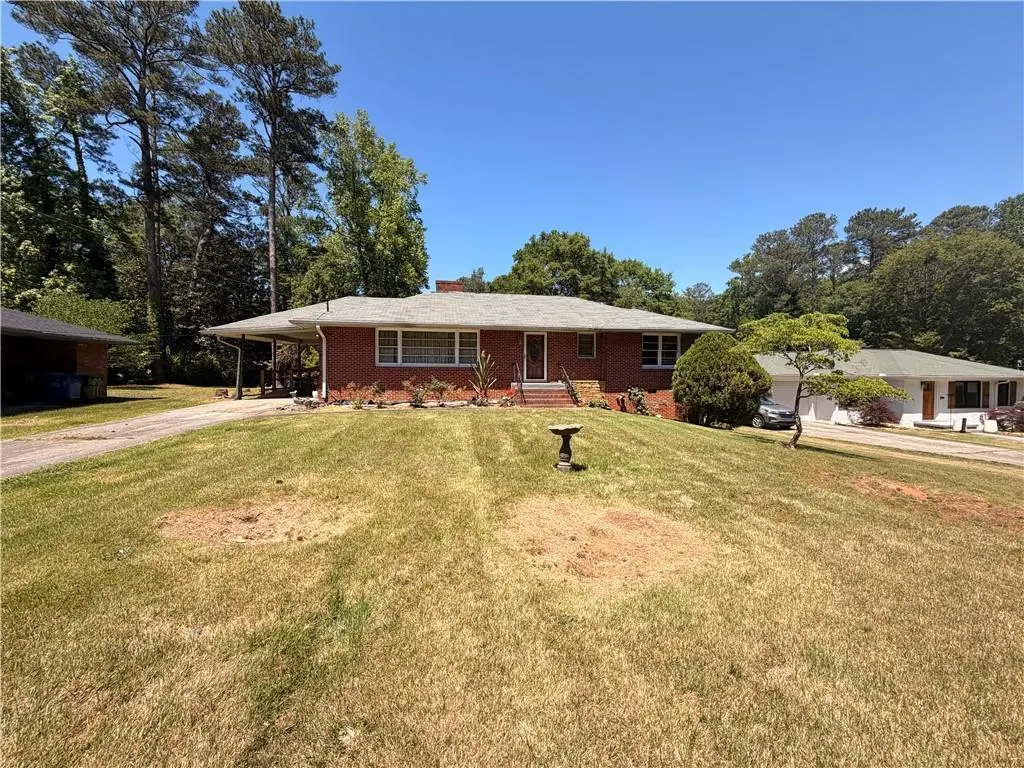
3209 W Manor Cir SW · Atlanta, GA
Flood risk 1/10 · Minimal
- FEMA flood zone
- X (unshaded)
- Chance of flooding over 30 yrs
- 0.0%
- Est. flood insurance / yr
- $473 – $860
Fire risk 2/10 · Minimal
- Est. fire insurance / yr
- $963 – $1,789
Heat risk 6/10 · Moderate
- Hot days now (above 103°F)
- 7 days/yr
- Hot days in 30 yrs
- 18 days/yr
Wind risk 6/10 · Moderate
- Chance of severe wind over 30 yrs
- 27.0%
Air-quality risk 3/10 · Minor
- Unhealthy air days now
- 3 days/yr
- Unhealthy air days in 30 yrs
- 3 days/yr
Risk factors via First Street. Map © Google.
Why this score? — see what drove the B- grade
The composite is a weighted blend of 9 inputs, each scored 0–100. Each bar is that input's sub-score; the figure is the points it added to the 100-point composite (weight × sub-score).
- Cash flow +24.8/30.0
- ARV discount +15.0/15.0
- DSCR +8.0/10.0
- 1% rule +6.4/10.0
- Livability +4.2/5.0
- Schools +2.7/10.0
- Rent growth +2.5/5.0
- Condition / age +2.5/5.0
- Appreciation +0.0/10.0
$174,900
🖨 Deal sheet (PDF) 📄 Offer letter ✓ Due diligence
Listing remarks MLS
Excellent opportunity for a high end renovation. Great build quality with four sided brick. 1,389 sqft above ground with a partial basement. Large and flat front and back yards, great curb appeal. Investors only, cash only.
Key facts
- 0.44 acre lot
- Parking
- Built 1956
Property features AI
Finance
- HOA & community: Curbs; Near Beltline; Near public transport; Near schools; Near shopping; Near trails/greenway; Street lights
Exterior
- Parking: Covered carport (1 space); Driveway with level access; Open parking available
- Utilities: Public water; Public sewer; 110-volt electric; Cable available; Electricity available; Natural gas available; Phone available; Water available; Sewer available
- Home design: One level; Brick 4 sides construction; Composition roof; Block foundation; Resale property
- Construction: Brick 4 sides construction; Composition roof; Block foundation
- Exterior features: Awning(s); Garden; Private entrance; Private yard / backyard; Rain gutters; Back yard fencing; Patio
Interior
- Kitchen: Eat-in country kitchen with stained cabinets and pantry; Electric range; Refrigerator
- Bedrooms: Two main-level bedrooms; Oversized master bedroom; Master on main; Roommate floor plan
- Flooring: Carpet; Vinyl
- Bathrooms: One full bathroom; Master bathroom with tub/shower combo; Main-level bathroom
- Heating & cooling: Central heating (forced air); Central air; Ceiling fans
- Interior features: Wood frame windows; No common walls; Other interior features; Crawl space with interior entry (partial)
- Laundry & utility: Laundry on main level
Neighborhood map
What this means for you Summary
Snapshot
- This is a 2-bed/1.5-bath single-family listed at $175k.
Deal economics
- At list price, monthly cash flow is $368 ($4k/yr) — positive.
- The deal already cash-flows at list — no discount required.
- Meets the 1% rule at list price ($2k rent vs $175k).
- Recommended offer: $172k (1.5% below list) — sets the bar for market timing.
- Cap rate 8.8% vs local median 3.1% in Atlanta — top-decile yield for the area; either an underpriced asset or a hidden risk that comps aren't pricing in. Stress-test before assuming the spread holds.
Location & tenants
- Location reads 83/100 on livability (#6 in GA, #919 nationally) — a professional / high-income tenant draw. Strengths: amenities A+, commute A+, housing A+; Watch: cost of living C-.
- Atlanta Public Schools (urban): math 28% / reading 35% proficiency, ranked #80 of 174 in GA (top 46%) — families likely to look elsewhere, expect single-tenant / working-renter base with shorter leases; 71% free/reduced lunch — lower-income household profile, screen leases tightly.
- Zoned schools: West Manor Elementary School (math 24% / reading 24%, grade F, #753 of 1,228 statewide, top 64%, 248 students, 100% FRL); Jean Childs Young Middle School (math 2% / reading 12%, grade F, #449 of 470 statewide, top 97%, 747 students, 100% FRL); Benjamin E. Mays High School (math 22% / reading 15%, grade F, #254 of 424 statewide, top 61%, 1,337 students, 100% FRL) — zoned schools average 100% FRL vs 71% district-wide (29 pts higher); higher-poverty schools than district average — tighter screening recommended.
- Zoned-school proficiency averages 17% at this address vs 32% district-wide (-15 pts) — the specific schools serving this property underperform the Atlanta Public Schools average; the district grade overstates school quality for this exact location.
- Market conditions: Rents soft (-0.2%/yr); 250 active listings in the ZIP; 34 comparable units currently listed for rent nearby; rentals at typical pace (median 26d on market — plan ~3-4 weeks tenant-placement turnaround); 11,565 units permitted in Fulton County in 2024 (8,159 in 5+ unit buildings).
- At $1,996/mo this rent would consume 47% of the median local household income ($51k/yr) (locally 2825% of renters already pay >50% of income on rent) — very limited rent-growth headroom before tenants either downsize or default.
Forward outlook
- Local home prices are declining (-3.0%/yr); year-one equity from $1k of loan paydown is wiped out by about $5k of value loss. Plan a longer hold.
- Fulton County population projected at +38% by 2050 — long-run rental-demand tailwind backs the buy-and-hold thesis.
Negotiation context
- It's been on market 16 days — a 2% lower offer ($172k) is reasonable based on typical stale-listing flexibility.
- 2 sale attempts; this cycle's ask has dropped $14k (7%) from the opening price — seller is motivated, your offer sets the floor, not the list.
Risks & watch-outs
- Watch-outs: built in 1956 — expect roof / HVAC / electrical / plumbing capex.
- Climate carrying-cost: major wind risk, 27% chance of damaging wind over 30y; extreme-heat days projected 7→18/yr by 2055 (HVAC capex compounding) — expect insurance premiums to compound above CPI over the hold.
Questions for the listing agent
- Built in 1956 — when were the roof, HVAC, electrical panel, plumbing, and water heater last replaced?
- Is there a deadline driving the sale (1031 exchange, divorce, estate, relocation)? That informs how much negotiation room exists.
- What's the average days-on-market for RENTAL listings here right now (not sales)? A rising rental-DOM trend means longer vacancies and softer asking-rent achievability than the comps imply.
- What's the recent tenant-quality profile in this submarket — average credit score on applications, eviction rate, late-payment / NSF rate, and stable-employment percentage? A property-management company in the area should have these aggregated.
- How much new for-sale + rental construction is in the pipeline within 1–3 miles? Heavy new supply typically softens prices + rents 12–24 months out; constrained supply supports both.
Investment metrics
- 1% rule
- 1.14% ✓
- Cap rate
- 8.82%
- Cash-on-cash
- 9.02%
- DSCR
- 1.40
- GRM
- 7.3
CMA / ARV
- ARV (median comp)
- $317,545
- List price
- $174,900
- Delta
- -44.92%
- Verdict
- UNDERPRICED
- Comps
- 20 within 1.0 mi
Show comp detail 9 sales within ~0.75 mi
| Address | Dist | Beds/Ba | Sqft | Sold | Price | $/sf | Match |
|---|---|---|---|---|---|---|---|
| 3209 W Manor Cir SW | 0.00mi | 2/1.0 | 1,389 (0%) | 0mo | $160,000 | $115 | 98 |
| 3219 W Manor Ln | 0.02mi | 3/2.0 (+1) | 1,592 (+15%) | 9mo | $349,000 | $219 | 60 |
| 3265 Spreading Oak Dr SW | 0.45mi | 3/2.0 (+1) | 1,288 (-7%) | 4mo | $200,000 | $155 | 57 |
| 3330 SW Pamlico Dr | 0.39mi | 3/2.0 (+1) | 1,502 (+8%) | 6mo | $280,000 | $186 | 56 |
| 758 Braemar Ave SW | 0.22mi | 3/2.0 (+1) | 1,278 (-8%) | 18mo | $145,000 | $113 | 55 |
| 3050 Rebecca Dr SW | 0.55mi | 3/2.0 (+1) | 1,416 (+2%) | 12mo | $255,000 | $180 | 55 |
| 448 Thackery SW | 0.69mi | 3/2.0 (+1) | 1,320 (-5%) | 6mo | $250,000 | $189 | 47 |
| 970 Tuckawanna Dr | 0.67mi | 3/1.0 (+1) | 1,471 (+6%) | 16mo | $250,000 | $170 | 38 |
| 3457 Spreading Oak Dr SW | 0.67mi | 3/2.0 (+1) | 1,564 (+13%) | 7mo | $205,000 | $131 | 35 |
Match score weights: distance 35% · size 25% · config 20% · recency 20%. Top-matched comps best support the ARV.
Projected returns pro-forma
-3.0% appreciation · 0.0% rent growth · sell at horizon
- IRR
- -6.1%
- Equity multiple
- 0.78×
- Total profit
- $-10,718
- Equity at exit
- $26,078
- IRR
- -0.6%
- Equity multiple
- 0.97×
- Total profit
- $-1,630
- Equity at exit
- $15,122
Cash invested: $48,972 (down + closing). Projections, not guarantees.
Landlord ↔ Tenant lean methodology
- Overall (STATE)
- 90 Strongly Landlord-Friendly
- State Georgia
- 90 Strongly Landlord-Friendly · R+3
- County
- — inherits STATE
- City
- — inherits STATE
ZIP-level market 30311
- Home prices YoY
- -33.3%
- Rents YoY
- -0.2%
- Active inventory
- 250
- Price-to-rent
- 7.3×
Monthly cashflow live
- Estimated rent
- $1,996 high interval (Pro) →
- Mortgage (P&I)
- −$917
- Tax est. 1.5%
- −$219 /mo · $2,624/yr
- Insurance
- −$73
- HOA
- −$0
- Vacancy / Maint / Mgmt
- −$419
- Net cashflow
- $368
Break-even live
Sensitivity live
| Price | -10% $489 | -5% $429 | +0% $368 | +5% $308 | +10% $247 |
|---|---|---|---|---|---|
| Rent | -10% $210 | -5% $289 | +0% $368 | +5% $447 | +10% $526 |
| Rate | -1.0pp $456 | -0.5pp $413 | base $368 | +0.5pp $323 | +1.0pp $277 |
UW: 25.0% down · 7.5% · 30yr · 1.5% tax · 5.0% vac · 8.0% maint · 8.0% mgmt
Financing live
Cash to close
- Down payment
- $43,725
- Closing costs
- $5,247
- Reserves months
- —
- Total cash needed
- —
Loan-product check · same deal, 3 products live
Conventional
25% down · 7.5% · 30yr
- Down + closing
- —
- Monthly P&I
- —
- Monthly cashflow
- —
- DSCR
- —
- Eligible?
- —
Personal DTI + credit; lowest rate.
DSCR
20% down · 8.5% · 30yr
- Down + closing
- —
- Monthly P&I
- —
- Monthly cashflow
- —
- DSCR
- —
- Eligible?
- —
No personal income docs; deal must DSCR.
Hard money
10% down · 12.0% · 12mo
- Down + closing
- —
- Monthly P&I
- —
- Monthly cashflow
- —
- DSCR
- —
- Eligible?
- —
Short-term bridge; refi at stabilization.
Rent comps 34 comps
| Address | Beds | Baths | Sqft | Rent | $/sqft | DOM | Units | Dist |
|---|---|---|---|---|---|---|---|---|
| 3311 Rabun Dr SW Atlanta, GA | 3.0 | 2.0 | 1523 | $2,350 | $1.54 | 25d | 1 | 0.30mi |
| 3039 Lynn Dr SW Atlanta, GA | 3.0 | 2.0 | 1756 | $2,300 | $1.31 | 25d | 1 | 0.30mi |
| 871 Laurelmont Dr SW Atlanta, GA | 3.0 | 2.0 | 1210 | $2,000 | $1.65 | 25d | 1 | 0.37mi |
| 1026 Lynhurst Dr SW Atlanta, GA | 3.0 | 2.0 | 1728 | $2,500 | $1.45 | 14d | 1 | 0.65mi |
| 1026 Lynhurst Dr SW Atlanta, GA | 3.0 | 2.0 | 1728 | $2,500 | $1.45 | 0d | 1 | 0.65mi |
| 513 Constellation Overlook SW Atlanta, GA | 3.0 | 2.5 | 1446 | $2,300 | $1.59 | 25d | 1 | 0.71mi |
| 3230 Cushman Cir SW Atlanta, GA | 2.0 | 1.0 | 1143 | $1,200 | $1.05 | 9d | 1 | 0.79mi |
| 658 Providence Pl SW Atlanta, GA | 3.0 | 3.5 | 1571 | $2,100 | $1.34 | 25d | 1 | 0.81mi |
| 648 Providence Pl SW #37 Atlanta, GA | 3.0 | 3.5 | 1416 | $2,195 | $1.55 | 25d | 1 | 0.82mi |
| 648 Providence Pl SW #37 Atlanta, GA | 3.0 | 3.5 | 1416 | $2,195 | $1.55 | 0d | 1 | 0.82mi |
| 294 Brownlee Rd SW Atlanta, GA | 2.0 | 1.5 | 950 | $1,050 | $1.11 | 18d | 2 | 0.83mi |
| 708 Crestwell Cir SW Atlanta, GA | 2.0 | 2.5 | 1236 | $1,645 | $1.33 | 25d | 1 | 0.84mi |
| 897 Ambient Way SW Atlanta, GA | 2.0 | 2.5 | 1500 | $2,155 | $1.44 | 25d | 1 | 0.86mi |
| 722 Crestwell Cir #722 Atlanta, GA | 2.0 | 3.0 | 1440 | $2,279 | $1.58 | 22d | 1 | 0.87mi |
| 3616 Utoy Dr SW Atlanta, GA | 3.0 | 3.5 | 1496 | $1,950 | $1.30 | 45d | 1 | 0.87mi |
| 887 Ambient Way SW Atlanta, GA | 2.0 | 2.5 | 1344 | $2,250 | $1.67 | 25d | 1 | 0.88mi |
| 460 Peyton Rd SW Unit B Atlanta, GA | 2.0 | 2.0 | 1500 | $2,000 | $1.33 | 25d | 1 | 0.88mi |
| 778 Nehemiah Ln SW Atlanta, GA | 2.0 | 2.5 | 1576 | $1,950 | $1.24 | 25d | 1 | 0.89mi |
| 755 Crestwell Cir SW Atlanta, GA | 2.0 | 2.5 | 1546 | $1,800 | $1.16 | 25d | 1 | 0.91mi |
| 832 Ambient Way SW Atlanta, GA | 2.0 | 2.5 | 1500 | $2,250 | $1.50 | 25d | 1 | 0.91mi |
| 841 Ambient Way SW Atlanta, GA | 2.0 | 2.5 | 1344 | $1,895 | $1.41 | 0d | 1 | 0.93mi |
| 841 Ambient Way SW Atlanta, GA | 2.0 | 2.5 | 1344 | $1,895 | $1.41 | 18d | 1 | 0.93mi |
| 3691 Manor Ct SW Atlanta, GA | 2.0 | 2.0 | 944 | $1,500 | $1.59 | 25d | 1 | 1.14mi |
| 3606 Ginnis Dr SW #8 Atlanta, GA | 2.0 | 2.5 | 1224 | $1,411 | $1.15 | 9d | 1 | 1.20mi |
| 415 Fairburn Rd SW Atlanta, GA | 1.0–3.0 | 1.0–2.0 | 890 | $1,258 | $1.41 | 0d | 31 | 1.25mi |
| 3188 Delmar Ln NW Atlanta, GA | 3.0 | 2.0 | 1124 | $2,400 | $2.14 | 25d | 1 | 1.29mi |
| 139 Peyton Pl SW Atlanta, GA | 2.0 | 2.0 | 1008 | $1,150 | $1.14 | 6d | 1 | 1.31mi |
| 139 Peyton Pl SW Atlanta, GA | 2.0 | 1.5 | 1008 | $1,150 | $1.14 | 25d | 1 | 1.31mi |
| 751 Fairburn Rd SW Atlanta, GA | 1.0–3.0 | 1.0–2.0 | 1162 | $1,770 | $1.52 | 0d | 31 | 1.35mi |
| 3354 Delmar Ln NW Atlanta, GA | 3.0 | 2.0 | 1170 | $1,700 | $1.45 | 25d | 1 | 1.37mi |
| 1212 Utoy Springs Rd SW #38 Atlanta, GA | 2.0 | 1.0 | 875 | $1,400 | $1.60 | 18d | 1 | 1.38mi |
| 100 Peyton Pl SW Atlanta, GA | 1.0–3.0 | 1.0–2.0 | 1040 | $1,574 | $1.51 | 0d | 25 | 1.45mi |
| 95 Howell Dr SW Atlanta, GA | 3.0 | 2.5 | 1840 | $1,840 | $1.00 | 15d | 1 | 1.46mi |
| 87 Howell Dr SW Atlanta, GA | 3.0 | 2.5 | 1840 | $2,700 | $1.47 | 25d | 1 | 1.46mi |
Listing history 6 events
-
2026-05-14price $174,900 223-char remark
Show marketing remark (223 chars)
Excellent opportunity for a high end renovation. Great build quality with four sided brick. 1,389 sqft above ground with a partial basement. Large and flat front and back yards, great curb appeal. Investors only, cash only.
-
2026-05-02$189,000 Active 223-char remark
-
2026-05-01$189,000 New 223-char remark
Show marketing remark (223 chars)
Excellent opportunity for a high end renovation. Great build quality with four sided brick. 1,389 sqft above ground with a partial basement. Large and flat front and back yards, great curb appeal. Investors only, cash only.
-
2026-04-22soldstatus $132,000
-
1988-04-01soldstatus $64,000
ⓘ Source: listings_history table (triggers on properties + properties_extension) + one-shot
backfill from property_details.listing_events for pre-trigger history.
Climate risk First Street
- Flood 1/10 Low FEMA zone X (unshaded) · 0% chance over 30 yrs
- Wildfire 2/10 Low
- Heat 6/10 Major 7 d/yr ≥103°F today · 18 d/yr by 30 yrs out
- Wind 6/10 Major 27% chance of damaging wind over 30 yrs
- Air quality 3/10 Moderate 3 unhealthy d/yr today · 3 by 30 yrs out
Nearby sold comps map
Loading sold comps map…
Walkable amenities ~0.75 mi
Loading nearby amenities…
Taxation est. · year 1
- Rental income
- $23,951
- − Mortgage interest
- −$9,797
- − Property taxes
- −$2,624
- − Insurance
- −$874
- − Repairs & maintenance
- −$1,916
- − Management
- −$1,916
- − Depreciation
- −$5,088
- Taxable income
- $1,736
- Est. tax owed @ 24.0%
- −$417
- After-tax cash flow
- $4,000/yr
For passive investors: Depreciation is non-cash, so a rental often shows a tax loss while cash-flowing — sheltering income. Rental losses are passive: they offset passive income freely, and up to $25,000/yr can offset ordinary (W-2) income if you actively participate and your MAGI is under $100k (phasing out to $0 by $150k); unused losses carry forward. On sale, claimed depreciation is recaptured at up to 25%, and gains may owe capital-gains tax (a 1031 exchange can defer both). Figures are a year-1 estimate at your 24.0% rate — not tax advice; consult a CPA.
Schools (NCES district)
- District
- Atlanta Public Schools
- NCES district ID
- 1300120
- Math proficiency
- 28% ▼ -6.00%
- Reading proficiency
- 35% ▼ -2.00%
- Median HH income
- $48,306
- Composite
- 27.27/100
- National rank
- #7006
- State rank
- #80 of 174 in GA
Livability — Atlanta
- Score
- 83/100
- State rank
- #6
- US rank
- #919
Category grades
Schools grade is shown separately in the Schools card above.
Census & demographics
- Census place
- Atlanta, GA
- County
- Fulton County · 1,094,430 people
- City population
- 629,525
- Metro
- Atlanta-Sandy Springs-Alpharetta, GA
- Population (ZIP)
- 34,953
- Household income
- $50,649
- Rent vs Own
- Severe rent burden
- 2825.0
Population outlook (Fulton County) Hauer SSP2
- Today (2025)
- 1,203,707 people
- By 2030
- 1,299,706 · +8.0%
- By 2040
- 1,488,256 · +23.6%
- By 2050
- 1,664,580 · +38.3%
- By 2075
- 2,036,072 · +69.2%
- By 2100
- 2,222,402 · +84.6%
Race, ethnicity, and origin ACS 2023
- Neighborhood character
- Predominantly Black (89%)
- Race & ethnicity
- Black 89% Hispanic / Latino 4% Two or more races 4% White 3%
- Common ancestry
- Hispanic 1%
- Foreign-born
- 5% · Canada
- Languages at home
- 93% English-only · Spanish 3% French/Haitian/Cajun 1% Korean 1%
Political lean MEDSL · Fulton
- 2024 margin
- Solid D (+44.9) · D 71.9% · R 27.0% · Other 1.1%
- 2008→2024 swing
- +9.8pp toward D · 2008: 35.0pp · 2024: 44.9pp
- All cycles
- 2024: D+44.9 2020: D+46.4 2016: D+42.1 2012: D+29.6 2008: D+35.0
Not yet ingested
- Civics
- —
Market trends
- HPI YoY
- ▼ -129.99%
- Current HPI
- 259.954
- Rent YoY
- ▼ -0.19%
- Metro
- Atlanta-Sandy Springs-Alpharetta, GA
- State GDP YoY
- ▲ 2.66%
- F500 in state
- 28
Industry mix (Fortune 500 HQ in GA)
| Industry | F500 HQs | Revenue |
|---|---|---|
| Paper / Packaging | 2 | $29B |
|
||
| Retail | 1 | $160B |
|
||
| Transportation / Logistics | 1 | $91B |
|
||
| Airlines | 1 | $62B |
|
||
| Consumer Goods | 1 | $47B |
|
||
| Utilities | 1 | $25B |
|
||
Price history
+150.0% since first listed10 events — show timeline
- 2026-06-12 Sold (MLS) $160,000 GAMLS
- 2026-06-12 Sold (MLS) $160,000 FMLS
- 2026-05-19 Pending — GAMLS
- 2026-05-19 Pending — FMLS
- 2026-05-14 Price Changed $174,900 FMLS
- 2026-05-14 Price Changed $174,900 GAMLS
- 2026-05-02 Listed $189,000 FMLS
- 2026-05-01 Listed $189,000 GAMLS
- 2026-04-22 Sold (Public Records) $132,000 Public Records
- 1988-04-01 Sold (Public Records) $64,000 Public Records
Property tax history
+2.8%/yrLatest (2025): $62 · -80.8% YoY. Source: county tax records.
Cash-flow waterfall
monthlySold comps — $/sqft
last 12 mo · ≤1 miLoading sold comps…