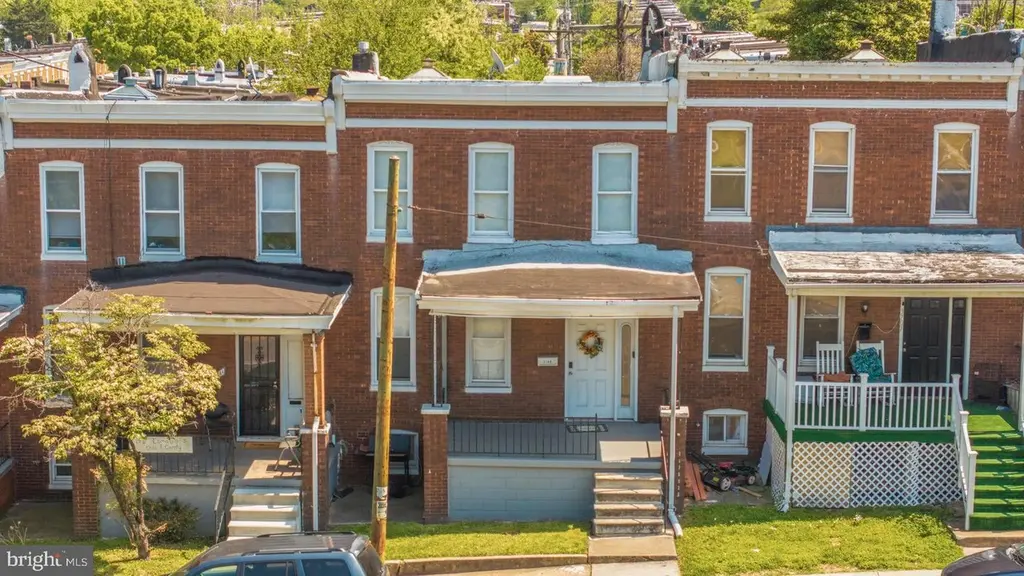
3709 Belair Rd · Baltimore, MD
Flood risk 1/10 · Minimal
- FEMA flood zone
- X (unshaded)
- Chance of flooding over 30 yrs
- 0.0%
- Est. flood insurance / yr
- $473 – $860
Fire risk 1/10 · Minimal
- Est. fire insurance / yr
- $755 – $1,403
Heat risk 8/10 · Major
- Hot days now (above 103°F)
- 7 days/yr
- Hot days in 30 yrs
- 15 days/yr
Wind risk 6/10 · Moderate
- Chance of severe wind over 30 yrs
- 27.0%
Air-quality risk 4/10 · Minor
- Unhealthy air days now
- 6 days/yr
- Unhealthy air days in 30 yrs
- 7 days/yr
Risk factors via First Street. Map © Google.
Why this score? — see what drove the B+ grade
The composite is a weighted blend of 9 inputs, each scored 0–100. Each bar is that input's sub-score; the figure is the points it added to the 100-point composite (weight × sub-score).
- Cash flow +30.0/30.0
- ARV discount +11.1/15.0
- 1% rule +10.0/10.0
- DSCR +10.0/10.0
- Appreciation +4.7/10.0
- Rent growth +3.8/5.0
- Livability +3.8/5.0
- Condition / age +2.5/5.0
- Schools +1.0/10.0
$125,000
🖨 Deal sheet 📄 Offer letter ✓ Due diligence
Listing remarks MLS
Dont miss this one. Sold as is where is and all inspections are for buyers informational purposes only. Wells Fargo Pre-approval and proof of funds req with all offers. If a ground rent exist seller will not redeem
Key facts
- Built 1928
- Listed 50 days
Property features AI
Exterior
- Parking: On-street parking
- Utilities: Public water; Public sewer; Hot water: Other
- Home design: Interior townhouse/rowhouse; Fee simple ownership
- Construction: Brick construction; Block foundation; Above-grade and below-grade structures; Built year per assessor
- Exterior features: Located within city limits (Baltimore City); No tidal water nearby
Interior
- Kitchen: Eat-in kitchen
- Bedrooms: Four bedrooms on the first upper level
- Bathrooms: One full bathroom
- Heating & cooling: Radiator heating; Other cooling
- Interior features: Dining area; Eat-in kitchen; Full basement with connecting stairway
Neighborhood map
What this means for you Summary
Snapshot
- This is a 4-bed/1.0-bath townhouse listed at $125k.
Deal economics
- At list price, monthly cash flow is $724 ($9k/yr) — positive.
- The deal already cash-flows at list — no discount required.
- Meets the 1% rule at list price ($2k rent vs $125k).
- Recommended offer: $121k (3.0% below list) — sets the bar for market timing.
- Cap rate 13.2% vs local median 6.0% in Baltimore — top-decile yield for the area; either an underpriced asset or a hidden risk that comps aren't pricing in. Stress-test before assuming the spread holds.
Location & tenants
- Location reads 76/100 on livability (#90 in MD, #3,396 nationally) — a middle-class / working-renter tenant base. Strengths: amenities A+, commute A+, housing A+; Watch: schools D, crime F.
- Baltimore City Public Schools (urban): math 7% / reading 16% proficiency, ranked #24 of 24 in MD (top 100%) — low school quality limits family demand, transient renter base, plan for 1-2y turnover; 79% free/reduced lunch — lower-income household profile, screen leases tightly.
- Market conditions: Rents rising fast (+5.2%/yr); 319 active listings in the ZIP; 40 comparable units currently listed for rent nearby; rentals at typical pace (median 24d on market — plan ~3-4 weeks tenant-placement turnaround); 40% of comp listings sitting > 30 days — soft ceiling on asking rent; 1,273 units permitted in Baltimore city in 2024 (1,104 in 5+ unit buildings).
- At $2,015/mo this rent would consume 47% of the median local household income ($51k/yr) (locally 1868% of renters already pay >50% of income on rent) — very limited rent-growth headroom before tenants either downsize or default.
Forward outlook
- In year one you build about $154 of equity ($864 loan paydown + $-710 appreciation (-0.6% local appreciation)).
- Baltimore County population projected to shrink 4% by 2050 — rents likely to lag national; underwrite the cash flow, not the appreciation.
- At projected returns (-0.6% appreciation + 5.2% rent growth), your $35k cash investment doubles in ~4 years — after that, you're playing with house money.
Negotiation context
- It's been on market 50 days — a 3% lower offer ($121k) is reasonable based on typical stale-listing flexibility.
- 5 sale attempts since 26y ago; this cycle's ask has dropped $50k (29%) from the opening price — seller is motivated, your offer sets the floor, not the list.
- Current owner paid $30k; list at $125k implies a 317% gain — meaningful room to come down on a strong offer.
Risks & watch-outs
- Watch-outs: built in 1928 — expect roof / HVAC / electrical / plumbing capex.
- Climate carrying-cost: major wind risk, 27% chance of damaging wind over 30y; extreme-heat days projected 7→15/yr by 2055 (HVAC capex compounding) — expect insurance premiums to compound above CPI over the hold.
Questions for the listing agent
- It's been on market 50 days. Have you received any prior offers? Is the seller open to a 3% concession, seller financing, or rate buy-down credit?
- Built in 1928 — when were the roof, HVAC, electrical panel, plumbing, and water heater last replaced?
- Is there a deadline driving the sale (1031 exchange, divorce, estate, relocation)? That informs how much negotiation room exists.
- Schools are D-rated, which usually means shorter tenancies and higher turnover. Who's the typical renter profile here, and what's been the actual vacancy rate?
- Crime grade is F in this area — have there been break-ins, vandalism, or insurance claims at this property in the last 3 years? What carrier currently insures it and at what premium?
- What's the average days-on-market for RENTAL listings here right now (not sales)? A rising rental-DOM trend means longer vacancies and softer asking-rent achievability than the comps imply.
- What's the recent tenant-quality profile in this submarket — average credit score on applications, eviction rate, late-payment / NSF rate, and stable-employment percentage? A property-management company in the area should have these aggregated.
- How much new for-sale + rental construction is in the pipeline within 1–3 miles? Heavy new supply typically softens prices + rents 12–24 months out; constrained supply supports both.
Investment metrics
- 1% rule
- 1.61% ✓
- Cap rate
- 13.24%
- Cash-on-cash
- 24.82%
- DSCR
- 2.10
- GRM
- 5.2
CMA / ARV
- ARV (median comp)
- $135,972
- List price
- $125,000
- Delta
- -8.07%
- Verdict
- FAIR
- Comps
- 20 within 1.0 mi
Show comp detail 12 sales within ~0.75 mi
| Address | Dist | Beds/Ba | Sqft | Sold | Price | $/sf | Match |
|---|---|---|---|---|---|---|---|
| 2846 Lake Ave | 0.22mi | 4/2.5 | 1,455 (+5%) | 2mo | $235,000 | $162 | 74 |
| 3406 Ramona Ave | 0.34mi | 3/2.0 (-1) | 1,408 (+2%) | 0mo | $85,000 | $60 | 72 |
| 3114 Mareco Ave | 0.39mi | 3/2.0 (-1) | 1,410 (+2%) | 2mo | $125,000 | $89 | 68 |
| 2902 Clifton Park Ter | 0.41mi | 3/1.5 (-1) | 1,344 (-3%) | 1mo | $66,000 | $49 | 68 |
| 3571 Dudley Ave | 0.50mi | 3/2.0 (-1) | 1,400 (+1%) | 1mo | $175,000 | $125 | 65 |
| 3533 Elmley Ave | 0.55mi | 3/1.5 (-1) | 1,344 (-3%) | 1mo | $70,000 | $52 | 61 |
| 4235 Seidel Ave | 0.48mi | 3/1.5 (-1) | 1,280 (-8%) | 2mo | $91,000 | $71 | 57 |
| 3733 Ravenwood Ave | 0.69mi | 3/2.0 (-1) | 1,350 (-3%) | 1mo | $135,000 | $100 | 54 |
| 3564 Elmora Ave | 0.62mi | 3/1.5 (-1) | 1,478 (+7%) | 1mo | $133,500 | $90 | 52 |
| 4215 Seidel Ave | 0.47mi | 3/2.0 (-1) | 1,528 (+10%) | 2mo | $186,500 | $122 | 50 |
| 3532 Cliftmont Ave | 0.43mi | 3/2.0 (-1) | 1,200 (-13%) | 2mo | $168,000 | $140 | 47 |
| 3555 Elmora Ave | 0.65mi | 4/2.0 | 1,178 (-15%) | 1mo | $254,000 | $216 | 40 |
Match score weights: distance 35% · size 25% · config 20% · recency 20%. Top-matched comps best support the ARV.
Projected returns pro-forma
-0.57% appreciation · 5.25% rent growth · sell at horizon
- IRR
- 25.9%
- Equity multiple
- 2.25×
- Total profit
- $43,855
- Equity at exit
- $32,786
- IRR
- 31.9%
- Equity multiple
- 4.73×
- Total profit
- $130,506
- Equity at exit
- $36,708
Cash invested: $35,000 (down + closing). Projections, not guarantees.
Landlord ↔ Tenant lean methodology
- Overall (CITY)
- 12 Strongly Tenant-Friendly
- State Maryland
- 27 Tenant-Leaning · D+14
- County
- — inherits STATE
- City Baltimore
- 12 Strongly Tenant-Friendly · D+58
ZIP-level market 21213
- Home prices YoY
- -0.1%
- Rents YoY
- 5.2%
- Active inventory
- 319
- Price-to-rent
- 5.2×
Monthly cashflow live
- Estimated rent
- $2,015 high interval (Pro) →
- Mortgage (P&I)
- −$656
- Tax from tax record
- −$160 /mo · $1,921/yr
- Insurance
- −$52
- HOA
- −$0
- Vacancy / Maint / Mgmt
- −$423
- Net cashflow
- $724
Break-even live
UW: 25.0% down · 7.5% · 30yr · 1.5% tax · 5.0% vac · 8.0% maint · 8.0% mgmt
Financing live
Cash to close
- Down payment
- $31,250
- Closing costs
- $3,750
- Reserves months
- —
- Total cash needed
- —
Loan-product check · same deal, 3 products live
Conventional
25% down · 7.5% · 30yr
- Down + closing
- —
- Monthly P&I
- —
- Monthly cashflow
- —
- DSCR
- —
- Eligible?
- —
Personal DTI + credit; lowest rate.
DSCR
20% down · 8.5% · 30yr
- Down + closing
- —
- Monthly P&I
- —
- Monthly cashflow
- —
- DSCR
- —
- Eligible?
- —
No personal income docs; deal must DSCR.
Hard money
10% down · 12.0% · 12mo
- Down + closing
- —
- Monthly P&I
- —
- Monthly cashflow
- —
- DSCR
- —
- Eligible?
- —
Short-term bridge; refi at stabilization.
Rent comps 40 comps
| Address | Beds | Baths | Sqft | Rent | $/sqft | DOM | Units | Dist |
|---|---|---|---|---|---|---|---|---|
| 2848 Pelham Ave Baltimore, MD | 3.0 | 2.0 | 1164 | $1,700 | $1.46 | 43d | 1 | 0.11mi |
| 2837 Pelham Ave Baltimore, MD | 4.0 | 2.0 | 1164 | $1,675 | $1.44 | 43d | 1 | 0.14mi |
| 2817 Pelham Ave Baltimore, MD | 3.0 | 2.0 | 1464 | $1,950 | $1.33 | 23d | 1 | 0.16mi |
| 2735 Chesterfield Ave Baltimore, MD | 3.0 | 2.5 | 1536 | $2,000 | $1.30 | 10d | 1 | 0.22mi |
| 3305 Dudley Ave Baltimore, MD | 3.0 | 2.0 | 1413 | $1,950 | $1.38 | 43d | 1 | 0.25mi |
| 2828 Lake Ave Baltimore, MD | 3.0 | 2.0 | 1164 | $1,850 | $1.59 | 4d | 1 | 0.25mi |
| 3300 Dudley Ave Baltimore, MD | 4.0 | 2.0 | 1724 | $2,200 | $1.28 | 43d | 1 | 0.25mi |
| 3515 Parklawn Ave Baltimore, MD | 3.0 | 2.0 | 1240 | $1,700 | $1.37 | 2d | 1 | 0.26mi |
| 4320 Sheldon Ave Baltimore, MD | 3.0 | 1.5 | 1280 | $1,800 | $1.41 | 23d | 1 | 0.38mi |
| 4024 Eierman Ave Baltimore, MD | 3.0 | 2.0 | 1136 | $1,825 | $1.61 | 43d | 1 | 0.39mi |
| 3203 Clarence Ave Baltimore, MD | 5.0 | 1.0 | 1388 | $1,865 | $1.34 | 43d | 1 | 0.41mi |
| 4400 Asbury Ave Baltimore, MD | 3.0 | 2.0 | 1270 | $1,995 | $1.57 | 4d | 1 | 0.42mi |
| 3544 Chesterfield Ave Baltimore, MD | 3.0 | 1.5 | 1200 | $1,635 | $1.36 | 43d | 1 | 0.45mi |
| 3519 Kentucky Ave Baltimore, MD | 3.0 | 2.0 | 1536 | $2,100 | $1.37 | 10d | 1 | 0.46mi |
| 3525 Kentucky Ave Baltimore, MD | 3.0 | 1.5 | 1536 | $1,950 | $1.27 | 43d | 1 | 0.46mi |
| 3551 Shannon Dr Baltimore, MD | 3.0 | 2.0 | 1485 | $2,358 | $1.59 | 23d | 1 | 0.48mi |
| 3573 Shannon Dr Baltimore, MD | 4.0 | 2.0 | 1493 | $2,300 | $1.54 | 17d | 1 | 0.51mi |
| 3551 Elmley Ave Baltimore, MD | 3.0 | 1.5 | 1872 | $2,095 | $1.12 | 23d | 1 | 0.56mi |
| 3512 Elmora Ave Baltimore, MD | 3.0 | 1.5 | 1472 | $1,900 | $1.29 | 20d | 1 | 0.64mi |
| 3603 Ravenwood Ave Unit 1 Baltimore, MD | 4.0 | 1.0 | 1566 | $1,600 | $1.02 | 43d | 1 | 0.69mi |
| 3914 Erdman Ave #1 Baltimore, MD | 3.0 | 1.0 | 1200 | $1,319 | $1.10 | 17d | 1 | 0.72mi |
| 3317 Lyndale Ave Baltimore, MD | 3.0 | 1.0 | 900 | $1,300 | $1.44 | 43d | 1 | 0.72mi |
| 3326 Elmora Ave Baltimore, MD | 3.0 | 1.0 | 1200 | $1,450 | $1.21 | 23d | 1 | 0.73mi |
| 3339 Elmora Ave Baltimore, MD | 3.0 | 2.0 | 896 | $1,600 | $1.79 | 43d | 1 | 0.74mi |
| 3222 Lyndale Ave Unit 1 Baltimore, MD | 3.0 | 1.5 | 1500 | $2,200 | $1.47 | 12d | 1 | 0.74mi |
| 3218 Lyndale Ave Baltimore, MD | 3.0 | 1.5 | 1020 | $1,500 | $1.47 | 23d | 1 | 0.75mi |
| 3322 Ravenwood Ave Baltimore, MD | 3.0 | 2.0 | 932 | $1,800 | $1.93 | 23d | 1 | 0.77mi |
| 2113 Belair Rd Baltimore, MD | 3.0 | 1.0 | 1344 | $1,795 | $1.34 | 43d | 1 | 0.83mi |
| 4116 Raymonn Ave Baltimore, MD | 3.0 | 1.5 | 1244 | $1,950 | $1.57 | 43d | 1 | 0.83mi |
| 4718 Blue Ridge Ave Baltimore, MD | 4.0 | 3.0 | 1744 | $2,400 | $1.38 | 11d | 1 | 0.89mi |
| 4901 Gunther Ave Baltimore, MD | 1.0–3.0 | 1.0–2.0 | 742 | $1,463 | $1.97 | 2d | 1 | 1.00mi |
| 4300 Orchard Ridge Blvd Baltimore, MD | 1.0–3.0 | 1.0–2.0 | 1021 | $1,809 | $1.77 | 43d | 1 | 1.00mi |
| 4104 Parkwood Ave Baltimore, MD | 3.0 | 1.0 | 1224 | $2,800 | $2.29 | 23d | 1 | 1.06mi |
| 5305 Moravia Rd Baltimore, MD | 3.0 | 1.0 | 679 | $1,993 | $2.93 | 2d | 1 | 1.08mi |
| 1832 E 28th St Baltimore, MD | 3.0 | 1.0 | 1066 | $1,495 | $1.40 | 23d | 1 | 1.11mi |
| 4023 Belwood Ave Baltimore, MD | 3.0 | 1.0 | 1080 | $1,995 | $1.85 | 43d | 1 | 1.13mi |
| 1802 E 28th St Baltimore, MD | 3.0 | 1.0 | 1300 | $1,600 | $1.23 | 23d | 1 | 1.15mi |
| 5731 Denwood Ave Baltimore, MD | 3.0 | 1.5 | 1440 | $1,700 | $1.18 | 23d | 1 | 1.23mi |
| 5731 Denwood Ave Baltimore, MD | 3.0 | 1.5 | 1152 | $1,700 | $1.48 | 21d | 1 | 1.23mi |
| 1702 E 32nd St Baltimore, MD | 3.0 | 2.0 | 1344 | $2,300 | $1.71 | 43d | 1 | 1.23mi |
Listing history 32 events
-
2026-06-18days on market $125,000 Active 50 DOM
-
2026-06-17days on market $125,000 Active 49 DOM
-
2026-06-16days on market $125,000 Active 48 DOM
-
2026-06-15days on market $125,000 Active 47 DOM
-
2026-06-13pricedays on market $125,000 Active 45 DOM
-
2026-06-09days on market $139,900 Active 41 DOM
-
2026-06-08days on market $139,900 Active 40 DOM
-
2026-06-07days on market $139,900 Active 39 DOM
-
2026-06-04days on market $139,900 Active 36 DOM
-
2026-06-03days on market $139,900 Active 35 DOM
-
2026-06-02days on market $139,900 Active 34 DOM
-
2026-06-02price $139,900 Active 33 DOM
-
2026-06-01days on market $150,000 Active 33 DOM
-
2026-05-31days on market $150,000 Active 32 DOM
-
2026-05-15price $150,000 442-char remark
-
2026-05-07price $155,000 442-char remark
-
2026-04-29$174,900 Active 442-char remark
-
2010-11-12historical 214-char remark
Show marketing remark (214 chars)
Dont miss this one. Sold as is where is and all inspections are for buyers informational purposes only. Wells Fargo Pre-approval and proof of funds req with all offers. If a ground rent exist seller will not redeem
-
2010-10-30soldstatus $30,000 Sold 214-char remark
Show marketing remark (214 chars)
Dont miss this one. Sold as is where is and all inspections are for buyers informational purposes only. Wells Fargo Pre-approval and proof of funds req with all offers. If a ground rent exist seller will not redeem
-
2010-10-30soldstatus $30,000
Show marketing remark (214 chars)
Dont miss this one. Sold as is where is and all inspections are for buyers informational purposes only. Wells Fargo Pre-approval and proof of funds req with all offers. If a ground rent exist seller will not redeem
-
2010-09-17status Contract 214-char remark
Show marketing remark (214 chars)
Dont miss this one. Sold as is where is and all inspections are for buyers informational purposes only. Wells Fargo Pre-approval and proof of funds req with all offers. If a ground rent exist seller will not redeem
-
2010-09-16historical
Show marketing remark (214 chars)
Dont miss this one. Sold as is where is and all inspections are for buyers informational purposes only. Wells Fargo Pre-approval and proof of funds req with all offers. If a ground rent exist seller will not redeem
-
2010-07-16$33,900 Active 214-char remark
Show marketing remark (214 chars)
Dont miss this one. Sold as is where is and all inspections are for buyers informational purposes only. Wells Fargo Pre-approval and proof of funds req with all offers. If a ground rent exist seller will not redeem
-
2010-07-16$33,900
Show marketing remark (214 chars)
Dont miss this one. Sold as is where is and all inspections are for buyers informational purposes only. Wells Fargo Pre-approval and proof of funds req with all offers. If a ground rent exist seller will not redeem
-
2006-08-29soldstatus $155,000
-
2004-01-13soldstatus $35,000
-
2003-12-22soldstatus $29,000
-
2003-11-17historical
-
2003-11-06$29,900
-
2001-01-30soldstatus $60,400
-
2000-11-30historical
-
2000-06-29
ⓘ Source: listings_history table (triggers on properties + properties_extension) + one-shot
backfill from property_details.listing_events for pre-trigger history.
Tax reassessment forecast MD · Partial reset (capped growth)
- Current annual tax
- $1,921 · $160/mo
- Projected year-2 tax
- $1,921 · $160/mo
- Expected delta
- $0/yr ($0/mo · 0.0%)
ⓘ Screening estimate from a state-policy table — verify with the county assessor before closing.
Climate risk First Street
- Flood 1/10 Low FEMA zone X (unshaded) · 0% chance over 30 yrs
- Wildfire 1/10 Low
- Heat 8/10 Severe 7 d/yr ≥103°F today · 15 d/yr by 30 yrs out
- Wind 6/10 Major 27% chance of damaging wind over 30 yrs
- Air quality 4/10 Moderate 6 unhealthy d/yr today · 7 by 30 yrs out
Nearby sold comps map
Loading sold comps map…
Walkable amenities ~0.75 mi
Loading nearby amenities…
Taxation est. · year 1
- Rental income
- $24,177
- − Mortgage interest
- −$7,002
- − Property taxes
- −$1,921
- − Insurance
- −$625
- − Repairs & maintenance
- −$1,934
- − Management
- −$1,934
- − Depreciation
- −$3,636
- Taxable income
- $7,125
- Est. tax owed @ 24.0%
- −$1,710
- After-tax cash flow
- $6,978/yr
For passive investors: Depreciation is non-cash, so a rental often shows a tax loss while cash-flowing — sheltering income. Rental losses are passive: they offset passive income freely, and up to $25,000/yr can offset ordinary (W-2) income if you actively participate and your MAGI is under $100k (phasing out to $0 by $150k); unused losses carry forward. On sale, claimed depreciation is recaptured at up to 25%, and gains may owe capital-gains tax (a 1031 exchange can defer both). Figures are a year-1 estimate at your 24.0% rate — not tax advice; consult a CPA.
Schools (NCES district)
- District
- Baltimore City Public Schools
- NCES district ID
- 2400090
- Math proficiency
- 7% ▼ -9.00%
- Reading proficiency
- 16% ▼ -5.00%
- Median HH income
- $42,108
- Composite
- 10.08/100
- National rank
- #9805
- State rank
- #24 of 24 in MD
Livability — Baltimore
- Score
- 76/100
- State rank
- #90
- US rank
- #3396
Category grades
Schools grade is shown separately in the Schools card above.
Census & demographics
- Census place
- Baltimore, MD
- County
- Baltimore City · 558,601 people
- City population
- 588,727
- Metro
- Baltimore-Columbia-Towson, MD
- Population (ZIP)
- 28,058
- Household income
- $51,344
- Rent vs Own
- Severe rent burden
- 1868.0
Population outlook (Baltimore County) Hauer SSP2
- Today (2025)
- 624,249 people
- By 2030
- 621,541 · -0.4%
- By 2040
- 609,756 · -2.3%
- By 2050
- 597,249 · -4.3%
- By 2075
- 552,236 · -11.5%
- By 2100
- 513,934 · -17.7%
Race, ethnicity, and origin ACS 2023
- Neighborhood character
- Predominantly Black (86%)
- Race & ethnicity
- Black 86% White 6% Hispanic / Latino 4% Two or more races 3%
- Foreign-born
- 3% · Canada
- Languages at home
- 96% English-only · Spanish 3%
Political lean MEDSL · Baltimore
- 2024 margin
- Solid D (+73.0) · D 85.2% · R 12.2% · Other 2.6%
- 2008→2024 swing
- -2.5pp toward R · 2008: 75.5pp · 2024: 73.0pp
- All cycles
- 2024: D+73.0 2020: D+76.6 2016: D+74.6 2012: D+76.4 2008: D+75.5
Not yet ingested
- Civics
- —
Market trends
- HPI YoY
- ▼ -0.57%
- Current HPI
- 427.4453
- Rent YoY
- ▲ 5.25%
- Metro
- Baltimore-Columbia-Towson, MD
- State GDP YoY
- ▲ 2.97%
- F500 in state
- 12
Industry mix (Fortune 500 HQ in MD)
| Industry | F500 HQs | Revenue |
|---|---|---|
| Aerospace / Defense | 1 | $71B |
|
||
| Utilities | 1 | $25B |
|
||
| Hotels | 1 | $24B |
|
||
| Consumer Goods | 1 | $7B |
|
||
| Real Estate | 1 | $6B |
|
||
| Chemicals | 1 | $2B |
|
||
Price history
+107.0% since first listed20 events — show timeline
- 2026-06-11 Price Changed $125,000 BRIGHT MLS
- 2026-06-01 Price Changed $139,900 BRIGHT MLS
- 2026-05-15 Price Changed $150,000 BRIGHT MLS
- 2026-05-07 Price Changed $155,000 BRIGHT MLS
- 2026-04-29 Listed $174,900 BRIGHT MLS
- 2010-11-12 Delisted — MRIS
- 2010-10-30 Sold (MLS) $30,000 BRIGHT MLS
- 2010-10-30 Sold (MLS) $30,000 MRIS
- 2010-09-17 Pending — MRIS
- 2010-09-16 Listing Removed — BRIGHT MLS
- 2010-07-16 Listed $33,900 MRIS
- 2010-07-16 Listed $33,900 BRIGHT MLS
- 2006-08-29 Sold (Public Records) $155,000 Public Records
- 2004-01-13 Sold (Public Records) $35,000 Public Records
- 2003-12-22 Sold (MLS) $29,000 MRIS
- 2003-11-17 Delisted — MRIS
- 2003-11-06 Listed $29,900 MRIS
- 2001-01-30 Sold (Public Records) $60,400 Public Records
- 2000-11-30 Delisted — MRIS
- 2000-06-29 Listed — MRIS
Property tax history
-1.0%/yrLatest (2025): $1,921 · +3.8% YoY. Source: county tax records.
Cash-flow waterfall
monthlySold comps — $/sqft
last 12 mo · ≤1 miLoading sold comps…