6000 Dryden Rd · Walton, NY
Flood risk 1/10 · Minimal
- FEMA flood zone
- X (unshaded)
- Chance of flooding over 30 yrs
- 0.0%
- Est. flood insurance / yr
- $507 – $1,088
Fire risk 3/10 · Minor
- Est. fire insurance / yr
- $691 – $1,283
Heat risk 1/10 · Minimal
- Hot days now (above 89°F)
- 7 days/yr
- Hot days in 30 yrs
- 15 days/yr
Wind risk 2/10 · Minimal
- Chance of severe wind over 30 yrs
- 1.0%
Air-quality risk 2/10 · Minimal
- Unhealthy air days now
- 0 days/yr
- Unhealthy air days in 30 yrs
- 1 days/yr
Risk factors via First Street. Map © Google.
Why this score? — see what drove the D grade
The composite is a weighted blend of 9 inputs, each scored 0–100. Each bar is that input's sub-score; the figure is the points it added to the 100-point composite (weight × sub-score).
- Cash flow +8.9/30.0
- Appreciation +7.9/10.0
- ARV discount +7.5/15.0
- Schools +3.5/10.0
- Livability +3.5/5.0
- DSCR +2.5/10.0
- Rent growth +2.5/5.0
- Condition / age +2.5/5.0
- 1% rule +2.0/10.0
$399,999
🖨 Deal sheet (PDF) 📄 Offer letter ✓ Due diligence
Listing remarks MLS
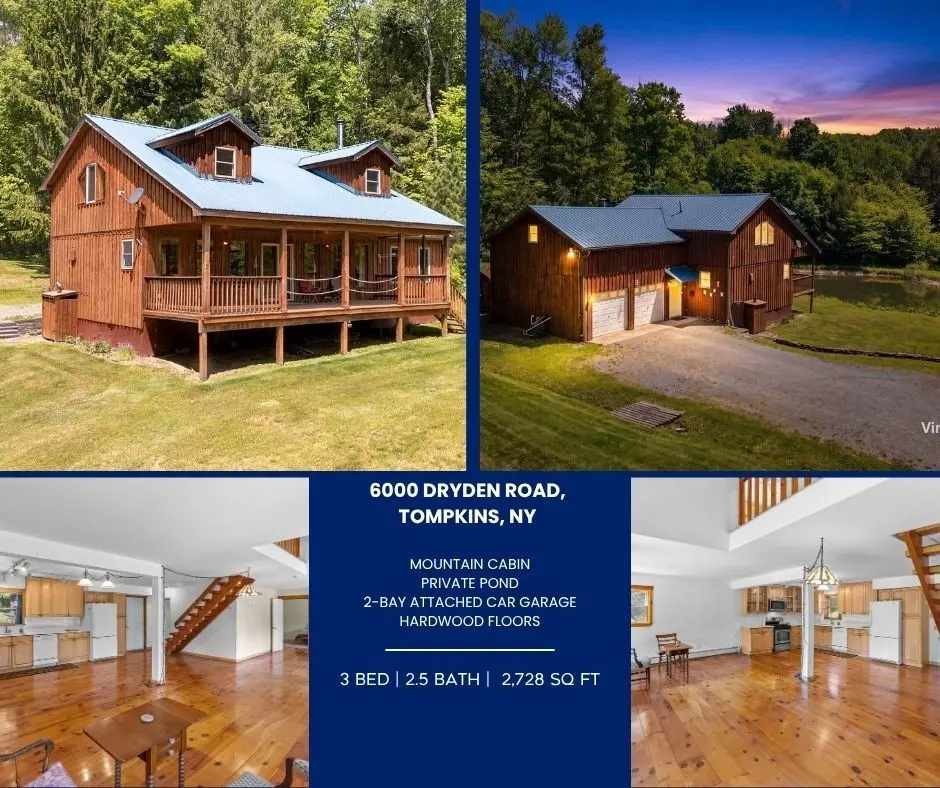
You will love this Super Private 6.14 acre, 3 to 4 bdrm, 2.5 bath home. Enjoy the Stress free privacy of the Large covered porch over looking picturesque pond. Large open rooms, master suite w/ Large bath. Lovely details including ceiling fans in every bedroom, studio w/ sink, large walk-in closets, attached garage w/ workshop area. Come and experience this very special place.
Key facts
- 6 acres
- Pond views
- 2-bay garage
Tags
Property features AI
Exterior
- Parking: Attached garage with automatic opener; Two garage spaces
- Utilities: Electricity connected; Well water; Septic tank
- Home design: Two-story home; Existing construction
- Construction: Wood siding; Metal roof; Pillar/post/pier foundation; Built as existing (year not specified)
- Exterior features: Covered porch; Gravel driveway; Shed(s) and additional storage; Pond on the property; Wooded and agricultural lot; Rectangular lot
Interior
- Kitchen: Dishwasher; Microwave; Refrigerator; Country-style kitchen
- Bedrooms: One main-level bedroom
- Flooring: Carpet; Hardwood; Tile; Varied flooring types
- Bathrooms: Two full bathrooms; One half bathroom; Two main-level bathrooms
- Heating & cooling: Oil heating; Baseboard heat; Stove heating
- Interior features: Ceiling fans; Country-style kitchen; Open living/dining area; Loft; Main level primary bedroom; Crawl space basement
- Laundry & utility: Washer and dryer; Main-level laundry; Oil water heater
Neighborhood map
What this means for you Summary
Snapshot
- This is a 3-bed/2.5-bath single-family listed at $400k.
Deal economics
- At list price, monthly cash flow is $-321 ($-4k/yr) — negative.
- To cash-flow at today's rent, offer at most $343k (14.2% below list).
- To meet the 1% rule (rent ≥ 1% of price), the offer needs to be $279k (30.2% below list).
- Recommended offer: $279k (30.2% below list) — sets the bar for 1% rule.
- Cap rate 5.3% vs local median 7.8% in Walton — below-typical yield; the buyer is paying a premium for something (appreciation thesis, condition, location) that the cap rate doesn't capture.
Location & tenants
- Location reads 70/100 on livability (#443 in NY) — a middle-class / working-renter tenant base. Strengths: cost of living A+, health & safety A+; Watch: amenities F, commute F, employment F.
- Walton Central School District (town): math 36% / reading 47% proficiency, ranked #510 of 590 in NY (top 86%) — families likely to look elsewhere, expect single-tenant / working-renter base with shorter leases.
- Zoned schools: Townsend Elementary School (math 32% / reading 42%, grade F, #1,519 of 2,108 statewide, top 74%, 367 students, 47% FRL); Walton Middle School (math 17% / reading 42%, grade F, #550 of 729 statewide, top 77%, 189 students, 54% FRL); Walton High School (math 84% / reading 90%, grade A, #308 of 1,100 statewide, top 28%, 283 students, 50% FRL) — zoned schools at 51% FRL track the district average.
- Market conditions: 56 active listings in the ZIP; 66 units permitted in Delaware County in 2024 (0 in 5+ unit buildings).
Forward outlook
- In year one you build about $26k of equity ($3k loan paydown + $23k appreciation (5.8% local appreciation)).
- Delaware County population projected at -27% by 2050 — secular population decline; favor cash flow + early exit over multi-decade hold.
- By year 2, paydown + projected appreciation supports a ~$42k cash-out refi (75% LTV) — recoverable capital for the next deal without selling this one.
Negotiation context
- Only 9 days on market — expect competitive offers; lowballing is unlikely to land.
- 4 sale attempts since 12y ago with the ask held roughly flat each time — persistent listings suggest the price (not the market) is what's stuck; bring a comps-based counter.
- Current owner paid $343k; 17% above their basis — modest negotiation headroom, anchor on the comps not their cost.
Questions for the listing agent
- What do current leases actually rent for vs. the listed asking? Can we see a recent rent roll and the last 12 months of T-12 income?
- Is there a deadline driving the sale (1031 exchange, divorce, estate, relocation)? That informs how much negotiation room exists.
- Schools are D-rated, which usually means shorter tenancies and higher turnover. Who's the typical renter profile here, and what's been the actual vacancy rate?
- The area grade is low — what's the realistic commute time and amenity access for the typical tenant pool here? Any planned neighborhood developments (good or bad) we should know about?
- What's the average days-on-market for RENTAL listings here right now (not sales)? A rising rental-DOM trend means longer vacancies and softer asking-rent achievability than the comps imply.
- What's the recent tenant-quality profile in this submarket — average credit score on applications, eviction rate, late-payment / NSF rate, and stable-employment percentage? A property-management company in the area should have these aggregated.
- How much new for-sale + rental construction is in the pipeline within 1–3 miles? Heavy new supply typically softens prices + rents 12–24 months out; constrained supply supports both.
Investment metrics
- 1% rule
- 0.70% ✗
- Cap rate
- 5.33%
- Cash-on-cash
- -3.44%
- DSCR
- 0.85
- GRM
- 11.9
CMA / ARV
No comps found within radius.
Projected returns pro-forma
5.79% appreciation · 3.0% rent growth · sell at horizon
- IRR
- 12.0%
- Equity multiple
- 1.80×
- Total profit
- $90,041
- Equity at exit
- $246,269
- IRR
- 12.9%
- Equity multiple
- 3.52×
- Total profit
- $282,010
- Equity at exit
- $442,186
Cash invested: $112,000 (down + closing). Projections, not guarantees.
Landlord ↔ Tenant lean methodology
- Overall (STATE)
- 15 Strongly Tenant-Friendly
- State New York
- 15 Strongly Tenant-Friendly · D+10
- County
- — inherits STATE
- City
- — inherits STATE
ZIP-level market 13856
- Home prices YoY
- 1.8%
- Active inventory
- 56
- Price-to-rent
- 11.9×
Monthly cashflow live
- Estimated rent
- $2,790 medium interval (Pro) →
- Mortgage (P&I)
- −$2,098
- Tax from tax record
- −$261 /mo · $3,137/yr
- Insurance
- −$167
- HOA
- −$0
- Vacancy / Maint / Mgmt
- −$586
- Net cashflow
- $-321
Break-even live
Sensitivity live
| Price | -10% $-95 | -5% $-208 | +0% $-321 | +5% $-435 | +10% $-548 |
|---|---|---|---|---|---|
| Rent | -10% $-542 | -5% $-432 | +0% $-321 | +5% $-211 | +10% $-101 |
| Rate | -1.0pp $-120 | -0.5pp $-220 | base $-321 | +0.5pp $-425 | +1.0pp $-530 |
UW: 25.0% down · 7.5% · 30yr · 1.5% tax · 5.0% vac · 8.0% maint · 8.0% mgmt
Financing live
Cash to close
- Down payment
- $100,000
- Closing costs
- $12,000
- Reserves months
- —
- Total cash needed
- —
Loan-product check · same deal, 3 products live
Conventional
25% down · 7.5% · 30yr
- Down + closing
- —
- Monthly P&I
- —
- Monthly cashflow
- —
- DSCR
- —
- Eligible?
- —
Personal DTI + credit; lowest rate.
DSCR
20% down · 8.5% · 30yr
- Down + closing
- —
- Monthly P&I
- —
- Monthly cashflow
- —
- DSCR
- —
- Eligible?
- —
No personal income docs; deal must DSCR.
Hard money
10% down · 12.0% · 12mo
- Down + closing
- —
- Monthly P&I
- —
- Monthly cashflow
- —
- DSCR
- —
- Eligible?
- —
Short-term bridge; refi at stabilization.
Listing history 8 events
-
2026-06-21days on market $399,999 Active 9 DOM
-
2026-06-21days on market $399,999 Active 8 DOM
-
2026-06-18days on market $399,999 Active 6 DOM
-
2026-06-17days on market $399,999 Active 5 DOM
-
2026-06-16days on market $399,999 Active 4 DOM
-
2026-06-15days on market $399,999 Active 3 DOM
-
2026-06-12remarks 695-char remark
-
2026-06-12$399,999 Active 1 DOM
ⓘ Source: listings_history table (triggers on properties + properties_extension) + one-shot
backfill from property_details.listing_events for pre-trigger history.
Tax reassessment forecast NY · Partial reset (capped growth)
- Current annual tax
- $3,137 · $261/mo
- Projected year-2 tax
- $4,948 · $412/mo
- Expected delta
- +$1,812/yr (+$151/mo · 57.8%)
ⓘ Screening estimate from a state-policy table — verify with the county assessor before closing.
Climate risk First Street
- Flood 1/10 Low FEMA zone X (unshaded) · 0% chance over 30 yrs
- Wildfire 3/10 Moderate
- Heat 1/10 Low 7 d/yr ≥89°F today · 15 d/yr by 30 yrs out
- Wind 2/10 Low 100% chance of damaging wind over 30 yrs
- Air quality 2/10 Low 0 unhealthy d/yr today · 1 by 30 yrs out
Nearby sold comps map
Loading sold comps map…
Walkable amenities ~0.75 mi
Loading nearby amenities…
Taxation est. · year 1
- Rental income
- $33,484
- − Mortgage interest
- −$22,406
- − Property taxes
- −$3,137
- − Insurance
- −$2,000
- − Repairs & maintenance
- −$2,679
- − Management
- −$2,679
- − Depreciation
- −$11,636
- Taxable loss
- −$11,053
- Est. tax savings @ 24.0%
- +$2,653
- After-tax cash flow
- $-1,204/yr
For passive investors: Depreciation is non-cash, so a rental often shows a tax loss while cash-flowing — sheltering income. Rental losses are passive: they offset passive income freely, and up to $25,000/yr can offset ordinary (W-2) income if you actively participate and your MAGI is under $100k (phasing out to $0 by $150k); unused losses carry forward. On sale, claimed depreciation is recaptured at up to 25%, and gains may owe capital-gains tax (a 1031 exchange can defer both). Figures are a year-1 estimate at your 24.0% rate — not tax advice; consult a CPA.
Schools (NCES district)
- District
- Walton Central School District
- NCES district ID
- 3629820
- Math proficiency
- 36% ▬ 0.00%
- Reading proficiency
- 47% ▲ 3.00%
- Median HH income
- $41,231
- Composite
- 34.86/100
- National rank
- #5088
- State rank
- #510 of 590 in NY
Livability — Walton
- Score
- 70/100
- State rank
- #443
- US rank
- #7789
Category grades
Schools grade is shown separately in the Schools card above.
Census & demographics
- Population (ZIP)
- 5,915
Population outlook (Delaware County) Hauer SSP2
- Today (2025)
- 42,668 people
- By 2030
- 40,337 · -5.5%
- By 2040
- 35,514 · -16.8%
- By 2050
- 31,265 · -26.7%
- By 2075
- 24,455 · -42.7%
- By 2100
- 19,529 · -54.2%
Race, ethnicity, and origin ACS 2023
- Neighborhood character
- Predominantly White (90%)
- Race & ethnicity
- White 90% Black 5% Two or more races 5% Hispanic / Latino 2%
- Common ancestry
- Iranian 7% Slovak 3% Lithuanian 3%
- Foreign-born
- 3% · Canada, Philippines
- Languages at home
- 94% English-only · Spanish 2% Other Indo-European 1% French/Haitian/Cajun 1%
Political lean MEDSL · Delaware
- 2024 margin
- R (+19.8) · D 40.1% · R 59.9%
- 2008→2024 swing
- -14.6pp toward R · 2008: -5.2pp · 2024: -19.8pp
- All cycles
- 2024: R+19.8 2020: R+18.4 2016: R+29.2 2012: R+9.6 2008: R+5.2
Not yet ingested
- Civics
- —
Market trends
- HPI YoY
- ▲ 5.79%
- Current HPI
- 331.9799
- Rent YoY
- —
- Metro
- —
- State GDP YoY
- ▲ 2.60%
- F500 in state
- 92
Industry mix (Fortune 500 HQ in NY)
| Industry | F500 HQs | Revenue |
|---|---|---|
| Financial Services | 10 | $950B |
|
||
| Consumer Goods | 9 | $162B |
|
||
| Insurance | 4 | $225B |
|
||
| Telecommunications | 2 | $144B |
|
||
| Pharmaceuticals | 2 | $112B |
|
||
| Media / Entertainment | 2 | $69B |
|
||
Price history
+60.1% since first listed7 events — show timeline
- 2026-06-12 Listed $399,999 UNYREIS
- 2015-08-25 Sold (Public Records) $343,000 Public Records
- 2015-07-29 Sold (MLS) $243,000 GBAOR
- 2015-07-29 Sold (MLS) $243,000 UNYREIS
- 2014-11-24 Listed $249,900 GBAOR
- 2014-11-24 Listed $249,900 UNYREIS
- 2014-05-18 Listed $249,900 UNYREIS
Property tax history
+5.1%/yrLatest (2025): $3,137 · +1.5% YoY. Source: county tax records.
Cash-flow waterfall
monthlySold comps — $/sqft
last 12 mo · ≤1 miLoading sold comps…