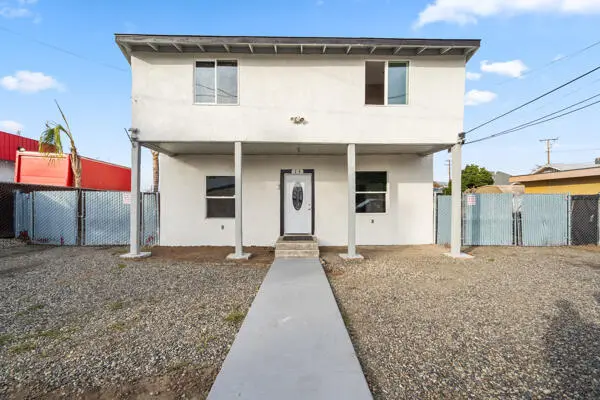
 Fourplex
24 E School Ave #4 · Porterville, CA
Flood risk 1/10 · Minimal
- FEMA flood zone
- X (unshaded)
- Chance of flooding over 30 yrs
- 0.0%
- Est. flood insurance / yr
- $507 – $1,088
Fire risk 8/10 · Major
- Est. fire insurance / yr
- $659 – $1,223
Heat risk 8/10 · Major
- Hot days now (above 105°F)
- 7 days/yr
- Hot days in 30 yrs
- 17 days/yr
Wind risk 1/10 · Minimal
- Chance of severe wind over 30 yrs
- —
Air-quality risk 10/10 · Severe
- Unhealthy air days now
- 38 days/yr
- Unhealthy air days in 30 yrs
- 42 days/yr
Risk factors via First Street. Map © Google.
Why this score? — see what drove the F grade
The composite is a weighted blend of 9 inputs, each scored 0–100. Each bar is that input's sub-score; the figure is the points it added to the 100-point composite (weight × sub-score).
- Cash flow +8.8/30.0
- Condition / age +3.8/5.0
- Rent growth +3.5/5.0
- Livability +3.0/5.0
- Schools +2.8/10.0
- 1% rule +2.7/10.0
- DSCR +2.4/10.0
- ARV discount +0.0/15.0
- Appreciation +0.0/10.0
$559,900
🖨 Deal sheet (PDF) 📄 Offer letter ✓ Due diligence
Multi-family units
County records classify this as Multi-Family (2-4 Unit). Listing-text estimate: 4 units. confirmed
Listing remarks MLS
Looking for adding more units on your portfolio or thinking on staring one? Take a look at these Quadruplex, 3 units with 2 bedrooms 1 bathroom and1 unit with 1 bedroom 1 bathroom featuring new flooring and some more upgrades! Schedule your private showing TODAY!!!
Key facts
- 0.24 acre lot
- Built 1915
- Listed 184 days
Neighborhood map
What this means for you Summary
Snapshot
- This is a 3×2bd/1ba + 1×1bd/1ba units multifamily listed at $560k. Condition is rated good.
Deal economics
- At list price, monthly cash flow is $-464 ($-6k/yr) — negative. Per door: $-116/mo.
- To cash-flow at today's rent, offer at most $493k (12.0% below list).
- To meet the 1% rule (rent ≥ 1% of price), the offer needs to be $431k (23.0% below list).
- Recommended offer: $431k (23.0% below list) — sets the bar for 1% rule.
- Cap rate 5.3% vs local median 2.7% in Porterville — top-decile yield for the area; either an underpriced asset or a hidden risk that comps aren't pricing in. Stress-test before assuming the spread holds.
Location & tenants
- Location reads 60/100 on livability (#561 in CA) — a middle-class / working-renter tenant base. Strengths: housing A, commute A-; Watch: crime C-, cost of living D+, amenities F.
- Porterville Unified (urban): math 18% / reading 50% proficiency, ranked #302 of 517 in CA (top 58%) — families likely to look elsewhere, expect single-tenant / working-renter base with shorter leases; 84% free/reduced lunch — lower-income household profile, screen leases tightly.
- Zoned schools: Roche Elementary (319 students, 92% FRL); Bartlett Middle (430 students, 94% FRL); Granite Hills High (math 19% / reading 48%, grade F, #656 of 1,170 statewide, top 57%, 1,242 students, 92% FRL).
- Market conditions: Rents rising fast (+4.1%/yr); 325 active listings in the ZIP; 1,447 units permitted in Tulare County in 2024 (307 in 5+ unit buildings).
- At $4,310/mo this rent would consume 87% of the median local household income ($60k/yr) (locally 3028% of renters already pay >50% of income on rent) — very limited rent-growth headroom before tenants either downsize or default.
Forward outlook
- Local home prices are declining (-3.0%/yr); year-one equity from $4k of loan paydown is wiped out by about $17k of value loss. Plan a longer hold.
- Tulare County population projected at +10% by 2050 — modest demand growth; plan on rents tracking national, not racing it.
Negotiation context
- It's been on market 184 days — a 12% lower offer ($493k) is reasonable based on typical stale-listing flexibility.
- 2 sale attempts; this cycle's ask is 4% above the opening price — seller raised mid-cycle; expect resistance to lowballs.
Risks & watch-outs
- Watch-outs: built in 1915 — expect roof / HVAC / electrical / plumbing capex.
- Climate carrying-cost: severe wildfire risk; extreme-heat days projected 7→17/yr by 2055 (HVAC capex compounding) — expect insurance premiums to compound above CPI over the hold.
Questions for the listing agent
- What do current leases actually rent for vs. the listed asking? Can we see a recent rent roll and the last 12 months of T-12 income?
- It's been on market 184 days. Have you received any prior offers? Is the seller open to a 23% concession, seller financing, or rate buy-down credit?
- Can we see the unit-by-unit rent roll, current vacancy, and any below-market leases? What's the average tenancy length?
- What capital expenditures (roof, boiler, parking lot, exteriors) have been made in the last 5 years, and what's planned in the next 2?
- Built in 1915 — when were the roof, HVAC, electrical panel, plumbing, and water heater last replaced?
- Why hasn't it sold? Are there any deal-killer items the seller is aware of (foundation, flood, title, zoning, code violations)?
- Is there a deadline driving the sale (1031 exchange, divorce, estate, relocation)? That informs how much negotiation room exists.
- Schools are F-rated, which usually means shorter tenancies and higher turnover. Who's the typical renter profile here, and what's been the actual vacancy rate?
- The area grade is low — what's the realistic commute time and amenity access for the typical tenant pool here? Any planned neighborhood developments (good or bad) we should know about?
- What's the average days-on-market for RENTAL listings here right now (not sales)? A rising rental-DOM trend means longer vacancies and softer asking-rent achievability than the comps imply.
- What's the recent tenant-quality profile in this submarket — average credit score on applications, eviction rate, late-payment / NSF rate, and stable-employment percentage? A property-management company in the area should have these aggregated.
- How much new apartment / multifamily construction is in the pipeline within 1–3 miles? Heavy new supply (>2% of stock underway) typically softens rents 12–24 months out; light construction supports rent growth.
Investment metrics
- 1% rule
- 0.77% ✗
- Cap rate
- 5.30%
- Cash-on-cash
- -3.56%
- DSCR
- 0.84
- GRM
- 10.8
CMA / ARV
- ARV (median comp)
- $379,014
- List price
- $559,900
- Delta
- 47.73%
- Verdict
- OVERPRICED
- Comps
- 5 within 1.0 mi
Projected returns pro-forma
-3.0% appreciation · 4.07% rent growth · sell at horizon
- IRR
- -21.1%
- Equity multiple
- 0.26×
- Total profit
- $-115,554
- Equity at exit
- $83,483
- IRR
- -12.2%
- Equity multiple
- 0.24×
- Total profit
- $-118,781
- Equity at exit
- $48,410
Cash invested: $156,772 (down + closing). Projections, not guarantees.
Landlord ↔ Tenant lean methodology
- Overall (STATE)
- 18 Strongly Tenant-Friendly
- State California
- 18 Strongly Tenant-Friendly · D+13
- County
- — inherits STATE
- City
- — inherits STATE
ZIP-level market 93257
- Rents YoY
- 4.1%
- Active inventory
- 325
- Price-to-rent
- 42.7×
Monthly cashflow live
- Estimated rent
- $4,310 high interval (Pro) →
- Mortgage (P&I)
- −$2,936
- Tax est. 1.5%
- −$700 /mo · $8,398/yr
- Insurance
- −$233
- HOA
- −$0
- Vacancy / Maint / Mgmt
- −$905
- Net cashflow
- $-464
Break-even live
Sensitivity live
| Price | -10% $-78 | -5% $-271 | +0% $-464 | +5% $-658 | +10% $-851 |
|---|---|---|---|---|---|
| Rent | -10% $-805 | -5% $-635 | +0% $-464 | +5% $-294 | +10% $-124 |
| Rate | -1.0pp $-182 | -0.5pp $-322 | base $-464 | +0.5pp $-610 | +1.0pp $-757 |
4-unit breakdown (identical units grouped — click to expand)
| Units | Beds | Baths | Est. rent |
|---|---|---|---|
| 3× units | 2 | 1 | $3,282 |
| #1 | 2 | 1 | $1,094 |
| #2 | 2 | 1 | $1,094 |
| #3 | 2 | 1 | $1,094 |
| 1× unit | 1 | 1 | $1,029 |
| Total (4 units) | $4,310 | ||
UW: 25.0% down · 7.5% · 30yr · 1.5% tax · 5.0% vac · 8.0% maint · 8.0% mgmt
Financing live
Cash to close
- Down payment
- $139,975
- Closing costs
- $16,797
- Reserves months
- —
- Total cash needed
- —
Loan-product check · same deal, 3 products live
Conventional
25% down · 7.5% · 30yr
- Down + closing
- —
- Monthly P&I
- —
- Monthly cashflow
- —
- DSCR
- —
- Eligible?
- —
Personal DTI + credit; lowest rate.
DSCR
20% down · 8.5% · 30yr
- Down + closing
- —
- Monthly P&I
- —
- Monthly cashflow
- —
- DSCR
- —
- Eligible?
- —
No personal income docs; deal must DSCR.
Hard money
10% down · 12.0% · 12mo
- Down + closing
- —
- Monthly P&I
- —
- Monthly cashflow
- —
- DSCR
- —
- Eligible?
- —
Short-term bridge; refi at stabilization.
Listing history 21 events
-
2026-06-21days on market $559,900 Active 184 DOM
-
2026-06-18days on market $559,900 Active 181 DOM
-
2026-06-17days on market $559,900 Active 180 DOM
-
2026-06-16days on market $559,900 Active 179 DOM
-
2026-06-15days on market $559,900 Active 178 DOM
-
2026-06-14days on market $559,900 Active 176 DOM
-
2026-06-13days on market $559,900 Active 175 DOM
-
2026-06-10days on market $559,900 Active 173 DOM
-
2026-06-09days on market $559,900 Active 172 DOM
-
2026-06-08days on market $559,900 Active 171 DOM
-
2026-06-07pricedays on market $559,900 Active 170 DOM
-
2026-06-05days on market $537,700 Active 167 DOM
-
2026-06-03days on market $537,700 Active 166 DOM
-
2026-06-02days on market $537,700 Active 165 DOM
-
2026-06-01days on market $537,700 Active 164 DOM
-
2026-05-31days on market $537,700 Active 163 DOM
-
2026-05-30days on market $537,700 Active 162 DOM
-
2026-04-01price $537,700 268-char remark
Show marketing remark (268 chars)
Looking for adding more units on your portfolio or thinking on staring one? Take a look at these Quadruplex, 3 units with 2 bedrooms 1 bathroom and1 unit with 1 bedroom 1 bathroom featuring new flooring and some more upgrades! Schedule your private showing TODAY!!!
-
2026-03-20status Active 268-char remark
Show marketing remark (268 chars)
Looking for adding more units on your portfolio or thinking on staring one? Take a look at these Quadruplex, 3 units with 2 bedrooms 1 bathroom and1 unit with 1 bedroom 1 bathroom featuring new flooring and some more upgrades! Schedule your private showing TODAY!!!
-
2026-03-12historical 268-char remark
Show marketing remark (268 chars)
Looking for adding more units on your portfolio or thinking on staring one? Take a look at these Quadruplex, 3 units with 2 bedrooms 1 bathroom and1 unit with 1 bedroom 1 bathroom featuring new flooring and some more upgrades! Schedule your private showing TODAY!!!
-
2025-12-11$539,900 Active 268-char remark
Show marketing remark (268 chars)
Looking for adding more units on your portfolio or thinking on staring one? Take a look at these Quadruplex, 3 units with 2 bedrooms 1 bathroom and1 unit with 1 bedroom 1 bathroom featuring new flooring and some more upgrades! Schedule your private showing TODAY!!!
ⓘ Source: listings_history table (triggers on properties + properties_extension) + one-shot
backfill from property_details.listing_events for pre-trigger history.
Climate risk First Street
- Flood 1/10 Low FEMA zone X (unshaded) · 0% chance over 30 yrs
- Wildfire 8/10 Severe
- Heat 8/10 Severe 7 d/yr ≥105°F today · 17 d/yr by 30 yrs out
- Wind 1/10 Low
- Air quality 10/10 Extreme 38 unhealthy d/yr today · 42 by 30 yrs out
Nearby sold comps map
Loading sold comps map…
Walkable amenities ~0.75 mi
Loading nearby amenities…
Taxation est. · year 1
- Rental income
- $51,720
- − Mortgage interest
- −$31,363
- − Property taxes
- −$8,398
- − Insurance
- −$2,800
- − Repairs & maintenance
- −$4,138
- − Management
- −$4,138
- − Depreciation
- −$16,288
- Taxable loss
- −$15,404
- Est. tax savings @ 24.0%
- +$3,697
- After-tax cash flow
- $-1,876/yr
For passive investors: Depreciation is non-cash, so a rental often shows a tax loss while cash-flowing — sheltering income. Rental losses are passive: they offset passive income freely, and up to $25,000/yr can offset ordinary (W-2) income if you actively participate and your MAGI is under $100k (phasing out to $0 by $150k); unused losses carry forward. On sale, claimed depreciation is recaptured at up to 25%, and gains may owe capital-gains tax (a 1031 exchange can defer both). Figures are a year-1 estimate at your 24.0% rate — not tax advice; consult a CPA.
Condition & rehab AI · 12 photos
This quadruplex is in good condition with recent updates, making it a solid investment opportunity.
Value-add opportunities
- Both landscaping — enhances curb appeal and adds value
- Both paint exterior — improves curb appeal and adds value
- Both replace mailboxes — improves curb appeal and adds value
Renovation cost estimate screening
Value-add ROI direction
- Both landscaping — enhances curb appeal and adds value ↑
- Both paint exterior — improves curb appeal and adds value ↑
- Both replace mailboxes — improves curb appeal and adds value ↑
ⓘ Cost ranges are severity-bucket heuristics (US national rule-of-thumb). Get contractor quotes + a written scope before underwriting a rehab budget.
Schools (NCES district)
- District
- Porterville Unified
- NCES district ID
- 0600064
- Math proficiency
- 18% ▼ -10.00%
- Reading proficiency
- 50% ▲ 6.00%
- Median HH income
- $35,157
- Composite
- 27.97/100
- National rank
- #6855
- State rank
- #302 of 517 in CA
Livability — Porterville
- Score
- 60/100
- State rank
- #561
- US rank
- #18537
Category grades
Schools grade is shown separately in the Schools card above.
Census & demographics
- Census place
- Porterville, CA
- County
- Tulare County · 323,826 people
- City population
- 80,467
- Metro
- Visalia, CA
- Population (ZIP)
- 80,467
- Household income
- $59,704
- Rent vs Own
- Severe rent burden
- 3028.0
Population outlook (Tulare County) Hauer SSP2
- Today (2025)
- 484,681 people
- By 2030
- 496,241 · +2.4%
- By 2040
- 518,507 · +7.0%
- By 2050
- 534,920 · +10.4%
- By 2075
- 548,417 · +13.2%
- By 2100
- 513,085 · +5.9%
Race, ethnicity, and origin ACS 2023
- Neighborhood character
- Predominantly Hispanic (72%)
- Race & ethnicity
- Hispanic / Latino 72% Two or more races 23% White 21% Native American 3% Asian 2%
- Hispanic origin (detail)
- Mexican 69%
- Common ancestry
- Iranian 1%
- Foreign-born
- 26% · Canada
- Languages at home
- 45% English-only · Spanish 52% Tagalog/Filipino 1% Arabic 1%
Political lean MEDSL · Tulare
- 2024 margin
- Strong R (+20.7) · D 38.5% · R 59.2% · Other 2.3%
- 2008→2024 swing
- -5.4pp toward R · 2008: -15.3pp · 2024: -20.7pp
- All cycles
- 2024: R+20.7 2020: R+7.8 2016: R+12.1 2012: R+17.8 2008: R+15.3
Not yet ingested
- Civics
- —
Market trends
- HPI YoY
- ▼ -375.52%
- Current HPI
- 362.656
- Rent YoY
- ▲ 4.07%
- Metro
- Visalia, CA
- State GDP YoY
- ▲ 3.21%
- F500 in state
- 116
Industry mix (Fortune 500 HQ in CA)
| Industry | F500 HQs | Revenue |
|---|---|---|
| Technology | 27 | $1,492B |
|
||
| Financial Services | 3 | $174B |
|
||
| Retail | 3 | $44B |
|
||
| Insurance | 3 | $26B |
|
||
| Media / Entertainment | 2 | $115B |
|
||
| Pharmaceuticals / Biotech | 2 | $62B |
|
||
Price history
-0.4% since first listed4 events — show timeline
- 2026-04-01 Price Changed $537,700 TCMLS
- 2026-03-20 Relisted — TCMLS
- 2026-03-12 Delisted — TCMLS
- 2025-12-11 Listed $539,900 TCMLS
Cash-flow waterfall
monthlySold comps — $/sqft
last 12 mo · ≤1 miLoading sold comps…