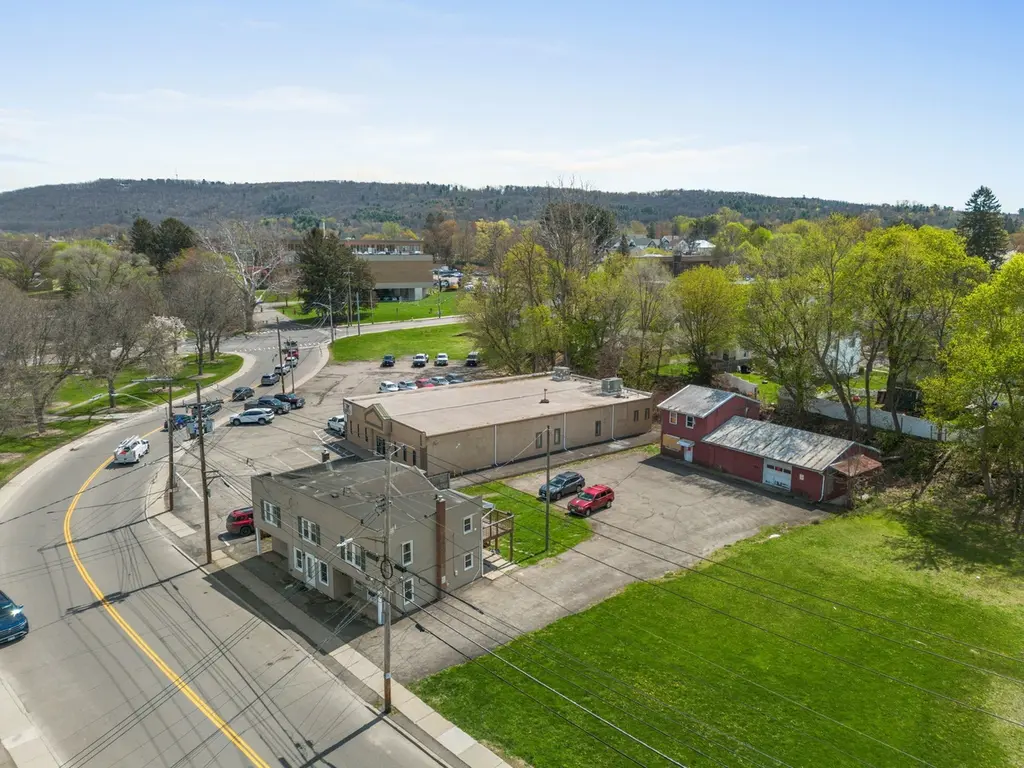
 Fourplex
141 Front St · Endicott, NY
Flood risk 9/10 · Severe
- FEMA flood zone
- X
- Chance of flooding over 30 yrs
- 0.98%
- Est. flood insurance / yr
- $473 – $860
Fire risk 1/10 · Minimal
- Est. fire insurance / yr
- $691 – $1,283
Heat risk 3/10 · Minor
- Hot days now (above 93°F)
- 7 days/yr
- Hot days in 30 yrs
- 16 days/yr
Wind risk 2/10 · Minimal
- Chance of severe wind over 30 yrs
- 2.0%
Air-quality risk 2/10 · Minimal
- Unhealthy air days now
- 0 days/yr
- Unhealthy air days in 30 yrs
- 1 days/yr
Risk factors via First Street. Map © Google.
Why this score? — see what drove the B- grade
The composite is a weighted blend of 9 inputs, each scored 0–100. Each bar is that input's sub-score; the figure is the points it added to the 100-point composite (weight × sub-score).
- Cash flow +30.0/30.0
- 1% rule +10.0/10.0
- DSCR +10.0/10.0
- Schools +5.7/10.0
- ARV discount +3.8/15.0
- Livability +3.5/5.0
- Rent growth +2.5/5.0
- Condition / age +2.5/5.0
- Appreciation +0.0/10.0
$325,000
🖨 Deal sheet 📄 Offer letter ✓ Due diligence
Multi-family units
County records classify this as Multi-Family (5+ Unit). Listing-text estimate: 4 units. estimate disagrees with records
5+ unit building — per-unit beds/baths from public records are typically unavailable; the breakdown below (if shown) is an estimate from the listing text.
Listing remarks MLS
Vestal, New York Investment Property!! Located less than 20 minutes outside of Binghamton. This property offers two buildings, with four rental units within. Each unit has open liivngroom/ kitchen areas with hardwoods, carpets and tile throughout. Gas and electric have a total of 4 meters and run approximately $240 per month with hot water and heating system. Water bill is $1200 per year. Property income grosses $26,100.
Key facts
- Access to bus line
- 0.31 acre lot
- 2 garage spots
Tags
Property features AI
Finance
- Other: Zoned C-1 (General Shop District)
- Financial info: Mixed rental income reported by unit: two 2-bedroom units ($1,350 each and rental status for one 2-bed not separately listed), two 1-bedroom units ($1,150 and $850); Property used as income-producing multifamily (quadruplex)
Exterior
- Parking: Detached oversized garage; Driveway; 2 garage spaces
- Security: No security details provided
- Utilities: Public water; Public sewer; Cable available
- Home design: Residential income property (quadruplex)
- Construction: Vinyl siding
- Exterior features: Covered porch; Level lot
Interior
- Kitchen: No kitchen appliance list provided
- Bedrooms: Two 2-bedroom units and two 1-bedroom units
- Flooring: Hardwood; Vinyl
- Bathrooms: 4 full bathrooms (total for property)
- Heating & cooling: Forced air heating; No central cooling
- Interior features: High-speed internet; Gas water heater
- Laundry & utility: No laundry details provided
Neighborhood map
What this means for you Summary
Snapshot
- This is a 4 × 5-bed/4.0-bath units multifamily listed at $325k.
Deal economics
- At list price, monthly cash flow is $4k ($43k/yr) — positive. Per door: $890/mo.
- The deal already cash-flows at list — no discount required.
- Meets the 1% rule at list price ($8k rent vs $325k).
- Recommended offer: $315k (3.0% below list) — sets the bar for market timing.
- Cap rate 19.6% vs local median 5.5% in Endicott — top-decile yield for the area; either an underpriced asset or a hidden risk that comps aren't pricing in. Stress-test before assuming the spread holds.
Location & tenants
- Location reads 70/100 on livability (#438 in NY) — a middle-class / working-renter tenant base. Strengths: cost of living A+, health & safety A+, housing A; Watch: amenities D, crime F, commute F.
- Vestal Central School District (suburban): math 63% / reading 68% proficiency, ranked #168 of 590 in NY (top 28%) — acceptable for families but not a draw, mixed tenant base, ~2y average lease; only 17% free/reduced lunch — higher-income household profile.
- Zoned schools: Clayton Avenue Elementary School (math 52% / reading 62%, grade C+, #842 of 2,108 statewide, top 43%, 248 students, 49% FRL) — zoned schools average 49% FRL vs 17% district-wide (31 pts higher); higher-poverty schools than district average — tighter screening recommended.
- Market conditions: 90 active listings in the ZIP; 340 units permitted in Broome County in 2024 (269 in 5+ unit buildings).
Forward outlook
- Local home prices are declining (-3.0%/yr); year-one equity from $2k of loan paydown is wiped out by about $10k of value loss. Plan a longer hold.
- Broome County population projected at -13% by 2050 — secular population decline; favor cash flow + early exit over multi-decade hold.
- At projected returns (-3.0% appreciation + 3.0% rent growth), your $91k cash investment doubles in ~3 years — after that, you're playing with house money.
Negotiation context
- It's been on market 56 days — a 3% lower offer ($315k) is reasonable based on typical stale-listing flexibility.
- 4 sale attempts since 3y ago with the ask held roughly flat each time — persistent listings suggest the price (not the market) is what's stuck; bring a comps-based counter.
- Current owner paid $200k; list at $325k implies a 62% gain — meaningful room to come down on a strong offer.
Risks & watch-outs
- Watch-outs: property tax is 4.2% of price; flood insurance adds $56/mo.
- Climate carrying-cost: severe flood risk — expect insurance premiums to compound above CPI over the hold.
Questions for the listing agent
- It's been on market 56 days. Have you received any prior offers? Is the seller open to a 3% concession, seller financing, or rate buy-down credit?
- Can we see the unit-by-unit rent roll, current vacancy, and any below-market leases? What's the average tenancy length?
- What capital expenditures (roof, boiler, parking lot, exteriors) have been made in the last 5 years, and what's planned in the next 2?
- Built in 1965 — when were the roof, HVAC, electrical panel, plumbing, and water heater last replaced?
- Property tax is high relative to price — has the assessment been appealed recently, and will the sale trigger a re-assessment?
- What's the actual annual flood-insurance premium (NFIP or private), and is the property in a SFHA with mandatory coverage?
- Is there a deadline driving the sale (1031 exchange, divorce, estate, relocation)? That informs how much negotiation room exists.
- Schools are D-rated, which usually means shorter tenancies and higher turnover. Who's the typical renter profile here, and what's been the actual vacancy rate?
- Crime grade is F in this area — have there been break-ins, vandalism, or insurance claims at this property in the last 3 years? What carrier currently insures it and at what premium?
- What's the average days-on-market for RENTAL listings here right now (not sales)? A rising rental-DOM trend means longer vacancies and softer asking-rent achievability than the comps imply.
- What's the recent tenant-quality profile in this submarket — average credit score on applications, eviction rate, late-payment / NSF rate, and stable-employment percentage? A property-management company in the area should have these aggregated.
- How much new apartment / multifamily construction is in the pipeline within 1–3 miles? Heavy new supply (>2% of stock underway) typically softens rents 12–24 months out; light construction supports rent growth.
Investment metrics
- 1% rule
- 2.57% ✓
- Cap rate
- 19.64%
- Cash-on-cash
- 47.68%
- DSCR
- 3.12
- GRM
- 3.2
CMA / ARV
- ARV (median comp)
- $300,000
- List price
- $325,000
- Delta
- 8.33%
- Verdict
- FAIR
- Comps
- 3 within 2.0 mi
Projected returns pro-forma
-3.0% appreciation · 3.0% rent growth · sell at horizon
- IRR
- 44.4%
- Equity multiple
- 2.92×
- Total profit
- $174,682
- Equity at exit
- $48,459
- IRR
- 50.3%
- Equity multiple
- 5.91×
- Total profit
- $446,555
- Equity at exit
- $28,100
Cash invested: $91,000 (down + closing). Projections, not guarantees.
Landlord ↔ Tenant lean methodology
- Overall (STATE)
- 15 Strongly Tenant-Friendly
- State New York
- 15 Strongly Tenant-Friendly · D+10
- County
- — inherits STATE
- City
- — inherits STATE
ZIP-level market 13850
- Home prices YoY
- -33.5%
- Active inventory
- 90
- Price-to-rent
- 13.0×
Monthly cashflow live
- Estimated rent
- $8,352 medium interval (Pro) →
- Mortgage (P&I)
- −$1,704
- Tax from tax record
- −$1,143 /mo · $13,714/yr
- Insurance
- −$135
- Flood insurance flood zone
- −$56 /mo · $666/yr
- HOA
- −$0
- Vacancy / Maint / Mgmt
- −$1,754
- Net cashflow
- $3,560
Break-even live
4-unit breakdown (identical units grouped — click to expand)
| Units | Beds | Baths | Est. rent |
|---|---|---|---|
| 4× units | 5 | 4 | $8,352 |
| #1 | 5 | 4 | $2,088 |
| #2 | 5 | 4 | $2,088 |
| #3 | 5 | 4 | $2,088 |
| #4 | 5 | 4 | $2,088 |
| Total (4 units) | $8,352 | ||
UW: 25.0% down · 7.5% · 30yr · 1.5% tax · 5.0% vac · 8.0% maint · 8.0% mgmt
Financing live
Cash to close
- Down payment
- $81,250
- Closing costs
- $9,750
- Reserves months
- —
- Total cash needed
- —
Loan-product check · same deal, 3 products live
Conventional
25% down · 7.5% · 30yr
- Down + closing
- —
- Monthly P&I
- —
- Monthly cashflow
- —
- DSCR
- —
- Eligible?
- —
Personal DTI + credit; lowest rate.
DSCR
20% down · 8.5% · 30yr
- Down + closing
- —
- Monthly P&I
- —
- Monthly cashflow
- —
- DSCR
- —
- Eligible?
- —
No personal income docs; deal must DSCR.
Hard money
10% down · 12.0% · 12mo
- Down + closing
- —
- Monthly P&I
- —
- Monthly cashflow
- —
- DSCR
- —
- Eligible?
- —
Short-term bridge; refi at stabilization.
Listing history 21 events
-
2026-06-19days on market $325,000 Active 56 DOM
-
2026-06-18days on market $325,000 Active 55 DOM
-
2026-06-17days on market $325,000 Active 54 DOM
-
2026-06-16days on market $325,000 Active 53 DOM
-
2026-06-15days on market $325,000 Active 52 DOM
-
2026-06-14days on market $325,000 Active 50 DOM
-
2026-06-13days on market $325,000 Active 49 DOM
-
2026-06-10days on market $325,000 Active 47 DOM
-
2026-06-09days on market $325,000 Active 46 DOM
-
2026-06-08days on market $325,000 Active 45 DOM
-
2026-06-07days on market $325,000 Active 44 DOM
-
2026-06-02days on market $325,000 Active 39 DOM
-
2026-06-01days on market $325,000 Active 38 DOM
-
2026-05-31days on market $325,000 Active 37 DOM
-
2026-05-30days on market $325,000 Active 36 DOM
-
2026-04-24$325,000 Active 893-char remark
-
2025-02-11$380,000 Active
-
2023-04-23soldstatus $200,000 Closed
Show marketing remark (424 chars)
Vestal, New York Investment Property!! Located less than 20 minutes outside of Binghamton. This property offers two buildings, with four rental units within. Each unit has open liivngroom/ kitchen areas with hardwoods, carpets and tile throughout. Gas and electric have a total of 4 meters and run approximately $240 per month with hot water and heating system. Water bill is $1200 per year. Property income grosses $26,100.
-
2023-01-31status Active
Show marketing remark (424 chars)
Vestal, New York Investment Property!! Located less than 20 minutes outside of Binghamton. This property offers two buildings, with four rental units within. Each unit has open liivngroom/ kitchen areas with hardwoods, carpets and tile throughout. Gas and electric have a total of 4 meters and run approximately $240 per month with hot water and heating system. Water bill is $1200 per year. Property income grosses $26,100.
-
2023-01-17status Pending
Show marketing remark (424 chars)
Vestal, New York Investment Property!! Located less than 20 minutes outside of Binghamton. This property offers two buildings, with four rental units within. Each unit has open liivngroom/ kitchen areas with hardwoods, carpets and tile throughout. Gas and electric have a total of 4 meters and run approximately $240 per month with hot water and heating system. Water bill is $1200 per year. Property income grosses $26,100.
-
2023-01-09$225,000 Active
Show marketing remark (424 chars)
Vestal, New York Investment Property!! Located less than 20 minutes outside of Binghamton. This property offers two buildings, with four rental units within. Each unit has open liivngroom/ kitchen areas with hardwoods, carpets and tile throughout. Gas and electric have a total of 4 meters and run approximately $240 per month with hot water and heating system. Water bill is $1200 per year. Property income grosses $26,100.
ⓘ Source: listings_history table (triggers on properties + properties_extension) + one-shot
backfill from property_details.listing_events for pre-trigger history.
Tax reassessment forecast NY · Partial reset (capped growth)
- Current annual tax
- $13,714 · $1,143/mo
- Projected year-2 tax
- $13,714 · $1,143/mo
- Expected delta
- $0/yr ($0/mo · 0.0%)
ⓘ Screening estimate from a state-policy table — verify with the county assessor before closing.
Climate risk First Street
- Flood 9/10 Extreme FEMA zone X · 98% chance over 30 yrs
- Wildfire 1/10 Low
- Heat 3/10 Moderate 7 d/yr ≥93°F today · 16 d/yr by 30 yrs out
- Wind 2/10 Low 2% chance of damaging wind over 30 yrs
- Air quality 2/10 Low 0 unhealthy d/yr today · 1 by 30 yrs out
Nearby sold comps map
Loading sold comps map…
Walkable amenities ~0.75 mi
Loading nearby amenities…
Taxation est. · year 1
- Rental income
- $100,224
- − Mortgage interest
- −$18,205
- − Property taxes
- −$13,714
- − Insurance
- −$2,292
- − Repairs & maintenance
- −$8,018
- − Management
- −$8,018
- − Depreciation
- −$9,455
- Taxable income
- $40,523
- Est. tax owed @ 24.0%
- −$9,725
- After-tax cash flow
- $32,994/yr
For passive investors: Depreciation is non-cash, so a rental often shows a tax loss while cash-flowing — sheltering income. Rental losses are passive: they offset passive income freely, and up to $25,000/yr can offset ordinary (W-2) income if you actively participate and your MAGI is under $100k (phasing out to $0 by $150k); unused losses carry forward. On sale, claimed depreciation is recaptured at up to 25%, and gains may owe capital-gains tax (a 1031 exchange can defer both). Figures are a year-1 estimate at your 24.0% rate — not tax advice; consult a CPA.
Schools (NCES district)
- District
- Vestal Central School District
- NCES district ID
- 3629610
- Math proficiency
- 63% ▼ -7.00%
- Reading proficiency
- 68% ▲ 4.00%
- Median HH income
- $64,143
- Composite
- 56.97/100
- National rank
- #1111
- State rank
- #168 of 590 in NY
Livability — Endicott
- Score
- 70/100
- State rank
- #438
- US rank
- #7657
Category grades
Schools grade is shown separately in the Schools card above.
Census & demographics
- City population
- 42,896
- Population (ZIP)
- 23,675
Population outlook (Broome County) Hauer SSP2
- Today (2025)
- 187,989 people
- By 2030
- 183,066 · -2.6%
- By 2040
- 172,228 · -8.4%
- By 2050
- 163,161 · -13.2%
- By 2075
- 153,641 · -18.3%
- By 2100
- 140,851 · -25.1%
Race, ethnicity, and origin ACS 2023
- Neighborhood character
- Predominantly White (78%)
- Race & ethnicity
- White 78% Asian 12% Hispanic / Latino 5% Two or more races 5% Black 2%
- Hispanic origin (detail)
- Puerto Rican 2%
- Common ancestry
- Romanian 6% Scotch-Irish 2% Italian 2%
- Foreign-born
- 14% · China, Canada, South Korea
- Languages at home
- 84% English-only · Chinese 6% Other Indo-European 5% Other Asian/Pacific 2%
Political lean MEDSL · Broome
- 2024 margin
- Toss-up / Even · D 50.2% · R 49.8%
- 2008→2024 swing
- -7.6pp toward R · 2008: 8.0pp · 2024: 0.4pp
- All cycles
- 2024: D+0.4 2020: D+3.5 2016: R+3.7 2012: D+4.6 2008: D+8.0
Not yet ingested
- Civics
- —
Market trends
- HPI YoY
- ▼ -142.14%
- Current HPI
- 282.4645
- Rent YoY
- —
- Metro
- —
- State GDP YoY
- ▲ 2.60%
- F500 in state
- 92
Industry mix (Fortune 500 HQ in NY)
| Industry | F500 HQs | Revenue |
|---|---|---|
| Financial Services | 10 | $950B |
|
||
| Consumer Goods | 9 | $162B |
|
||
| Insurance | 4 | $225B |
|
||
| Telecommunications | 2 | $144B |
|
||
| Pharmaceuticals | 2 | $112B |
|
||
| Media / Entertainment | 2 | $69B |
|
||
Price history
+44.4% since first listed6 events — show timeline
- 2026-04-24 Listed $325,000 GBAOR
- 2025-02-11 Listed $380,000 GBAOR
- 2023-04-23 Sold (MLS) $200,000 GBAOR
- 2023-01-31 Relisted — GBAOR
- 2023-01-17 Pending — GBAOR
- 2023-01-09 Listed $225,000 GBAOR
Property tax history
+8.6%/yrLatest (2025): $13,714 · +120.2% YoY. Source: county tax records.
Cash-flow waterfall
monthlySold comps — $/sqft
last 12 mo · ≤1 miLoading sold comps…