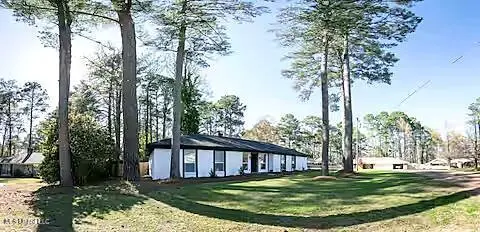
100 Vine Ln · Flowood, MS
Flood risk 1/10 · Minimal
- FEMA flood zone
- X (unshaded)
- Chance of flooding over 30 yrs
- 0.0%
- Est. flood insurance / yr
- $507 – $1,088
Fire risk 1/10 · Minimal
- Est. fire insurance / yr
- $1,241 – $2,305
Heat risk 7/10 · Major
- Hot days now (above 108°F)
- 7 days/yr
- Hot days in 30 yrs
- 20 days/yr
Wind risk 8/10 · Major
- Chance of severe wind over 30 yrs
- 80.0%
Air-quality risk 2/10 · Minimal
- Unhealthy air days now
- 1 days/yr
- Unhealthy air days in 30 yrs
- 1 days/yr
Risk factors via First Street. Map © Google.
Why this score? — see what drove the D+ grade
The composite is a weighted blend of 9 inputs, each scored 0–100. Each bar is that input's sub-score; the figure is the points it added to the 100-point composite (weight × sub-score).
- Cash flow +13.9/30.0
- ARV discount +13.9/15.0
- Schools +4.6/10.0
- DSCR +4.2/10.0
- Livability +3.9/5.0
- 1% rule +3.3/10.0
- Rent growth +3.2/5.0
- Condition / age +2.5/5.0
- Appreciation +0.0/10.0
$209,900
🖨 Deal sheet 📄 Offer letter ✓ Due diligence
Listing remarks MLS
Super cute and recently renovated, this home checks all the boxes. Fresh updates, modern touches, and a layout that just feels right the moment you walk in. The location is hard to beat -- walking distance to bike trails, fishing spots, a dog park, plus fantastic shopping and dining. Whether you love being outdoors or close to everything, this one gives you both. Charming, updated, and perfectly located -- this is the kind of home people move fast on.
Key facts
- Recently renovated
- 6,534 sq ft lot
- 2 garage spots
Tags
Neighborhood map
What this means for you Summary
Snapshot
- This is a 2-bed/1.0-bath single-family listed at $210k.
Deal economics
- At list price, monthly cash flow is $21 ($256/yr) — positive.
- The deal already cash-flows at list — no discount required.
- To meet the 1% rule (rent ≥ 1% of price), the offer needs to be $174k (17.2% below list).
- Recommended offer: $174k (17.2% below list) — sets the bar for 1% rule.
- Cap rate 6.4% vs local median 4.3% in Flowood — top-decile yield for the area; either an underpriced asset or a hidden risk that comps aren't pricing in. Stress-test before assuming the spread holds.
Location & tenants
- Location reads 77/100 on livability (#10 in MS, #3,075 nationally) — a middle-class / working-renter tenant base. Strengths: crime A+, cost of living A+, housing A+; Watch: amenities F, commute F.
- Rankin County School District (rural): math 56% / reading 48% proficiency, ranked #6 of 130 in MS (top 5%) — acceptable for families but not a draw, mixed tenant base, ~2y average lease.
- Market conditions: Rents rising (+2.9%/yr); 433 active listings in the ZIP; 9 comparable units currently listed for rent nearby; rentals at typical pace (median 21d on market — plan ~3-4 weeks tenant-placement turnaround); solid renter incomes; 343 units permitted in Rankin County in 2024 (0 in 5+ unit buildings).
Forward outlook
- Local home prices are declining (-3.0%/yr); year-one equity from $1k of loan paydown is wiped out by about $6k of value loss. Plan a longer hold.
- Rankin County population projected at +17% by 2050 — long-run rental-demand tailwind backs the buy-and-hold thesis.
Negotiation context
- It's been on market 55 days — a 3% lower offer ($204k) is reasonable based on typical stale-listing flexibility.
- 2 sale attempts with the ask held roughly flat each time — persistent listings suggest the price (not the market) is what's stuck; bring a comps-based counter.
Risks & watch-outs
- Climate carrying-cost: severe wind risk, 80% chance of damaging wind over 30y; extreme-heat days projected 7→20/yr by 2055 (HVAC capex compounding) — expect insurance premiums to compound above CPI over the hold.
Questions for the listing agent
- It's been on market 55 days. Have you received any prior offers? Is the seller open to a 17% concession, seller financing, or rate buy-down credit?
- Built in 1972 — when were the roof, HVAC, electrical panel, plumbing, and water heater last replaced?
- Is there a deadline driving the sale (1031 exchange, divorce, estate, relocation)? That informs how much negotiation room exists.
- Schools are B-rated — typically a magnet for longer-tenancy family renters. What's the average tenant stay here, and is there a school-zone premium baked into asking?
- The area grade is low — what's the realistic commute time and amenity access for the typical tenant pool here? Any planned neighborhood developments (good or bad) we should know about?
- What's the average days-on-market for RENTAL listings here right now (not sales)? A rising rental-DOM trend means longer vacancies and softer asking-rent achievability than the comps imply.
- What's the recent tenant-quality profile in this submarket — average credit score on applications, eviction rate, late-payment / NSF rate, and stable-employment percentage? A property-management company in the area should have these aggregated.
- How much new for-sale + rental construction is in the pipeline within 1–3 miles? Heavy new supply typically softens prices + rents 12–24 months out; constrained supply supports both.
Investment metrics
- 1% rule
- 0.83% ✗
- Cap rate
- 6.41%
- Cash-on-cash
- 0.44%
- DSCR
- 1.02
- GRM
- 10.1
CMA / ARV
- ARV (median comp)
- $244,406
- List price
- $209,900
- Delta
- -14.12%
- Verdict
- UNDERPRICED
- Comps
- 20 within 1.0 mi
Show comp detail 12 sales within ~0.75 mi
| Address | Dist | Beds/Ba | Sqft | Sold | Price | $/sf | Match |
|---|---|---|---|---|---|---|---|
| 100 Vine Ln | 0.00mi | 2/2.0 | 1,381 (+11%) | 0mo | $209,900 | $152 | 78 |
| 203 Lotus Dr | 0.07mi | 3/2.0 (+1) | 1,408 (+13%) | 1mo | $269,900 | $192 | 65 |
| 117 Cape Charles | 0.50mi | 2/2.0 | 1,200 (-4%) | 8mo | $215,000 | $179 | 60 |
| 202 Commonwealth Ave | 0.62mi | 2/2.0 | 1,200 (-4%) | 3mo | $204,900 | $171 | 59 |
| 512 Sweetwater | 0.37mi | 2/2.0 | 1,410 (+13%) | 11mo | $249,900 | $177 | 48 |
| 110 Commonwealth Ave | 0.69mi | 3/2.0 (+1) | 1,301 (+4%) | 6mo | $225,000 | $173 | 46 |
| 190 Commonwealth Ave | 0.61mi | 3/2.0 (+1) | 1,366 (+10%) | 4mo | $225,000 | $165 | 43 |
| 121 Plum Tree Rd | 0.58mi | 3/2.0 (+1) | 1,350 (+8%) | 10mo | $212,000 | $157 | 42 |
| 117 Shenandoah Rd | 0.70mi | 3/2.0 (+1) | 1,426 (+14%) | 1mo | $165,000 | $116 | 33 |
| 408 Pinebrook Cir | 0.74mi | 3/2.0 (+1) | 1,402 (+13%) | 3mo | $239,900 | $171 | 33 |
| 423 Pelahatchie Shore Dr | 0.68mi | 3/2.0 (+1) | 1,407 (+13%) | 9mo | $199,900 | $142 | 30 |
| 16 Ashland Ave | 0.63mi | 3/2.0 (+1) | 1,428 (+15%) | 11mo | $198,500 | $139 | 28 |
Match score weights: distance 35% · size 25% · config 20% · recency 20%. Top-matched comps best support the ARV.
Projected returns pro-forma
-3.0% appreciation · 2.9% rent growth · sell at horizon
- IRR
- -15.7%
- Equity multiple
- 0.44×
- Total profit
- $-32,864
- Equity at exit
- $31,297
- IRR
- -7.5%
- Equity multiple
- 0.53×
- Total profit
- $-27,725
- Equity at exit
- $18,148
Cash invested: $58,772 (down + closing). Projections, not guarantees.
Landlord ↔ Tenant lean methodology
- Overall (STATE)
- 90 Strongly Landlord-Friendly
- State Mississippi
- 90 Strongly Landlord-Friendly · R+11
- County
- — inherits STATE
- City
- — inherits STATE
ZIP-level market 39047
- Home prices YoY
- -32.6%
- Rents YoY
- 2.9%
- Active inventory
- 433
- Price-to-rent
- 10.1×
Monthly cashflow live
- Estimated rent
- $1,737 high interval (Pro) →
- Mortgage (P&I)
- −$1,101
- Tax from tax record
- −$163 /mo · $1,955/yr
- Insurance
- −$87
- HOA
- −$0
- Vacancy / Maint / Mgmt
- −$365
- Net cashflow
- $21
Break-even live
UW: 25.0% down · 7.5% · 30yr · 1.5% tax · 5.0% vac · 8.0% maint · 8.0% mgmt
Financing live
Cash to close
- Down payment
- $52,475
- Closing costs
- $6,297
- Reserves months
- —
- Total cash needed
- —
Loan-product check · same deal, 3 products live
Conventional
25% down · 7.5% · 30yr
- Down + closing
- —
- Monthly P&I
- —
- Monthly cashflow
- —
- DSCR
- —
- Eligible?
- —
Personal DTI + credit; lowest rate.
DSCR
20% down · 8.5% · 30yr
- Down + closing
- —
- Monthly P&I
- —
- Monthly cashflow
- —
- DSCR
- —
- Eligible?
- —
No personal income docs; deal must DSCR.
Hard money
10% down · 12.0% · 12mo
- Down + closing
- —
- Monthly P&I
- —
- Monthly cashflow
- —
- DSCR
- —
- Eligible?
- —
Short-term bridge; refi at stabilization.
Rent comps 9 comps
| Address | Beds | Baths | Sqft | Rent | $/sqft | DOM | Units | Dist |
|---|---|---|---|---|---|---|---|---|
| 352 Brendalwood Cv Brandon, MS | 2.0 | 1.5 | 1248 | $1,157 | $0.93 | 43d | 1 | 0.39mi |
| 154 Plum Tree Rd Brandon, MS | 3.0 | 2.0 | 1289 | $1,931 | $1.50 | 23d | 1 | 0.69mi |
| 500 Avalon Way Brandon, MS | 2.0–3.0 | 2.0 | 1287 | $1,800 | $1.40 | 13d | 6 | 0.85mi |
| 74 Lake Barnett Dr Brandon, MS | 2.0 | 2.0 | 1156 | $2,500 | $2.16 | 13d | 1 | 0.95mi |
| 839 Harbor Bend Dr Unit 1 Brandon, MS | 2.0 | 1.5 | 1000 | $1,295 | $1.29 | 43d | 1 | 0.95mi |
| 833 Harbor Bend Dr Unit 1 Brandon, MS | 2.0 | 1.5 | 1000 | $1,495 | $1.50 | 43d | 1 | 0.95mi |
| 183 Cumberland Rd Brandon, MS | 3.0 | 2.0 | 1097 | $1,750 | $1.60 | 21d | 1 | 0.97mi |
| 111 Lakeshore Dr Brandon, MS | 1.0–3.0 | 1.0–2.0 | 974 | $1,992 | $2.04 | 13d | 8 | 1.10mi |
| 1204 Barnett Bend Cir Brandon, MS | 2.0 | 2.0 | 1127 | $1,625 | $1.44 | 21d | 1 | 1.39mi |
Listing history 5 events
-
2026-05-12status Pending 455-char remark
Show marketing remark (455 chars)
Super cute and recently renovated, this home checks all the boxes. Fresh updates, modern touches, and a layout that just feels right the moment you walk in. The location is hard to beat -- walking distance to bike trails, fishing spots, a dog park, plus fantastic shopping and dining. Whether you love being outdoors or close to everything, this one gives you both. Charming, updated, and perfectly located -- this is the kind of home people move fast on.
-
2026-03-26status Active 455-char remark
Show marketing remark (455 chars)
Super cute and recently renovated, this home checks all the boxes. Fresh updates, modern touches, and a layout that just feels right the moment you walk in. The location is hard to beat -- walking distance to bike trails, fishing spots, a dog park, plus fantastic shopping and dining. Whether you love being outdoors or close to everything, this one gives you both. Charming, updated, and perfectly located -- this is the kind of home people move fast on.
-
2026-03-02status Pending 455-char remark
Show marketing remark (455 chars)
Super cute and recently renovated, this home checks all the boxes. Fresh updates, modern touches, and a layout that just feels right the moment you walk in. The location is hard to beat -- walking distance to bike trails, fishing spots, a dog park, plus fantastic shopping and dining. Whether you love being outdoors or close to everything, this one gives you both. Charming, updated, and perfectly located -- this is the kind of home people move fast on.
-
2026-02-23$209,900 Active 455-char remark
Show marketing remark (455 chars)
Super cute and recently renovated, this home checks all the boxes. Fresh updates, modern touches, and a layout that just feels right the moment you walk in. The location is hard to beat -- walking distance to bike trails, fishing spots, a dog park, plus fantastic shopping and dining. Whether you love being outdoors or close to everything, this one gives you both. Charming, updated, and perfectly located -- this is the kind of home people move fast on.
-
2005-10-13soldstatus
ⓘ Source: listings_history table (triggers on properties + properties_extension) + one-shot
backfill from property_details.listing_events for pre-trigger history.
Tax reassessment forecast MS · Resets to sale price
- Current annual tax
- $1,955 · $163/mo
- Projected year-2 tax
- $1,955 · $163/mo
- Expected delta
- $0/yr ($0/mo · 0.0%)
ⓘ Screening estimate from a state-policy table — verify with the county assessor before closing.
Climate risk First Street
- Flood 1/10 Low FEMA zone X (unshaded) · 0% chance over 30 yrs
- Wildfire 1/10 Low
- Heat 7/10 Severe 7 d/yr ≥108°F today · 20 d/yr by 30 yrs out
- Wind 8/10 Severe 80% chance of damaging wind over 30 yrs
- Air quality 2/10 Low 1 unhealthy d/yr today · 1 by 30 yrs out
Nearby sold comps map
Loading sold comps map…
Walkable amenities ~0.75 mi
Loading nearby amenities…
Taxation est. · year 1
- Rental income
- $20,847
- − Mortgage interest
- −$11,758
- − Property taxes
- −$1,955
- − Insurance
- −$1,050
- − Repairs & maintenance
- −$1,668
- − Management
- −$1,668
- − Depreciation
- −$6,106
- Taxable loss
- −$3,357
- Est. tax savings @ 24.0%
- +$806
- After-tax cash flow
- $1,062/yr
For passive investors: Depreciation is non-cash, so a rental often shows a tax loss while cash-flowing — sheltering income. Rental losses are passive: they offset passive income freely, and up to $25,000/yr can offset ordinary (W-2) income if you actively participate and your MAGI is under $100k (phasing out to $0 by $150k); unused losses carry forward. On sale, claimed depreciation is recaptured at up to 25%, and gains may owe capital-gains tax (a 1031 exchange can defer both). Figures are a year-1 estimate at your 24.0% rate — not tax advice; consult a CPA.
Schools (NCES district)
- District
- Rankin County School District
- NCES district ID
- 2803830
- Math proficiency
- 56% ▼ -4.00%
- Reading proficiency
- 48% ▼ -6.00%
- Median HH income
- $61,867
- Composite
- 45.62/100
- National rank
- #2587
- State rank
- #6 of 130 in MS
Livability — Flowood
- Score
- 77/100
- State rank
- #10
- US rank
- #3075
Category grades
Schools grade is shown separately in the Schools card above.
Census & demographics
- County
- Rankin County · 123,614 people
- City population
- 9,222
- Metro
- Jackson, MS
- Population (ZIP)
- 40,808
- Household income
- $100,347
- Rent vs Own
- Severe rent burden
- 551.0
Population outlook (Rankin County) Hauer SSP2
- Today (2025)
- 164,317 people
- By 2030
- 171,013 · +4.1%
- By 2040
- 182,723 · +11.2%
- By 2050
- 192,376 · +17.1%
- By 2075
- 209,535 · +27.5%
- By 2100
- 209,534 · +27.5%
Race, ethnicity, and origin ACS 2023
- Neighborhood character
- Predominantly White (77%)
- Race & ethnicity
- White 77% Black 16% Two or more races 4% Hispanic / Latino 2% Asian 1%
- Common ancestry
- Italian 4% Slovak 3% Serbian 3%
- Foreign-born
- 3% · Canada
- Languages at home
- 95% English-only · Spanish 3% Other Indo-European 1% Other Asian/Pacific 1%
Political lean MEDSL · Rankin
- 2024 margin
- Solid R (+47.1) · D 25.9% · R 73.0% · Other 1.0%
- 2008→2024 swing
- +6.4pp toward D · 2008: -53.5pp · 2024: -47.1pp
- All cycles
- 2024: R+47.1 2020: R+45.4 2016: R+52.9 2012: R+51.9 2008: R+53.5
Not yet ingested
- Civics
- —
Market trends
- HPI YoY
- ▼ -79.01%
- Current HPI
- 162.9709
- Rent YoY
- ▲ 2.90%
- Metro
- Jackson, MS
- State GDP YoY
- —
- F500 in state
- 0
Price history
5 events — show timeline
- 2026-05-12 Pending — MLSU
- 2026-03-26 Relisted — MLSU
- 2026-03-02 Pending — MLSU
- 2026-02-23 Listed $209,900 MLSU
- 2005-10-13 Sold (Public Records) — Public Records
Property tax history
+4.7%/yrLatest (2025): $1,955 · +5.4% YoY. Source: county tax records.
Cash-flow waterfall
monthlySold comps — $/sqft
last 12 mo · ≤1 miLoading sold comps…