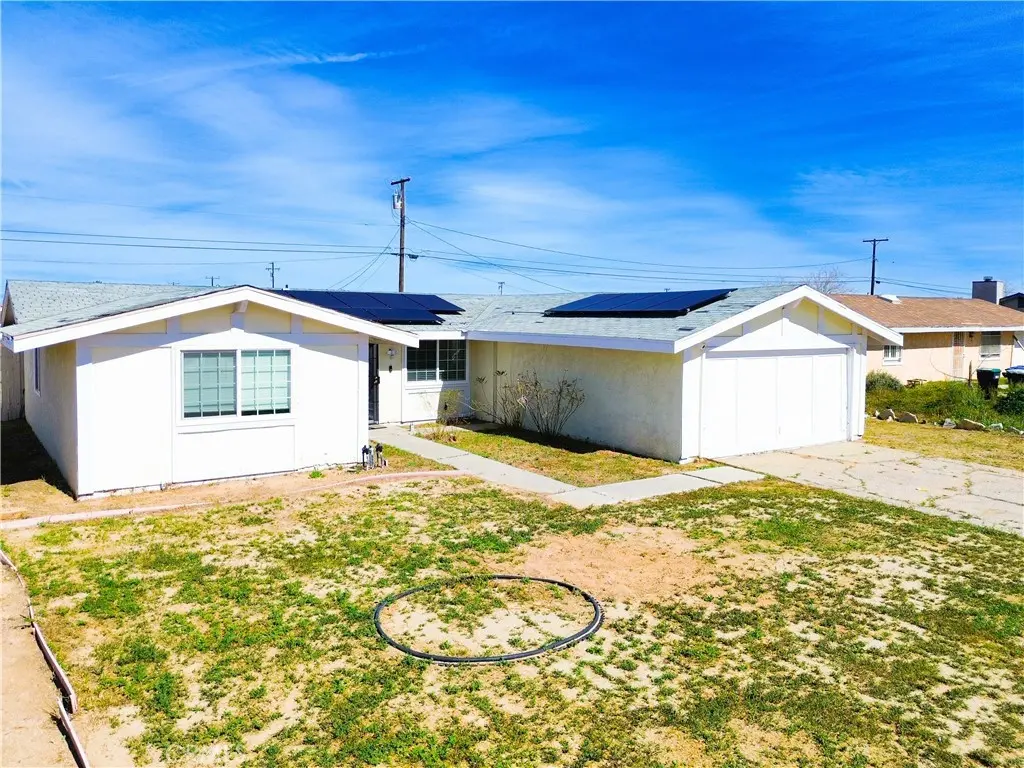
9007 Columbine · California City, CA
Flood risk 1/10 · Minimal
- FEMA flood zone
- X (unshaded)
- Chance of flooding over 30 yrs
- 0.0%
- Est. flood insurance / yr
- $507 – $1,088
Fire risk 1/10 · Minimal
- Est. fire insurance / yr
- $659 – $1,223
Heat risk 8/10 · Major
- Hot days now (above 101°F)
- 6 days/yr
- Hot days in 30 yrs
- 16 days/yr
Wind risk 1/10 · Minimal
- Chance of severe wind over 30 yrs
- —
Air-quality risk 7/10 · Major
- Unhealthy air days now
- 13 days/yr
- Unhealthy air days in 30 yrs
- 17 days/yr
Risk factors via First Street. Map © Google.
Why this score? — see what drove the C+ grade
The composite is a weighted blend of 9 inputs, each scored 0–100. Each bar is that input's sub-score; the figure is the points it added to the 100-point composite (weight × sub-score).
- Cash flow +17.4/30.0
- ARV discount +14.8/15.0
- Appreciation +10.0/10.0
- DSCR +5.4/10.0
- 1% rule +4.3/10.0
- Rent growth +3.9/5.0
- Condition / age +2.5/5.0
- Livability +2.2/5.0
- Schools +2.1/10.0
$244,000
🖨 Deal sheet 📄 Offer letter ✓ Due diligence
Listing remarks MLS
Beautiful 4-bedroom, 2-bathroom home offering 1,550 sq ft of comfortable living space. This well-maintained property is in good condition and features a functional floor plan with spacious bedrooms, a bright living area, and a welcoming atmosphere throughout. The kitchen offers ample cabinet space and flows nicely into the dining area, perfect for everyday living and entertaining. The primary bedroom provides privacy and comfort, while the additional bedrooms offer flexibility for family, guests, or a home office. The backyard offers great potential for outdoor enjoyment. Conveniently located near schools, shopping, and major commuter routes. A great opportunity to own a move-in ready home with plenty of potential!
Key facts
- 9,583 sq ft lot
- 2 garage spots
- Built 1970
Neighborhood map
What this means for you Summary
Snapshot
- This is a 4-bed/2.0-bath single-family listed at $244k.
Deal economics
- At list price, monthly cash flow is $185 ($2k/yr) — positive.
- The deal already cash-flows at list — no discount required.
- To meet the 1% rule (rent ≥ 1% of price), the offer needs to be $227k (7.1% below list).
- Recommended offer: $222k (9.0% below list) — sets the bar for market timing.
- Cap rate 7.2% vs local median 5.2% in California City — top-decile yield for the area; either an underpriced asset or a hidden risk that comps aren't pricing in. Stress-test before assuming the spread holds.
Location & tenants
- Location reads 44/100 on livability (#1,329 in CA) — a working-class tenant base; expect higher turnover. Strengths: housing A+; Watch: schools F, crime F, amenities F.
- Mojave Unified (town): math 25% / reading 25% proficiency, ranked #411 of 517 in CA (top 80%) — low school quality limits family demand, transient renter base, plan for 1-2y turnover; 76% free/reduced lunch — lower-income household profile, screen leases tightly.
- Market conditions: Rents rising fast (+5.5%/yr); 703 active listings in the ZIP; 29 comparable units currently listed for rent nearby; rentals at typical pace (median 24d on market — plan ~3-4 weeks tenant-placement turnaround); 3,244 units permitted in Kern County in 2024 (73 in 5+ unit buildings).
- At $2,266/mo this rent would consume 45% of the median local household income ($60k/yr) (locally 883% of renters already pay >50% of income on rent) — very limited rent-growth headroom before tenants either downsize or default.
Forward outlook
- In year one you build about $26k of equity ($2k loan paydown + $24k appreciation (10.0% local appreciation)).
- Kern County population projected at +17% by 2050 — long-run rental-demand tailwind backs the buy-and-hold thesis.
- At projected returns (10.0% appreciation + 5.5% rent growth), your $68k cash investment doubles in ~3 years — after that, you're playing with house money.
- By year 2, paydown + projected appreciation supports a ~$42k cash-out refi (75% LTV) — recoverable capital for the next deal without selling this one.
Negotiation context
- It's been on market 104 days — a 9% lower offer ($222k) is reasonable based on typical stale-listing flexibility.
- 8 sale attempts since 14y ago with the ask held roughly flat each time — persistent listings suggest the price (not the market) is what's stuck; bring a comps-based counter.
- Current owner paid $199k; 23% above their basis — modest negotiation headroom, anchor on the comps not their cost.
Risks & watch-outs
- Climate carrying-cost: extreme-heat days projected 6→16/yr by 2055 (HVAC capex compounding) — expect insurance premiums to compound above CPI over the hold.
Questions for the listing agent
- It's been on market 104 days. Have you received any prior offers? Is the seller open to a 9% concession, seller financing, or rate buy-down credit?
- Built in 1970 — when were the roof, HVAC, electrical panel, plumbing, and water heater last replaced?
- Why hasn't it sold? Are there any deal-killer items the seller is aware of (foundation, flood, title, zoning, code violations)?
- Is there a deadline driving the sale (1031 exchange, divorce, estate, relocation)? That informs how much negotiation room exists.
- Schools are F-rated, which usually means shorter tenancies and higher turnover. Who's the typical renter profile here, and what's been the actual vacancy rate?
- Crime grade is F in this area — have there been break-ins, vandalism, or insurance claims at this property in the last 3 years? What carrier currently insures it and at what premium?
- What's the average days-on-market for RENTAL listings here right now (not sales)? A rising rental-DOM trend means longer vacancies and softer asking-rent achievability than the comps imply.
- What's the recent tenant-quality profile in this submarket — average credit score on applications, eviction rate, late-payment / NSF rate, and stable-employment percentage? A property-management company in the area should have these aggregated.
- How much new for-sale + rental construction is in the pipeline within 1–3 miles? Heavy new supply typically softens prices + rents 12–24 months out; constrained supply supports both.
Investment metrics
- 1% rule
- 0.93% ✗
- Cap rate
- 7.20%
- Cash-on-cash
- 3.25%
- DSCR
- 1.14
- GRM
- 9.0
CMA / ARV
- ARV (median comp)
- $291,157
- List price
- $244,000
- Delta
- -16.20%
- Verdict
- UNDERPRICED
- Comps
- 20 within 1.0 mi
Show comp detail 12 sales within ~0.75 mi
| Address | Dist | Beds/Ba | Sqft | Sold | Price | $/sf | Match |
|---|---|---|---|---|---|---|---|
| 21231 Corwin St | 0.13mi | 3/2.0 (-1) | 1,632 (+5%) | 4mo | $279,000 | $171 | 76 |
| 8825 Xavier Ave | 0.17mi | 4/2.0 | 1,778 (+15%) | 1mo | $270,000 | $152 | 67 |
| 8873 Holly | 0.55mi | 3/2.0 (-1) | 1,639 (+6%) | 0mo | $260,000 | $159 | 60 |
| 9331 Irene Ave | 0.60mi | 3/2.0 (-1) | 1,507 (-3%) | 4mo | $315,000 | $209 | 59 |
| 8406 Poppy Blvd | 0.71mi | 3/2.0 (-1) | 1,529 (-1%) | 2mo | $250,000 | $164 | 58 |
| 8412 Jimson Ave | 0.67mi | 3/2.0 (-1) | 1,587 (+2%) | 2mo | $270,000 | $170 | 58 |
| 8400 Dogwood Ave | 0.74mi | 3/2.0 (-1) | 1,535 (-1%) | 3mo | $300,000 | $195 | 57 |
| 8760 South Loop Blvd | 0.63mi | 4/2.0 | 1,429 (-8%) | 5mo | $319,900 | $224 | 53 |
| 9407 Irene Ave | 0.62mi | 3/2.0 (-1) | 1,429 (-8%) | 1mo | $325,000 | $227 | 52 |
| 9418 Karen Ave | 0.71mi | 3/2.0 (-1) | 1,626 (+5%) | 3mo | $258,000 | $159 | 52 |
| 8633 Hickory Dr | 0.62mi | 4/2.0 | 1,731 (+12%) | 2mo | $355,000 | $205 | 50 |
| 20412 90th St | 0.70mi | 3/2.0 (-1) | 1,431 (-8%) | 3mo | $250,000 | $175 | 46 |
Match score weights: distance 35% · size 25% · config 20% · recency 20%. Top-matched comps best support the ARV.
Projected returns pro-forma
10.0% appreciation · 5.45% rent growth · sell at horizon
- IRR
- 27.5%
- Equity multiple
- 3.20×
- Total profit
- $150,388
- Equity at exit
- $219,815
- IRR
- 24.7%
- Equity multiple
- 7.53×
- Total profit
- $446,387
- Equity at exit
- $474,038
Cash invested: $68,320 (down + closing). Projections, not guarantees.
Landlord ↔ Tenant lean methodology
- Overall (STATE)
- 18 Strongly Tenant-Friendly
- State California
- 18 Strongly Tenant-Friendly · D+13
- County
- — inherits STATE
- City
- — inherits STATE
ZIP-level market 93505
- Home prices YoY
- 13.0%
- Rents YoY
- 5.5%
- Active inventory
- 703
- Price-to-rent
- 9.0×
Monthly cashflow live
- Estimated rent
- $2,266 high interval (Pro) →
- Mortgage (P&I)
- −$1,280
- Tax from tax record
- −$224 /mo · $2,687/yr
- Insurance
- −$102
- HOA
- −$0
- Vacancy / Maint / Mgmt
- −$476
- Net cashflow
- $185
Break-even live
UW: 25.0% down · 7.5% · 30yr · 1.5% tax · 5.0% vac · 8.0% maint · 8.0% mgmt
Financing live
Cash to close
- Down payment
- $61,000
- Closing costs
- $7,320
- Reserves months
- —
- Total cash needed
- —
Loan-product check · same deal, 3 products live
Conventional
25% down · 7.5% · 30yr
- Down + closing
- —
- Monthly P&I
- —
- Monthly cashflow
- —
- DSCR
- —
- Eligible?
- —
Personal DTI + credit; lowest rate.
DSCR
20% down · 8.5% · 30yr
- Down + closing
- —
- Monthly P&I
- —
- Monthly cashflow
- —
- DSCR
- —
- Eligible?
- —
No personal income docs; deal must DSCR.
Hard money
10% down · 12.0% · 12mo
- Down + closing
- —
- Monthly P&I
- —
- Monthly cashflow
- —
- DSCR
- —
- Eligible?
- —
Short-term bridge; refi at stabilization.
Rent comps 29 comps
| Address | Beds | Baths | Sqft | Rent | $/sqft | DOM | Units | Dist |
|---|---|---|---|---|---|---|---|---|
| 21231 Corwin St California City, CA | 3.0 | 2.0 | 1632 | $2,500 | $1.53 | 23d | 1 | 0.12mi |
| 8801 S Loop Blvd California City, CA | 3.0 | 2.0 | 1537 | $2,600 | $1.69 | 23d | 1 | 0.59mi |
| 9213 Holly Ave California City, CA | 3.0 | 2.0 | 1339 | $1,900 | $1.42 | 3d | 1 | 0.63mi |
| 9548 Sally Ave Unit B California City, CA | 3.0 | 2.5 | 1200 | $1,695 | $1.41 | 23d | 1 | 0.68mi |
| 9019 Evelyn Ave California City, CA | 4.0 | 2.0 | 1731 | $2,600 | $1.50 | 3d | 1 | 0.74mi |
| 20673 Medio St California City, CA | 3.0 | 2.0 | 1690 | $2,075 | $1.23 | 23d | 1 | 0.81mi |
| 20321 88th St California City, CA | 3.0 | 2.0 | 1176 | $2,100 | $1.79 | 23d | 1 | 0.84mi |
| 20312 Dean Ct California City, CA | 3.0 | 2.0 | 1742 | $1,975 | $1.13 | 14d | 1 | 0.92mi |
| 8648 Lime Ave California City, CA | 3.0 | 2.0 | 1459 | $2,400 | $1.64 | 23d | 1 | 0.93mi |
| 21235 Windsong St California City, CA | 3.0 | 3.0 | 1780 | $2,100 | $1.18 | 23d | 1 | 0.95mi |
| 9931 Putter Ct California City, CA | 3.0 | 2.0 | 1445 | $1,675 | $1.16 | 3d | 1 | 0.99mi |
| 21187 Conklin Blvd California City, CA | 3.0 | 2.0 | 1473 | $1,800 | $1.22 | 14d | 1 | 1.01mi |
| 8100 Fernwood Ave California City, CA | 3.0 | 2.0 | 1336 | $1,850 | $1.38 | 23d | 1 | 1.01mi |
| 8307 Charles Pl California City, CA | 3.0 | 2.0 | 1498 | $1,750 | $1.17 | 14d | 1 | 1.04mi |
| 8332 Rea Ave California City, CA | 4.0 | 3.0 | 1861 | $2,500 | $1.34 | 3d | 1 | 1.04mi |
| 8848 Oleander Ave California City, CA | 3.0 | 2.0 | 1302 | $1,900 | $1.46 | 23d | 1 | 1.05mi |
| 21032 79th St California City, CA | 4.0 | 2.0 | 1228 | $2,100 | $1.71 | 23d | 1 | 1.06mi |
| 8560 Nipa Ave California City, CA | 3.0 | 2.0 | 1309 | $1,850 | $1.41 | 14d | 1 | 1.08mi |
| 9225 Peach Ave Unit A California City, CA | 3.0 | 2.0 | 1275 | $1,950 | $1.53 | 23d | 1 | 1.09mi |
| 20001 Airway Blvd California City, CA | 3.0 | 2.0 | 1050 | $2,400 | $2.29 | 23d | 1 | 1.16mi |
| 20425 81st St California City, CA | 4.0 | 3.0 | 2215 | $2,900 | $1.31 | 19d | 1 | 1.19mi |
| 8160 Kalmia Ave California City, CA | 3.0 | 2.0 | 1277 | $1,795 | $1.41 | 23d | 1 | 1.20mi |
| 20300 Graham St California City, CA | 4.0 | 2.5 | 2016 | $2,150 | $1.07 | 23d | 1 | 1.22mi |
| 7733 Walpole Ave Unit A California City, CA | 3.0 | 2.0 | 1600 | $2,000 | $1.25 | 23d | 1 | 1.24mi |
| 9000 Underwood Ave California City, CA | 3.0 | 2.0 | 1540 | $1,900 | $1.23 | 23d | 1 | 1.35mi |
| 8512 Tamarack Ave California City, CA | 3.0 | 2.0 | 1502 | $1,875 | $1.25 | 23d | 1 | 1.38mi |
| 10193 Evelyn Ave California City, CA | 3.0 | 2.0 | 1616 | $2,150 | $1.33 | 14d | 1 | 1.46mi |
| 8312 Tamarack Ave California City, CA | 3.0 | 2.0 | 1539 | $1,900 | $1.23 | 23d | 1 | 1.47mi |
| 8449 Viburnum Ave California City, CA | 3.0 | 2.0 | 1218 | $1,695 | $1.39 | 2d | 1 | 1.49mi |
Listing history 50 events
-
2026-06-18pricedays on market $244,000 Active 104 DOM
-
2026-06-17days on market $245,000 Active 103 DOM
-
2026-06-16days on market $245,000 Active 102 DOM
-
2026-06-15statusdays on market $245,000 Active 101 DOM
-
2026-06-14statusdays on market $245,000 Pending 91 DOM
-
2026-06-13days on market $245,000 Active 100 DOM
-
2026-06-10days on market $245,000 Active 98 DOM
-
2026-06-09days on market $245,000 Active 97 DOM
-
2026-06-08days on market $245,000 Active 96 DOM
-
2026-06-07days on market $245,000 Active 95 DOM
-
2026-06-05days on market $245,000 Active 92 DOM
-
2026-06-03days on market $245,000 Active 91 DOM
-
2026-06-03days on market $245,000 Active 90 DOM
-
2026-06-01days on market $245,000 Active 89 DOM
-
2026-05-31days on market $245,000 Active 88 DOM
-
2026-03-04$245,000 Active 724-char remark
Show marketing remark (724 chars)
Beautiful 4-bedroom, 2-bathroom home offering 1,550 sq ft of comfortable living space. This well-maintained property is in good condition and features a functional floor plan with spacious bedrooms, a bright living area, and a welcoming atmosphere throughout. The kitchen offers ample cabinet space and flows nicely into the dining area, perfect for everyday living and entertaining. The primary bedroom provides privacy and comfort, while the additional bedrooms offer flexibility for family, guests, or a home office. The backyard offers great potential for outdoor enjoyment. Conveniently located near schools, shopping, and major commuter routes. A great opportunity to own a move-in ready home with plenty of potential!
-
2022-09-12soldstatus $199,000 Closed Sale
-
2022-09-12soldstatus $199,000
-
2022-09-02status Pending Sale
-
2022-08-01historical Active Under Contract
-
2022-07-26price $199,900
-
2022-07-25price $216,000
-
2022-07-25price $217,000
-
2022-07-23price $218,000
-
2022-07-21price $219,000
-
2022-07-19price $220,000
-
2022-07-18price $221,000
-
2022-07-17price $222,000
-
2022-07-16price $223,000
-
2022-07-13price $224,000
-
2022-07-11price $225,000
-
2022-07-08price $226,000
-
2022-07-08price $227,000
-
2022-07-05price $228,000
-
2022-07-01$229,000 Active
-
2022-06-30historical $229,000
-
2022-06-27soldstatus $160,000
-
2017-11-06soldstatus $113,000 Closed
-
2017-11-06soldstatus $113,000
-
2017-10-03status Pending
-
2017-09-07price $113,000
-
2017-07-27$115,000 Active
-
2015-03-16historical
-
2013-12-19soldstatus $42,500
-
2013-10-21$47,000
-
2013-06-30historical
-
2013-01-18$55,000
-
2013-01-18$55,000
-
2012-12-21soldstatus $24,000
ⓘ Source: listings_history table (triggers on properties + properties_extension) + one-shot
backfill from property_details.listing_events for pre-trigger history.
Tax reassessment forecast CA · Resets to sale price
- Current annual tax
- $2,687 · $224/mo
- Projected year-2 tax
- $2,687 · $224/mo
- Expected delta
- $0/yr ($0/mo · 0.0%)
ⓘ Screening estimate from a state-policy table — verify with the county assessor before closing.
Climate risk First Street
- Flood 1/10 Low FEMA zone X (unshaded) · 0% chance over 30 yrs
- Wildfire 1/10 Low
- Heat 8/10 Severe 6 d/yr ≥101°F today · 16 d/yr by 30 yrs out
- Wind 1/10 Low
- Air quality 7/10 Severe 13 unhealthy d/yr today · 17 by 30 yrs out
Nearby sold comps map
Loading sold comps map…
Walkable amenities ~0.75 mi
Loading nearby amenities…
Taxation est. · year 1
- Rental income
- $27,195
- − Mortgage interest
- −$13,668
- − Property taxes
- −$2,687
- − Insurance
- −$1,220
- − Repairs & maintenance
- −$2,176
- − Management
- −$2,176
- − Depreciation
- −$7,098
- Taxable loss
- −$1,830
- Est. tax savings @ 24.0%
- +$439
- After-tax cash flow
- $2,661/yr
For passive investors: Depreciation is non-cash, so a rental often shows a tax loss while cash-flowing — sheltering income. Rental losses are passive: they offset passive income freely, and up to $25,000/yr can offset ordinary (W-2) income if you actively participate and your MAGI is under $100k (phasing out to $0 by $150k); unused losses carry forward. On sale, claimed depreciation is recaptured at up to 25%, and gains may owe capital-gains tax (a 1031 exchange can defer both). Figures are a year-1 estimate at your 24.0% rate — not tax advice; consult a CPA.
Schools (NCES district)
- District
- Mojave Unified
- NCES district ID
- 0625230
- Math proficiency
- 25% ▲ 11.00%
- Reading proficiency
- 25% ▼ -1.00%
- Median HH income
- $43,017
- Composite
- 21.4/100
- National rank
- #8350
- State rank
- #411 of 517 in CA
Livability — California City
- Score
- 44/100
- State rank
- #1329
- US rank
- #26753
Category grades
Schools grade is shown separately in the Schools card above.
Census & demographics
- Census place
- California City, CA
- County
- Kern County · 710,371 people
- City population
- 14,353
- Metro
- Bakersfield, CA
- Population (ZIP)
- 14,353
- Household income
- $59,827
- Rent vs Own
- Severe rent burden
- 883.0
Population outlook (Kern County) Hauer SSP2
- Today (2025)
- 947,286 people
- By 2030
- 978,984 · +3.3%
- By 2040
- 1,045,018 · +10.3%
- By 2050
- 1,105,232 · +16.7%
- By 2075
- 1,229,538 · +29.8%
- By 2100
- 1,238,059 · +30.7%
Race, ethnicity, and origin ACS 2023
- Neighborhood character
- Highly diverse neighborhood (Simpson 0.70)
- Race & ethnicity
- Hispanic / Latino 40% White 30% Black 22% Two or more races 16% Native American 3% Asian 1%
- Hispanic origin (detail)
- Mexican 29%
- Common ancestry
- Italian 3% Lithuanian 1% Romanian 1%
- Foreign-born
- 13% · Canada, Dominican Republic
- Languages at home
- 68% English-only · Spanish 29%
Political lean MEDSL · Kern
- 2024 margin
- Strong R (+21.1) · D 38.2% · R 59.3% · Other 2.5%
- 2008→2024 swing
- -3.3pp toward R · 2008: -17.8pp · 2024: -21.1pp
- All cycles
- 2024: R+21.1 2020: R+10.2 2016: R+15.0 2012: R+20.9 2008: R+17.8
Not yet ingested
- Civics
- —
Market trends
- HPI YoY
- ▲ 46.32%
- Current HPI
- 402.4192
- Rent YoY
- ▲ 5.45%
- Metro
- Bakersfield, CA
- State GDP YoY
- ▲ 3.21%
- F500 in state
- 116
Industry mix (Fortune 500 HQ in CA)
| Industry | F500 HQs | Revenue |
|---|---|---|
| Technology | 27 | $1,492B |
|
||
| Financial Services | 3 | $174B |
|
||
| Retail | 3 | $44B |
|
||
| Insurance | 3 | $26B |
|
||
| Media / Entertainment | 2 | $115B |
|
||
| Pharmaceuticals / Biotech | 2 | $62B |
|
||
Price history
+122.7% since first listed37 events — show timeline
- 2026-03-04 Listed $245,000 CRMLS
- 2026-03-04 Listed $245,000 AVMLS
- 2022-09-12 Sold (Public Records) $199,000 Public Records
- 2022-09-12 Sold (MLS) $199,000 CRMLS
- 2022-09-02 Pending — CRMLS
- 2022-08-01 Contingent — CRMLS
- 2022-07-26 Price Changed $199,900 CRMLS
- 2022-07-25 Price Changed $216,000 CRMLS
- 2022-07-25 Price Changed $217,000 CRMLS
- 2022-07-23 Price Changed $218,000 CRMLS
- 2022-07-21 Price Changed $219,000 CRMLS
- 2022-07-19 Price Changed $220,000 CRMLS
- 2022-07-18 Price Changed $221,000 CRMLS
- 2022-07-17 Price Changed $222,000 CRMLS
- 2022-07-16 Price Changed $223,000 CRMLS
- 2022-07-13 Price Changed $224,000 CRMLS
- 2022-07-11 Price Changed $225,000 CRMLS
- 2022-07-08 Price Changed $226,000 CRMLS
- 2022-07-08 Price Changed $227,000 CRMLS
- 2022-07-05 Price Changed $228,000 CRMLS
- 2022-07-01 Listed $229,000 CRMLS
- 2022-06-30 Coming Soon $229,000 CRMLS
- 2022-06-27 Sold (Public Records) $160,000 Public Records
- 2017-11-06 Sold (Public Records) $113,000 Public Records
- 2017-11-06 Sold (MLS) $113,000 AVMLS
- 2017-10-03 Pending — AVMLS
- 2017-09-07 Price Changed $113,000 AVMLS
- 2017-07-27 Listed $115,000 AVMLS
- 2015-03-16 Listing Removed — AVMLS
- 2013-12-19 Sold (MLS) $42,500 AVMLS
- 2013-10-21 Listed $47,000 AVMLS
- 2013-06-30 Listing Removed — CRMLS
- 2013-01-18 Listed $55,000 AVMLS
- 2013-01-18 Listed $55,000 CRMLS
- 2012-12-21 Sold (MLS) $24,000 AVMLS
- 2012-11-19 Listed $24,900 AVMLS
- 2005-04-01 Sold (Public Records) $110,000 Public Records
Property tax history
+12.5%/yrLatest (2025): $2,687 · -5.2% YoY. Source: county tax records.
Cash-flow waterfall
monthlySold comps — $/sqft
last 12 mo · ≤1 miLoading sold comps…