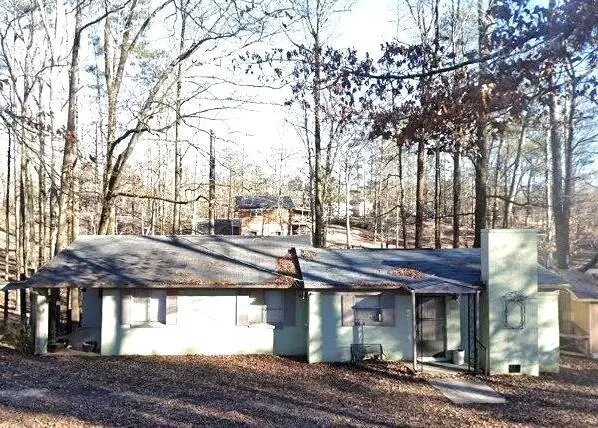
112 RD 1015 · Plantersville, MS
Flood risk 1/10 · Minimal
- FEMA flood zone
- X (unshaded)
- Chance of flooding over 30 yrs
- 0.0%
- Est. flood insurance / yr
- $507 – $1,088
Fire risk 4/10 · Minor
- Est. fire insurance / yr
- $1,241 – $2,305
Heat risk 6/10 · Moderate
- Hot days now (above 109°F)
- 7 days/yr
- Hot days in 30 yrs
- 19 days/yr
Wind risk 6/10 · Moderate
- Chance of severe wind over 30 yrs
- 27.0%
Air-quality risk 1/10 · Minimal
- Unhealthy air days now
- 0 days/yr
- Unhealthy air days in 30 yrs
- 0 days/yr
Risk factors via First Street. Map © Google.
Why this score? — see what drove the C+ grade
The composite is a weighted blend of 9 inputs, each scored 0–100. Each bar is that input's sub-score; the figure is the points it added to the 100-point composite (weight × sub-score).
- Cash flow +23.9/30.0
- ARV discount +14.0/15.0
- DSCR +7.7/10.0
- 1% rule +6.2/10.0
- Schools +3.0/10.0
- Livability +2.9/5.0
- Rent growth +2.5/5.0
- Condition / age +2.5/5.0
- Appreciation +0.0/10.0
$122,500
🖨 Deal sheet 📄 Offer letter ✓ Due diligence
Listing remarks
Investment opportunity in Lakewood Estates in Tupelo! This 2BR/2BA home is being sold AS IS and offers incredible potential. Situated on approximately 0.85 acre, the property features a huge shady yard and backs up to the lake, creating a beautiful setting with endless possibilities. With some work and vision, this property could make a great rental, flip, or personal retreat. Additional amenities include an outside storage shed and security cameras. Taxes are based on regular homestead.
Key facts
- Security cameras
- Backs up to the lake
- Huge shady yard
Tags
Property features AI
Finance
- HOA & community: Located in Lakewood Park Estates subdivision
Exterior
- Parking: Detached carport
- Home design: Single-family residential property
- Construction: Brick construction
- Exterior features: Shingle roof; Lot approximately 0.85 acres (102 x 217)
Interior
- Kitchen: Range; Dishwasher
- Bathrooms: 2 full bathrooms
- Heating & cooling: Central air conditioning
- Interior features: Range; Dishwasher; Crawl space basement
Neighborhood map
What this means for you Summary
Snapshot
- This is a 2-bed/1.0-bath single-family listed at $122k.
Deal economics
- At list price, monthly cash flow is $239 ($3k/yr) — positive.
- The deal already cash-flows at list — no discount required.
- Meets the 1% rule at list price ($1k rent vs $122k).
- Recommended offer: $119k (3.0% below list) — sets the bar for market timing.
Location & tenants
- Location reads 57/100 on livability (#287 in MS) — a working-class tenant base; expect higher turnover. Strengths: cost of living A+, housing A-, crime B; Watch: schools F, amenities F, commute F.
- Lee County School District (rural): math 37% / reading 35% proficiency, ranked #51 of 130 in MS (top 39%) — families likely to look elsewhere, expect single-tenant / working-renter base with shorter leases.
- Market conditions: 172 active listings in the ZIP; 154 units permitted in Lee County in 2024 (24 in 5+ unit buildings).
Forward outlook
- Local home prices are declining (-3.0%/yr); year-one equity from $847 of loan paydown is wiped out by about $4k of value loss. Plan a longer hold.
- Lee County population projected at +6% by 2050 — modest demand growth; plan on rents tracking national, not racing it.
Negotiation context
- It's been on market 43 days — a 3% lower offer ($119k) is reasonable based on typical stale-listing flexibility.
Risks & watch-outs
- Climate carrying-cost: major wind risk, 27% chance of damaging wind over 30y; extreme-heat days projected 7→19/yr by 2055 (HVAC capex compounding) — expect insurance premiums to compound above CPI over the hold.
Questions for the listing agent
- It's been on market 43 days. Have you received any prior offers? Is the seller open to a 3% concession, seller financing, or rate buy-down credit?
- Built in 1977 — when were the roof, HVAC, electrical panel, plumbing, and water heater last replaced?
- Is there a deadline driving the sale (1031 exchange, divorce, estate, relocation)? That informs how much negotiation room exists.
- Schools are F-rated, which usually means shorter tenancies and higher turnover. Who's the typical renter profile here, and what's been the actual vacancy rate?
- What's the average days-on-market for RENTAL listings here right now (not sales)? A rising rental-DOM trend means longer vacancies and softer asking-rent achievability than the comps imply.
- What's the recent tenant-quality profile in this submarket — average credit score on applications, eviction rate, late-payment / NSF rate, and stable-employment percentage? A property-management company in the area should have these aggregated.
- How much new for-sale + rental construction is in the pipeline within 1–3 miles? Heavy new supply typically softens prices + rents 12–24 months out; constrained supply supports both.
Investment metrics
- 1% rule
- 1.12% ✓
- Cap rate
- 8.63%
- Cash-on-cash
- 8.35%
- DSCR
- 1.37
- GRM
- 7.4
CMA / ARV
- ARV (median comp)
- $143,319
- List price
- $122,500
- Delta
- -14.53%
- Verdict
- UNDERPRICED
- Comps
- 2 within 1.0 mi
Projected returns pro-forma
-3.0% appreciation · 3.0% rent growth · sell at horizon
- IRR
- -3.6%
- Equity multiple
- 0.87×
- Total profit
- $-4,624
- Equity at exit
- $18,265
- IRR
- 6.1%
- Equity multiple
- 1.46×
- Total profit
- $15,637
- Equity at exit
- $10,592
Cash invested: $34,300 (down + closing). Projections, not guarantees.
Landlord ↔ Tenant lean methodology
- Overall (STATE)
- 90 Strongly Landlord-Friendly
- State Mississippi
- 90 Strongly Landlord-Friendly · R+11
- County
- — inherits STATE
- City
- — inherits STATE
ZIP-level market 38804
- Active inventory
- 172
- Price-to-rent
- 7.4×
Monthly cashflow live
- Estimated rent
- $1,374 medium interval (Pro) →
- Mortgage (P&I)
- −$642
- Tax est. 1.5%
- −$153 /mo · $1,838/yr
- Insurance
- −$51
- HOA
- −$0
- Vacancy / Maint / Mgmt
- −$289
- Net cashflow
- $239
Break-even live
UW: 25.0% down · 7.5% · 30yr · 1.5% tax · 5.0% vac · 8.0% maint · 8.0% mgmt
Financing live
Cash to close
- Down payment
- $30,625
- Closing costs
- $3,675
- Reserves months
- —
- Total cash needed
- —
Loan-product check · same deal, 3 products live
Conventional
25% down · 7.5% · 30yr
- Down + closing
- —
- Monthly P&I
- —
- Monthly cashflow
- —
- DSCR
- —
- Eligible?
- —
Personal DTI + credit; lowest rate.
DSCR
20% down · 8.5% · 30yr
- Down + closing
- —
- Monthly P&I
- —
- Monthly cashflow
- —
- DSCR
- —
- Eligible?
- —
No personal income docs; deal must DSCR.
Hard money
10% down · 12.0% · 12mo
- Down + closing
- —
- Monthly P&I
- —
- Monthly cashflow
- —
- DSCR
- —
- Eligible?
- —
Short-term bridge; refi at stabilization.
Listing history 6 events
-
2026-06-07statusdays on market $122,500 Pending 43 DOM
-
2026-06-02days on market $122,500 Active 40 DOM
-
2026-06-01days on market $122,500 Active 39 DOM
-
2026-05-31days on market $122,500 Active 38 DOM
-
2026-05-30days on market $122,500 Active 37 DOM
-
2026-04-22$122,500 Active 492-char remark
ⓘ Source: listings_history table (triggers on properties + properties_extension) + one-shot
backfill from property_details.listing_events for pre-trigger history.
Climate risk First Street
- Flood 1/10 Low FEMA zone X (unshaded) · 0% chance over 30 yrs
- Wildfire 4/10 Moderate
- Heat 6/10 Major 7 d/yr ≥109°F today · 19 d/yr by 30 yrs out
- Wind 6/10 Major 27% chance of damaging wind over 30 yrs
- Air quality 1/10 Low 0 unhealthy d/yr today · 0 by 30 yrs out
Nearby sold comps map
Loading sold comps map…
Walkable amenities ~0.75 mi
Loading nearby amenities…
Taxation est. · year 1
- Rental income
- $16,486
- − Mortgage interest
- −$6,862
- − Property taxes
- −$1,838
- − Insurance
- −$612
- − Repairs & maintenance
- −$1,319
- − Management
- −$1,319
- − Depreciation
- −$3,564
- Taxable income
- $972
- Est. tax owed @ 24.0%
- −$233
- After-tax cash flow
- $2,631/yr
For passive investors: Depreciation is non-cash, so a rental often shows a tax loss while cash-flowing — sheltering income. Rental losses are passive: they offset passive income freely, and up to $25,000/yr can offset ordinary (W-2) income if you actively participate and your MAGI is under $100k (phasing out to $0 by $150k); unused losses carry forward. On sale, claimed depreciation is recaptured at up to 25%, and gains may owe capital-gains tax (a 1031 exchange can defer both). Figures are a year-1 estimate at your 24.0% rate — not tax advice; consult a CPA.
Schools (NCES district)
- District
- Lee County School District
- NCES district ID
- 2802550
- Math proficiency
- 37% ▼ -11.00%
- Reading proficiency
- 35% ▼ -6.00%
- Median HH income
- $41,435
- Composite
- 30.38/100
- National rank
- #6253
- State rank
- #51 of 130 in MS
Livability — Plantersville
- Score
- 57/100
- State rank
- #287
- US rank
- #21871
Category grades
Schools grade is shown separately in the Schools card above.
Census & demographics
- County
- Lee County · 52,445 people
- Metro
- Tupelo, MS
- Population (ZIP)
- 16,693
- Household income
- $64,420
- Rent vs Own
- Severe rent burden
- 642.0
Population outlook (Lee County) Hauer SSP2
- Today (2025)
- 90,253 people
- By 2030
- 92,125 · +2.1%
- By 2040
- 94,914 · +5.2%
- By 2050
- 95,841 · +6.2%
- By 2075
- 94,189 · +4.4%
- By 2100
- 83,736 · -7.2%
Race, ethnicity, and origin ACS 2023
- Neighborhood character
- Majority White (63%)
- Race & ethnicity
- White 63% Black 30% Two or more races 3% Hispanic / Latino 3% Native American 1%
- Common ancestry
- Serbian 3% Slovak 2% Italian 2%
- Foreign-born
- 1%
- Languages at home
- 98% English-only · Spanish 1% Other Indo-European 1%
Political lean MEDSL · Lee
- 2024 margin
- Solid R (+38.8) · D 30.0% · R 68.9% · Other 1.1%
- 2008→2024 swing
- -8.3pp toward R · 2008: -30.5pp · 2024: -38.8pp
- All cycles
- 2024: R+38.8 2020: R+32.5 2016: R+37.7 2012: R+29.0 2008: R+30.5
Not yet ingested
- Civics
- —
Market trends
- HPI YoY
- ▼ -111.19%
- Current HPI
- 172.0153
- Rent YoY
- —
- Metro
- Tupelo, MS
- State GDP YoY
- —
- F500 in state
- 0
Price history
2 events — show timeline
- 2026-06-05 Pending — NEMSBD
- 2026-04-22 Listed $122,500 NEMSBD
Cash-flow waterfall
monthlySold comps — $/sqft
last 12 mo · ≤1 miLoading sold comps…