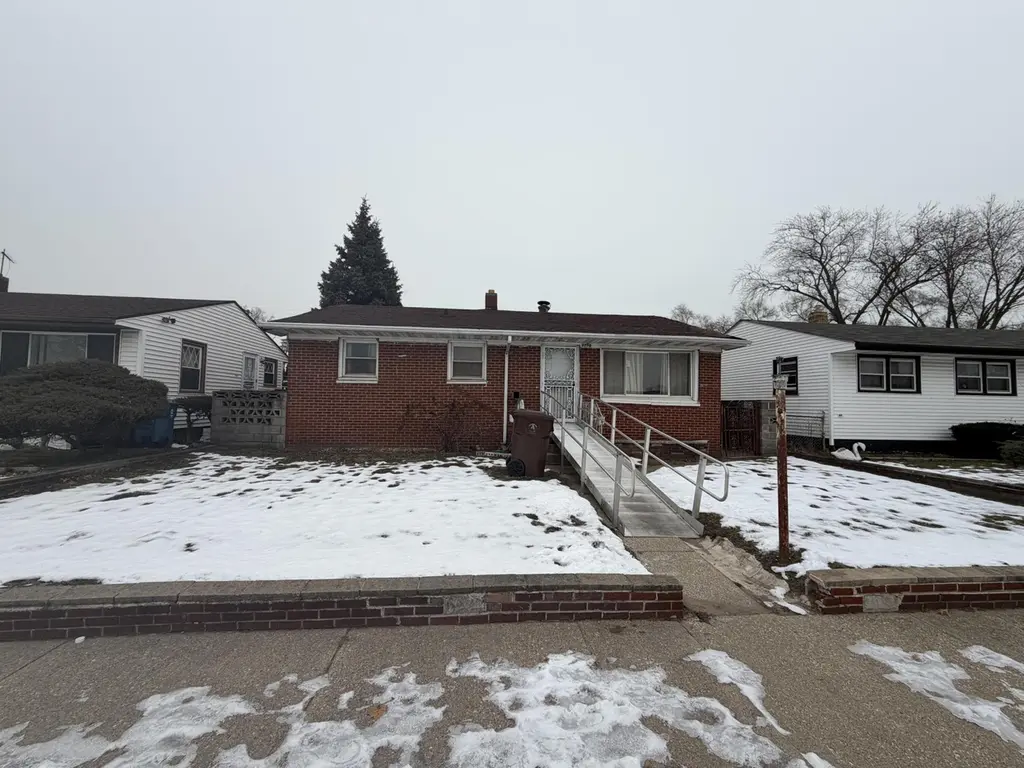
3756 W 21st Ave · Gary, IN
Flood risk 1/10 · Minimal
- FEMA flood zone
- X (unshaded)
- Chance of flooding over 30 yrs
- 0.0%
- Est. flood insurance / yr
- $473 – $860
Fire risk 1/10 · Minimal
- Est. fire insurance / yr
- $717 – $1,331
Heat risk 3/10 · Minor
- Hot days now (above 102°F)
- 7 days/yr
- Hot days in 30 yrs
- 15 days/yr
Wind risk 2/10 · Minimal
- Chance of severe wind over 30 yrs
- 0.0%
Air-quality risk 4/10 · Minor
- Unhealthy air days now
- 5 days/yr
- Unhealthy air days in 30 yrs
- 6 days/yr
Risk factors via First Street. Map © Google.
Why this score? — see what drove the B+ grade
The composite is a weighted blend of 9 inputs, each scored 0–100. Each bar is that input's sub-score; the figure is the points it added to the 100-point composite (weight × sub-score).
- Cash flow +30.0/30.0
- ARV discount +15.0/15.0
- 1% rule +10.0/10.0
- DSCR +10.0/10.0
- Rent growth +5.0/5.0
- Livability +3.7/5.0
- Condition / age +2.5/5.0
- Schools +0.5/10.0
- Appreciation +0.0/10.0
$89,900
🖨 Deal sheet (PDF) 📄 Offer letter ✓ Due diligence
Listing remarks MLS
BRICK RANCH FEATURES THREE BEDROOMS, ONE BATH, TWO CAR DETACHED GARAGE. SELLER HAS NEVER LIVED IN PROPERTY. SOLD AS IS.
Key facts
- 6,098 sq ft lot
- Garage
- Built 1959
Property features AI
Finance
- Other: Lot size source: Owner
- Financial info: Occupant type: Tenant
- HOA & community: HOA/community details not provided
Exterior
- Parking: Attached or detached garage with 1 garage space
- Security: Security details not provided
- Utilities: Public water; Other sewer
- Home design: One-story home; Built in 1959
- Construction: Brick construction; Asphalt roof; Full basement foundation
- Exterior features: Neighborhood view; Other exterior features
Interior
- Kitchen: No appliances included
- Bedrooms: Primary bedroom; Two additional bedrooms
- Flooring: Hardwood floors
- Bathrooms: 1 full bathroom
- Heating & cooling: Forced air heating (natural gas); Central air conditioning
- Interior features: Gas-log fireplace (1); Full basement; Other interior features
- Laundry & utility: Laundry/utility details not provided
Neighborhood map
What this means for you Summary
Snapshot
- This is a 3-bed/1.0-bath single-family listed at $90k.
Deal economics
- At list price, monthly cash flow is $458 ($6k/yr) — positive.
- The deal already cash-flows at list — no discount required.
- Meets the 1% rule at list price ($1k rent vs $90k).
- Recommended offer: $87k (3.0% below list) — sets the bar for market timing.
- Cap rate 12.4% vs local median 9.1% in Gary — top-decile yield for the area; either an underpriced asset or a hidden risk that comps aren't pricing in. Stress-test before assuming the spread holds.
Location & tenants
- Location reads 73/100 on livability (#105 in IN) — a middle-class / working-renter tenant base. Strengths: commute A+, cost of living A+, housing A+; Watch: schools F, crime F, employment F.
- Gary Community School Corporation (urban): math 3% / reading 11% proficiency, ranked #299 of 301 in IN (top 99%) — low school quality limits family demand, transient renter base, plan for 1-2y turnover; 80% free/reduced lunch — lower-income household profile, screen leases tightly.
- Market conditions: Rents rising fast (+11.6%/yr); 68 active listings in the ZIP; 15 comparable units currently listed for rent nearby; rentals leasing fast (median 0d on market — plan ~1-2 weeks tenant-placement turnaround); lower-income renter base — watch delinquency; 1,642 units permitted in Lake County in 2024 (14 in 5+ unit buildings).
- This rent runs 40% of the median local income ($42k/yr) — at the standard rent-burdened threshold; future hikes will face affordability resistance.
Forward outlook
- Local home prices are declining (-3.0%/yr); year-one equity from $622 of loan paydown is wiped out by about $3k of value loss. Plan a longer hold.
- Lake County population projected to shrink 7% by 2050 — rents likely to lag national; underwrite the cash flow, not the appreciation.
- At projected returns (-3.0% appreciation + 8.0% rent growth), your $25k cash investment doubles in ~5 years — after that, you're playing with house money.
Negotiation context
- It's been on market 40 days — a 3% lower offer ($87k) is reasonable based on typical stale-listing flexibility.
- 5 sale attempts since 15y ago; this cycle's ask has dropped $5k (5%) from the opening price — seller is motivated, your offer sets the floor, not the list.
- Current owner paid $17k; list at $90k implies a 429% gain — meaningful room to come down on a strong offer.
Risks & watch-outs
- Watch-outs: built in 1959 — expect roof / HVAC / electrical / plumbing capex.
Questions for the listing agent
- It's been on market 40 days. Have you received any prior offers? Is the seller open to a 3% concession, seller financing, or rate buy-down credit?
- Built in 1959 — when were the roof, HVAC, electrical panel, plumbing, and water heater last replaced?
- Is there a deadline driving the sale (1031 exchange, divorce, estate, relocation)? That informs how much negotiation room exists.
- Schools are F-rated, which usually means shorter tenancies and higher turnover. Who's the typical renter profile here, and what's been the actual vacancy rate?
- Crime grade is F in this area — have there been break-ins, vandalism, or insurance claims at this property in the last 3 years? What carrier currently insures it and at what premium?
- What's the average days-on-market for RENTAL listings here right now (not sales)? A rising rental-DOM trend means longer vacancies and softer asking-rent achievability than the comps imply.
- What's the recent tenant-quality profile in this submarket — average credit score on applications, eviction rate, late-payment / NSF rate, and stable-employment percentage? A property-management company in the area should have these aggregated.
- How much new for-sale + rental construction is in the pipeline within 1–3 miles? Heavy new supply typically softens prices + rents 12–24 months out; constrained supply supports both.
Investment metrics
- 1% rule
- 1.58% ✓
- Cap rate
- 12.41%
- Cash-on-cash
- 21.86%
- DSCR
- 1.97
- GRM
- 5.3
CMA / ARV
- ARV (median comp)
- $111,599
- List price
- $89,900
- Delta
- -19.44%
- Verdict
- UNDERPRICED
- Comps
- 20 within 1.0 mi
Show comp detail 12 sales within ~0.75 mi
| Address | Dist | Beds/Ba | Sqft | Sold | Price | $/sf | Match |
|---|---|---|---|---|---|---|---|
| 4233 W 22nd Ave | 0.30mi | 3/1.0 | 850 (-2%) | 6mo | $82,000 | $96 | 78 |
| 3902 W 21st Ave | 0.06mi | 3/1.0 | 925 (+7%) | 9mo | $126,000 | $136 | 78 |
| 4082 W 21st Pl | 0.18mi | 3/1.0 | 941 (+9%) | 1mo | $129,900 | $138 | 76 |
| 4144 W 23rd Ave | 0.33mi | 3/1.5 | 900 (+4%) | 1mo | $80,000 | $89 | 74 |
| 1945 Lane St | 0.25mi | 3/1.0 | 925 (+7%) | 4mo | $50,000 | $54 | 73 |
| 4241 W 22nd Plz | 0.36mi | 3/1.0 | 925 (+7%) | 8mo | $63,000 | $68 | 65 |
| 4251 W 20th Pl | 0.31mi | 3/1.0 | 950 (+10%) | 9mo | $100,000 | $105 | 62 |
| 4123 W 19th Pl | 0.27mi | 3/1.0 | 981 (+14%) | 5mo | $75,000 | $76 | 60 |
| 4309 W 19th Ave | 0.39mi | 4/1.0 (+1) | 973 (+13%) | 2mo | $105,000 | $108 | 54 |
| 1570 Hendricks St | 0.43mi | 2/1.0 (-1) | 962 (+11%) | 5mo | $132,000 | $137 | 52 |
| 1548 Taney St | 0.70mi | 2/1.0 (-1) | 916 (+6%) | 2mo | $40,000 | $44 | 51 |
| 4216 W 19th Plz | 0.30mi | 4/1.0 (+1) | 985 (+14%) | 9mo | $130,000 | $132 | 50 |
Match score weights: distance 35% · size 25% · config 20% · recency 20%. Top-matched comps best support the ARV.
Projected returns pro-forma
-3.0% appreciation · 8.0% rent growth · sell at horizon
- IRR
- 20.3%
- Equity multiple
- 1.88×
- Total profit
- $22,160
- Equity at exit
- $13,404
- IRR
- 31.8%
- Equity multiple
- 4.62×
- Total profit
- $91,140
- Equity at exit
- $7,773
Cash invested: $25,172 (down + closing). Projections, not guarantees.
Landlord ↔ Tenant lean methodology
- Overall (STATE)
- 90 Strongly Landlord-Friendly
- State Indiana
- 90 Strongly Landlord-Friendly · R+11
- County
- — inherits STATE
- City
- — inherits STATE
ZIP-level market 46404
- Home prices YoY
- -4.8%
- Rents YoY
- 11.6%
- Active inventory
- 68
- Price-to-rent
- 5.3×
Monthly cashflow live
- Estimated rent
- $1,416 high interval (Pro) →
- Mortgage (P&I)
- −$471
- Tax from tax record
- −$151 /mo · $1,816/yr
- Insurance
- −$37
- HOA
- −$0
- Vacancy / Maint / Mgmt
- −$297
- Net cashflow
- $458
Break-even live
Sensitivity live
| Price | -10% $509 | -5% $484 | +0% $458 | +5% $433 | +10% $408 |
|---|---|---|---|---|---|
| Rent | -10% $347 | -5% $403 | +0% $458 | +5% $514 | +10% $570 |
| Rate | -1.0pp $504 | -0.5pp $481 | base $458 | +0.5pp $435 | +1.0pp $411 |
UW: 25.0% down · 7.5% · 30yr · 1.5% tax · 5.0% vac · 8.0% maint · 8.0% mgmt
Financing live
Cash to close
- Down payment
- $22,475
- Closing costs
- $2,697
- Reserves months
- —
- Total cash needed
- —
Loan-product check · same deal, 3 products live
Conventional
25% down · 7.5% · 30yr
- Down + closing
- —
- Monthly P&I
- —
- Monthly cashflow
- —
- DSCR
- —
- Eligible?
- —
Personal DTI + credit; lowest rate.
DSCR
20% down · 8.5% · 30yr
- Down + closing
- —
- Monthly P&I
- —
- Monthly cashflow
- —
- DSCR
- —
- Eligible?
- —
No personal income docs; deal must DSCR.
Hard money
10% down · 12.0% · 12mo
- Down + closing
- —
- Monthly P&I
- —
- Monthly cashflow
- —
- DSCR
- —
- Eligible?
- —
Short-term bridge; refi at stabilization.
Rent comps 15 comps
| Address | Beds | Baths | Sqft | Rent | $/sqft | DOM | Units | Dist |
|---|---|---|---|---|---|---|---|---|
| 4061 W 20th Pl Gary, IN | 3.0 | 1.0 | 925 | $1,450 | $1.57 | 0d | 1 | 0.15mi |
| 4134 W 22nd Pl Gary, IN | 3.0 | 1.0 | 825 | $1,395 | $1.69 | 0d | 1 | 0.27mi |
| 4232 W 20th Ave Gary, IN | 4.0 | 1.0 | 925 | $1,395 | $1.51 | 22d | 1 | 0.32mi |
| 4263 W 22nd Pl Gary, IN | 4.0 | 1.0 | 950 | $1,295 | $1.36 | 0d | 1 | 0.37mi |
| 4300 W 22nd Pl Gary, IN | 3.0 | 1.0 | 977 | $1,395 | $1.43 | 3d | 1 | 0.40mi |
| 4328 W 22nd Plz Gary, IN | 3.0 | 1.0 | 950 | $1,300 | $1.37 | 4d | 1 | 0.43mi |
| 1531 Taney Pl Gary, IN | 2.0 | 1.0 | 900 | $1,045 | $1.16 | 2d | 1 | 0.67mi |
| 1595 Ellsworth St Unit 1 Gary, IN | 2.0 | 1.0 | 868 | $1,100 | $1.27 | 0d | 1 | 0.90mi |
| 1595 Ellsworth St Gary, IN | 2.0 | 1.0 | 868 | $1,100 | $1.27 | 3d | 1 | 0.90mi |
| 2264 Taft St Gary, IN | 2.0 | 1.0 | 800 | $1,275 | $1.59 | 0d | 1 | 0.96mi |
| 2939 W 10th Ave Gary, IN | 2.0 | 1.0 | 744 | $1,190 | $1.60 | 0d | 1 | 0.97mi |
| 2280 Roosevelt Pl Gary, IN | 3.0 | 1.0 | 864 | $1,560 | $1.81 | 0d | 1 | 1.02mi |
| 1043 Mount St Gary, IN | 3.0 | 1.0 | 750 | $1,200 | $1.60 | 0d | 1 | 1.09mi |
| 2602 W 6th Ave Gary, IN | 2.0 | 1.0 | 750 | $990 | $1.32 | 0d | 1 | 1.42mi |
| 743 Hanley St Gary, IN | 3.0 | 1.0 | 800 | $1,350 | $1.69 | 0d | 1 | 1.45mi |
Listing history 11 events
-
2026-06-01days on market $89,900 Active 40 DOM
-
2026-05-31days on market $89,900 Active 39 DOM
-
2026-04-22$95,000 Active 401-char remark
-
2026-01-10historical
-
2025-12-17$90,000 Active
-
2017-01-03soldstatus $17,000
Show marketing remark (119 chars)
BRICK RANCH FEATURES THREE BEDROOMS, ONE BATH, TWO CAR DETACHED GARAGE. SELLER HAS NEVER LIVED IN PROPERTY. SOLD AS IS.
-
2016-12-11$19,900
Show marketing remark (119 chars)
BRICK RANCH FEATURES THREE BEDROOMS, ONE BATH, TWO CAR DETACHED GARAGE. SELLER HAS NEVER LIVED IN PROPERTY. SOLD AS IS.
-
2012-11-29soldstatus $16,000
-
2012-03-23$19,000
-
2012-03-16historical
-
2011-03-15$24,500
ⓘ Source: listings_history table (triggers on properties + properties_extension) + one-shot
backfill from property_details.listing_events for pre-trigger history.
Tax reassessment forecast IN · Partial reset (capped growth)
- Current annual tax
- $1,816 · $151/mo
- Projected year-2 tax
- $1,816 · $151/mo
- Expected delta
- $0/yr ($0/mo · 0.0%)
ⓘ Screening estimate from a state-policy table — verify with the county assessor before closing.
Climate risk First Street
- Flood 1/10 Low FEMA zone X (unshaded) · 0% chance over 30 yrs
- Wildfire 1/10 Low
- Heat 3/10 Moderate 7 d/yr ≥102°F today · 15 d/yr by 30 yrs out
- Wind 2/10 Low 0% chance of damaging wind over 30 yrs
- Air quality 4/10 Moderate 5 unhealthy d/yr today · 6 by 30 yrs out
Nearby sold comps map
Loading sold comps map…
Walkable amenities ~0.75 mi
Loading nearby amenities…
Taxation est. · year 1
- Rental income
- $16,993
- − Mortgage interest
- −$5,036
- − Property taxes
- −$1,816
- − Insurance
- −$450
- − Repairs & maintenance
- −$1,359
- − Management
- −$1,359
- − Depreciation
- −$2,615
- Taxable income
- $4,357
- Est. tax owed @ 24.0%
- −$1,046
- After-tax cash flow
- $4,456/yr
For passive investors: Depreciation is non-cash, so a rental often shows a tax loss while cash-flowing — sheltering income. Rental losses are passive: they offset passive income freely, and up to $25,000/yr can offset ordinary (W-2) income if you actively participate and your MAGI is under $100k (phasing out to $0 by $150k); unused losses carry forward. On sale, claimed depreciation is recaptured at up to 25%, and gains may owe capital-gains tax (a 1031 exchange can defer both). Figures are a year-1 estimate at your 24.0% rate — not tax advice; consult a CPA.
Schools (NCES district)
- District
- Gary Community School Corporation
- NCES district ID
- 1803870
- Math proficiency
- 3% ▼ -10.00%
- Reading proficiency
- 11% ▼ -6.00%
- Median HH income
- $27,739
- Composite
- 4.98/100
- National rank
- #10039
- State rank
- #299 of 301 in IN
Livability — Gary
- Score
- 73/100
- State rank
- #105
- US rank
- #5592
Category grades
Schools grade is shown separately in the Schools card above.
Census & demographics
- Census place
- Gary, IN
- County
- Lake County · 422,878 people
- City population
- 63,701
- Metro
- Chicago-Naperville-Elgin, IL-IN-WI
- Population (ZIP)
- 15,428
- Household income
- $42,256
- Rent vs Own
- Severe rent burden
- 800.0
Population outlook (Lake County) Hauer SSP2
- Today (2025)
- 484,026 people
- By 2030
- 478,091 · -1.2%
- By 2040
- 462,974 · -4.3%
- By 2050
- 449,894 · -7.1%
- By 2075
- 436,169 · -9.9%
- By 2100
- 426,607 · -11.9%
Race, ethnicity, and origin ACS 2023
- Neighborhood character
- Predominantly Black (90%)
- Race & ethnicity
- Black 90% Two or more races 5% Hispanic / Latino 5% White 1%
- Foreign-born
- 1% · Canada
- Languages at home
- 99% English-only · Spanish 1%
Political lean MEDSL · Lake
- 2024 margin
- Lean D (+5.6) · D 52.1% · R 46.5% · Other 1.5%
- 2008→2024 swing
- -28.6pp toward R · 2008: 34.3pp · 2024: 5.6pp
- All cycles
- 2024: D+5.6 2020: D+15.1 2016: D+20.6 2012: D+31.0 2008: D+34.3
Not yet ingested
- Civics
- —
Market trends
- HPI YoY
- ▼ -12.76%
- Current HPI
- 252.6463
- Rent YoY
- ▲ 11.62%
- Metro
- Chicago-Naperville-Elgin, IL-IN-WI
- State GDP YoY
- ▲ 2.90%
- F500 in state
- 18
Industry mix (Fortune 500 HQ in IN)
| Industry | F500 HQs | Revenue |
|---|---|---|
| Industrial Machinery | 2 | $37B |
|
||
| Healthcare | 1 | $177B |
|
||
| Pharmaceuticals | 1 | $45B |
|
||
| Metals / Steel | 1 | $18B |
|
||
| Agriculture | 1 | $17B |
|
||
| Packaging | 1 | $12B |
|
||
Price history
+266.9% since first listed11 events — show timeline
- 2026-06-02 Listing Removed — NIRA MLS as Distributed by MLS Grid
- 2026-05-28 Price Changed $89,900 NIRA MLS as Distributed by MLS Grid
- 2026-04-22 Listed $95,000 NIRA MLS as Distributed by MLS Grid
- 2026-01-10 Listing Removed — NIRA MLS as Distributed by MLS Grid
- 2025-12-17 Listed $90,000 NIRA MLS as Distributed by MLS Grid
- 2017-01-03 Sold (MLS) $17,000 NIRA MLS as Distributed by MLS Grid
- 2016-12-11 Listed $19,900 NIRA MLS as Distributed by MLS Grid
- 2012-11-29 Sold (MLS) $16,000 NIRA MLS as Distributed by MLS Grid
- 2012-03-23 Listed $19,000 NIRA MLS as Distributed by MLS Grid
- 2012-03-16 Listing Removed — NIRA MLS as Distributed by MLS Grid
- 2011-03-15 Listed $24,500 NIRA MLS as Distributed by MLS Grid
Property tax history
+5.1%/yrLatest (2024): $1,816 · +5.4% YoY. Source: county tax records.
Cash-flow waterfall
monthlySold comps — $/sqft
last 12 mo · ≤1 miLoading sold comps…