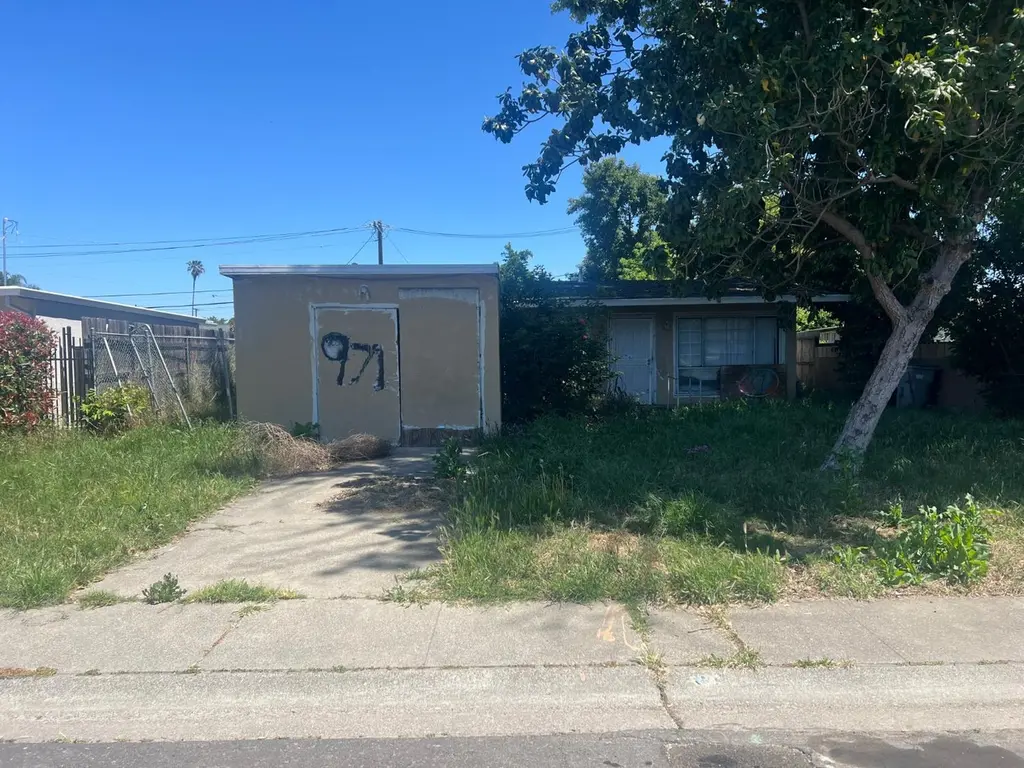
971 Beardsley Dr · West Sacramento, CA
Flood risk 3/10 · Minor
- FEMA flood zone
- —
- Chance of flooding over 30 yrs
- 0.12%
- Est. flood insurance / yr
- —
Fire risk 3/10 · Minor
- Est. fire insurance / yr
- $659 – $1,223
Heat risk 7/10 · Major
- Hot days now (above 103°F)
- 7 days/yr
- Hot days in 30 yrs
- 15 days/yr
Wind risk 1/10 · Minimal
- Chance of severe wind over 30 yrs
- —
Air-quality risk 10/10 · Severe
- Unhealthy air days now
- 27 days/yr
- Unhealthy air days in 30 yrs
- 33 days/yr
Risk factors via First Street. Map © Google.
Why this score? — see what drove the B- grade
The composite is a weighted blend of 9 inputs, each scored 0–100. Each bar is that input's sub-score; the figure is the points it added to the 100-point composite (weight × sub-score).
- Cash flow +30.0/30.0
- DSCR +10.0/10.0
- 1% rule +8.8/10.0
- ARV discount +7.5/15.0
- Schools +3.8/10.0
- Livability +3.7/5.0
- Condition / age +2.5/5.0
- Rent growth +1.9/5.0
- Appreciation +0.0/10.0
$200,000
🖨 Deal sheet 📄 Offer letter ✓ Due diligence
Listing remarks
CASH OFFERS ONLY. AS IS SALE!! High investor friendly.
Key facts
- 5,227 sq ft lot
- Garage
- Built 1954
Property features AI
Finance
- Other: Property located at 971 Beardsley Dr, West Sacramento, CA 95605; Directions provided: Head south on 5th St, turn left onto C St (becomes Sacramento Ave), turn right onto Douglas St, turn right onto Elkhorn Plaza, then turn left onto Beardsley Dr.
- HOA & community: No homeowners association; Not a senior community
Exterior
- Parking: 1-car garage; Garage faces front
- Utilities: Water: Public; Irrigation: Public District (with additional remarks); Sewer: See remarks / Other; Electric: See remarks / Other; Utilities: See remarks / Other; No private pool or spa
- Home design: Detached single-family residence; Residential property; Built in 1954
- Construction: Year built: 1954
- Exterior features: Roof described as 'See Remarks / Other'; Lot features described as 'See Remarks / Other'; Lot size approximately 0.12 acres
Interior
- Kitchen: Kitchen counter described as 'Other Counter'
- Bedrooms: 3 bedrooms (located on the main level)
- Flooring: Flooring described as 'See Remarks / Other'
- Bathrooms: 1 full bathroom; Other bathroom features (see remarks)
- Heating & cooling: Heating described as 'See Remarks / Other'; Cooling described as 'See Remarks / Other'
- Interior features: Single-story layout; Living room with unspecified 'Other' feature; Dining room with unspecified 'Other' feature; Kitchen with alternative counter type; Main level includes bedrooms, family room, full bath(s), kitchen and street entrance
- Laundry & utility: Laundry features listed as 'See Remarks / Other'
Neighborhood map
What this means for you Summary
Snapshot
- This is a 3-bed/1.0-bath single-family listed at $200k.
Deal economics
- At list price, monthly cash flow is $1k ($12k/yr) — positive.
- The deal already cash-flows at list — no discount required.
- Meets the 1% rule at list price ($3k rent vs $200k).
- Recommended offer: $197k (1.5% below list) — sets the bar for market timing.
Location & tenants
- Location reads 73/100 on livability (#164 in CA) — a middle-class / working-renter tenant base. Strengths: housing A+, commute A, employment A-; Watch: cost of living F.
- Washington Unified (suburban): math 30% / reading 57% proficiency, ranked #197 of 517 in CA (top 38%) — families likely to look elsewhere, expect single-tenant / working-renter base with shorter leases.
- Market conditions: Rents soft (-2.4%/yr); 52 active listings in the ZIP; 23 comparable units currently listed for rent nearby; rentals leasing fast (median 5d on market — plan ~1-2 weeks tenant-placement turnaround); 721 units permitted in Yolo County in 2024 (260 in 5+ unit buildings).
- At $2,751/mo this rent would consume 46% of the median local household income ($72k/yr) (locally 554% of renters already pay >50% of income on rent) — very limited rent-growth headroom before tenants either downsize or default.
Forward outlook
- Local home prices are declining (-3.0%/yr); year-one equity from $1k of loan paydown is wiped out by about $6k of value loss. Plan a longer hold.
- Yolo County population projected at +31% by 2050 — long-run rental-demand tailwind backs the buy-and-hold thesis.
- At projected returns (-3.0% appreciation + 0.0% rent growth), your $56k cash investment doubles in ~7 years — after that, you're playing with house money.
Negotiation context
- It's been on market 24 days — a 2% lower offer ($197k) is reasonable based on typical stale-listing flexibility.
Risks & watch-outs
- Watch-outs: built in 1954 — expect roof / HVAC / electrical / plumbing capex.
- Climate carrying-cost: extreme-heat days projected 7→15/yr by 2055 (HVAC capex compounding) — expect insurance premiums to compound above CPI over the hold.
Questions for the listing agent
- Built in 1954 — when were the roof, HVAC, electrical panel, plumbing, and water heater last replaced?
- Is there a deadline driving the sale (1031 exchange, divorce, estate, relocation)? That informs how much negotiation room exists.
- What's the average days-on-market for RENTAL listings here right now (not sales)? A rising rental-DOM trend means longer vacancies and softer asking-rent achievability than the comps imply.
- What's the recent tenant-quality profile in this submarket — average credit score on applications, eviction rate, late-payment / NSF rate, and stable-employment percentage? A property-management company in the area should have these aggregated.
- How much new for-sale + rental construction is in the pipeline within 1–3 miles? Heavy new supply typically softens prices + rents 12–24 months out; constrained supply supports both.
Investment metrics
- 1% rule
- 1.38% ✓
- Cap rate
- 12.32%
- Cash-on-cash
- 21.53%
- DSCR
- 1.96
- GRM
- 6.1
CMA / ARV
No comps found within radius.
Projected returns pro-forma
-3.0% appreciation · 0.0% rent growth · sell at horizon
- IRR
- 10.9%
- Equity multiple
- 1.42×
- Total profit
- $23,443
- Equity at exit
- $29,821
- IRR
- 17.6%
- Equity multiple
- 2.27×
- Total profit
- $71,307
- Equity at exit
- $17,292
Cash invested: $56,000 (down + closing). Projections, not guarantees.
Landlord ↔ Tenant lean methodology
- Overall (STATE)
- 18 Strongly Tenant-Friendly
- State California
- 18 Strongly Tenant-Friendly · D+13
- County
- — inherits STATE
- City
- — inherits STATE
ZIP-level market 95605
- Rents YoY
- -2.4%
- Active inventory
- 52
- Price-to-rent
- 6.1×
Monthly cashflow live
- Estimated rent
- $2,751 high interval (Pro) →
- Mortgage (P&I)
- −$1,049
- Tax from tax record
- −$36 /mo · $433/yr
- Insurance
- −$83
- HOA
- −$0
- Vacancy / Maint / Mgmt
- −$578
- Net cashflow
- $1,005
Break-even live
UW: 25.0% down · 7.5% · 30yr · 1.5% tax · 5.0% vac · 8.0% maint · 8.0% mgmt
Financing live
Cash to close
- Down payment
- $50,000
- Closing costs
- $6,000
- Reserves months
- —
- Total cash needed
- —
Loan-product check · same deal, 3 products live
Conventional
25% down · 7.5% · 30yr
- Down + closing
- —
- Monthly P&I
- —
- Monthly cashflow
- —
- DSCR
- —
- Eligible?
- —
Personal DTI + credit; lowest rate.
DSCR
20% down · 8.5% · 30yr
- Down + closing
- —
- Monthly P&I
- —
- Monthly cashflow
- —
- DSCR
- —
- Eligible?
- —
No personal income docs; deal must DSCR.
Hard money
10% down · 12.0% · 12mo
- Down + closing
- —
- Monthly P&I
- —
- Monthly cashflow
- —
- DSCR
- —
- Eligible?
- —
Short-term bridge; refi at stabilization.
Rent comps 23 comps
| Address | Beds | Baths | Sqft | Rent | $/sqft | DOM | Units | Dist |
|---|---|---|---|---|---|---|---|---|
| 777 5th St West Sacramento, CA | 2.0 | 1.0–2.0 | 878 | $10,000 | $11.38 | 2d | 15 | 0.55mi |
| 500 Douglas St West Sacramento, CA | 3.0 | 1.0–2.0 | 874 | $2,939 | $3.36 | 3d | 22 | 0.57mi |
| 1451 3rd St Sacramento, CA | 3.0 | 1.0–2.5 | 1044 | $3,300 | $3.16 | 4d | 1 | 1.14mi |
| 2227 River Plaza Dr Sacramento, CA | 1.0–2.0 | 1.0–2.0 | 890 | $2,220 | $2.49 | 2d | 19 | 1.20mi |
| 321 Bercut Dr Sacramento, CA | 2.0 | 1.0–2.0 | 575 | $1,980 | $3.44 | 2d | 18 | 1.21mi |
| 709 Solano St West Sacramento, CA | 4.0 | 3.0 | 1500 | $3,000 | $2.00 | 2d | 1 | 1.25mi |
| 500 N St Sacramento, CA | 2.0 | 2.0 | 1261 | $2,725 | $2.16 | 24d | 2 | 1.26mi |
| 500 N St Sacramento, CA | 2.0 | 2.0 | 1261 | $2,572 | $2.04 | 44d | 3 | 1.26mi |
| 500 N St Sacramento, CA | 2.0 | 2.0 | 1261 | $2,725 | $2.16 | 15d | 2 | 1.26mi |
| 1421 5th St Sacramento, CA | 2.0 | 1.0–2.0 | 1040 | $4,171 | $4.01 | 2d | 45 | 1.27mi |
| 251 6th St Sacramento, CA | 1.0–2.0 | 1.0–2.0 | 891 | $3,770 | $4.23 | 2d | 10 | 1.29mi |
| 1900 3rd St Sacramento, CA | 2.0 | 2.0 | 921 | $3,779 | $4.10 | 2d | 1 | 1.31mi |
| 1900 3rd St Sacramento, CA | 2.0 | 1.0–2.0 | 687 | $2,999 | $4.36 | 44d | 1 | 1.31mi |
| 1500 7th St Sacramento, CA | 2.0 | 1.0–2.0 | 833 | $3,038 | $3.64 | 3d | 29 | 1.32mi |
| 2361 Oak Harbour Dr Sacramento, CA | 2.0 | 2.0 | 875 | $1,780 | $2.03 | 8d | 1 | 1.35mi |
| 2361 Oak Harbour Dr Sacramento, CA | 2.0 | 2.0 | 875 | $1,825 | $2.09 | 12d | 1 | 1.35mi |
| 2361 Oak Harbour Dr Sacramento, CA | 2.0 | 2.0 | 875 | $1,835 | $2.10 | 20d | 1 | 1.35mi |
| 321 T St Sacramento, CA | 2.0 | 1.0 | 800 | $1,800 | $2.25 | 8d | 3 | 1.37mi |
| 800 J St Sacramento, CA | 2.0 | 1.0–2.0 | 954 | $2,884 | $3.02 | 2d | 15 | 1.39mi |
| 317 U St Unit 2 Sacramento, CA | 2.0 | 1.5 | 975 | $1,895 | $1.94 | 8d | 1 | 1.41mi |
| 2763 River Plaza Dr Sacramento, CA | 1.0–3.0 | 1.0–2.0 | 848 | $2,400 | $2.83 | 2d | 8 | 1.42mi |
| 508 S St Unit 200 Sacramento, CA | 2.0 | 2.0 | 1450 | $3,150 | $2.17 | 24d | 1 | 1.43mi |
| 313 W St Unit 313 Sacramento, CA | 3.0 | 2.0 | 1200 | $2,595 | $2.16 | 4d | 1 | 1.50mi |
Listing history 9 events
-
2026-06-09days on market $200,000 Active 24 DOM
-
2026-06-08days on market $200,000 Active 23 DOM
-
2026-06-07days on market $200,000 Active 22 DOM
-
2026-06-07days on market $200,000 Active 21 DOM
-
2026-06-04days on market $200,000 Active 18 DOM
-
2026-06-02days on market $200,000 Active 17 DOM
-
2026-06-01days on market $200,000 Active 16 DOM
-
2026-05-31remarks 55-char remark
-
2026-05-31$200,000 Active 15 DOM
ⓘ Source: listings_history table (triggers on properties + properties_extension) + one-shot
backfill from property_details.listing_events for pre-trigger history.
Tax reassessment forecast CA · Resets to sale price
- Current annual tax
- $433 · $36/mo
- Projected year-2 tax
- $1,520 · $127/mo
- Expected delta
- +$1,087/yr (+$91/mo · 251.0%)
ⓘ Screening estimate from a state-policy table — verify with the county assessor before closing.
Climate risk First Street
- Flood 3/10 Moderate 12% chance over 30 yrs
- Wildfire 3/10 Moderate
- Heat 7/10 Severe 7 d/yr ≥103°F today · 15 d/yr by 30 yrs out
- Wind 1/10 Low
- Air quality 10/10 Extreme 27 unhealthy d/yr today · 33 by 30 yrs out
Nearby sold comps map
Loading sold comps map…
Walkable amenities ~0.75 mi
Loading nearby amenities…
Taxation est. · year 1
- Rental income
- $33,010
- − Mortgage interest
- −$11,203
- − Property taxes
- −$433
- − Insurance
- −$1,000
- − Repairs & maintenance
- −$2,641
- − Management
- −$2,641
- − Depreciation
- −$5,818
- Taxable income
- $9,274
- Est. tax owed @ 24.0%
- −$2,226
- After-tax cash flow
- $9,833/yr
For passive investors: Depreciation is non-cash, so a rental often shows a tax loss while cash-flowing — sheltering income. Rental losses are passive: they offset passive income freely, and up to $25,000/yr can offset ordinary (W-2) income if you actively participate and your MAGI is under $100k (phasing out to $0 by $150k); unused losses carry forward. On sale, claimed depreciation is recaptured at up to 25%, and gains may owe capital-gains tax (a 1031 exchange can defer both). Figures are a year-1 estimate at your 24.0% rate — not tax advice; consult a CPA.
Schools (NCES district)
- District
- Washington Unified
- NCES district ID
- 0641580
- Math proficiency
- 30% ▼ -2.00%
- Reading proficiency
- 57% ▲ 12.00%
- Median HH income
- $55,207
- Composite
- 37.79/100
- National rank
- #4339
- State rank
- #197 of 517 in CA
Livability — West Sacramento
- Score
- 73/100
- State rank
- #164
- US rank
- #5389
Category grades
Schools grade is shown separately in the Schools card above.
Census & demographics
- Census place
- West Sacramento, CA
- County
- Yolo County · 212,115 people
- City population
- 55,039
- Metro
- Sacramento-Roseville-Folsom, CA
- Population (ZIP)
- 14,896
- Household income
- $71,924
- Rent vs Own
- Severe rent burden
- 554.0
Population outlook (Yolo County) Hauer SSP2
- Today (2025)
- 242,183 people
- By 2030
- 257,662 · +6.4%
- By 2040
- 288,050 · +18.9%
- By 2050
- 318,202 · +31.4%
- By 2075
- 392,736 · +62.2%
- By 2100
- 438,150 · +80.9%
Race, ethnicity, and origin ACS 2023
- Neighborhood character
- Diverse neighborhood (Simpson 0.67)
- Race & ethnicity
- Hispanic / Latino 47% White 31% Two or more races 21% Asian 9% Black 5%
- Hispanic origin (detail)
- Mexican 45%
- Common ancestry
- Scotch-Irish 7% Subsaharan African 4% Serbian 1%
- Foreign-born
- 35% · Canada, Vietnam, China
- Languages at home
- 42% English-only · Spanish 35% Russian/Polish/Slavic 14% Other Asian/Pacific 4%
Political lean MEDSL · Yolo
- 2024 margin
- Solid D (+36.2) · D 66.3% · R 30.1% · Other 3.6%
- 2008→2024 swing
- 0.0pp no change · 2008: 36.2pp · 2024: 36.2pp
- All cycles
- 2024: D+36.2 2020: D+41.4 2016: D+42.0 2012: D+33.2 2008: D+36.2
Not yet ingested
- Civics
- —
Market trends
- HPI YoY
- ▼ -214.35%
- Current HPI
- 397.7177
- Rent YoY
- ▼ -2.42%
- Metro
- Sacramento-Roseville-Folsom, CA
- State GDP YoY
- ▲ 3.21%
- F500 in state
- 116
Industry mix (Fortune 500 HQ in CA)
| Industry | F500 HQs | Revenue |
|---|---|---|
| Technology | 27 | $1,492B |
|
||
| Financial Services | 3 | $174B |
|
||
| Retail | 3 | $44B |
|
||
| Insurance | 3 | $26B |
|
||
| Media / Entertainment | 2 | $115B |
|
||
| Pharmaceuticals / Biotech | 2 | $62B |
|
||
Property tax history
+2.2%/yrLatest (2025): $433 · -0.0% YoY. Source: county tax records.
Cash-flow waterfall
monthlySold comps — $/sqft
last 12 mo · ≤1 miLoading sold comps…