 Multi-family
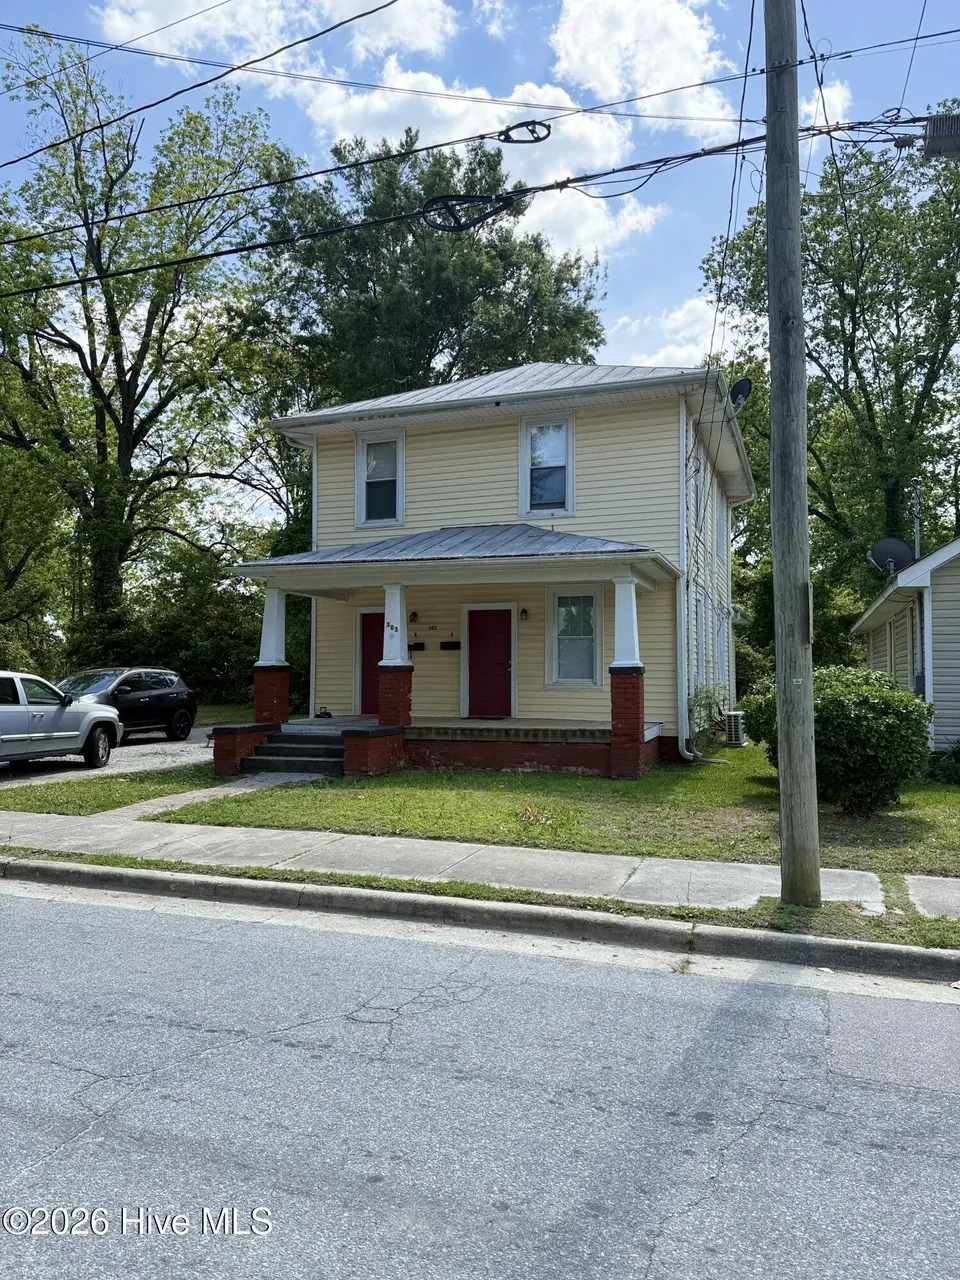
303 Paris Ave · Greenville, NC
Flood risk 1/10 · Minimal
- FEMA flood zone
- X (unshaded)
- Chance of flooding over 30 yrs
- 0.0%
- Est. flood insurance / yr
- $507 – $1,088
Fire risk 3/10 · Minor
- Est. fire insurance / yr
- $906 – $1,684
Heat risk 8/10 · Major
- Hot days now (above 106°F)
- 7 days/yr
- Hot days in 30 yrs
- 17 days/yr
Wind risk 8/10 · Major
- Chance of severe wind over 30 yrs
- 80.0%
Air-quality risk 3/10 · Minor
- Unhealthy air days now
- 3 days/yr
- Unhealthy air days in 30 yrs
- 3 days/yr
Risk factors via First Street. Map © Google.
Why this score? — see what drove the B- grade
The composite is a weighted blend of 9 inputs, each scored 0–100. Each bar is that input's sub-score; the figure is the points it added to the 100-point composite (weight × sub-score).
- Cash flow +30.0/30.0
- 1% rule +10.0/10.0
- DSCR +10.0/10.0
- ARV discount +5.1/15.0
- Rent growth +3.9/5.0
- Livability +3.9/5.0
- Schools +3.6/10.0
- Condition / age +2.5/5.0
- Appreciation +0.0/10.0
$120,000
🖨 Deal sheet (PDF) 📄 Offer letter ✓ Due diligence
Multi-family units
County records classify this as Multi-Family (2-4 Unit). Listing-text estimate: 1 unit. estimate disagrees with records
Listing remarks MLS
EXCELLENT rental history. No Vacancies! 2 bedrooms, one bath upstairs (B side-left door) and 3 bedrooms, one bath downstairs (A side-right door). Vinyl exterior, Wood floors, EBB heat, extra blown-in insulation, thermal windows. RETURN ON INVESTMENT CAN'T BE BEAT! Rented for $325 (B side) & $475 (A side) per month through June 30, 2017. Please give 24 hour notice for showings.
Key facts
- 7,841 sq ft lot
- Built 1920
- Listed 7 days
Property features AI
Finance
- Other: Property subtype: Duplex; Total building size listed as 3,504
- Financial info: Income units listed with actual rents around $700 per unit (multiple 2BR and 3BR units)
- HOA & community: No association amenities
Exterior
- Parking: On-site unpaved parking; Off-street parking; No formal garage
- Utilities: Public water; Public sewer; Water and sewer available
- Home design: Residential income property (duplex); Two-story; Vinyl siding and frame construction
- Construction: Metal roof
- Exterior features: Covered porch; Porch; No pool; Has a view; Road frontage on city street and state road; Lot dimensions approximately 50 x 150 (0.18 acres); Zoning: R6
Interior
- Kitchen: Electric oven; Refrigerator
- Bedrooms: Multiple units: 2-bedroom and 3-bedroom units (unfurnished)
- Flooring: Wood flooring
- Heating & cooling: Central air; Heat pump; Wall furnace; Electric heating; Forced air
- Interior features: Insulated windows with window coverings; Electric water heater; Gas water heater; Crawl space basement (no full basement)
- Laundry & utility: Washer hookup in kitchen
Neighborhood map
What this means for you Summary
Snapshot
- This is a 4-bed/1.0-bath multifamily listed at $120k.
Deal economics
- At list price, monthly cash flow is $1k ($14k/yr) — positive.
- The deal already cash-flows at list — no discount required.
- Meets the 1% rule at list price ($2k rent vs $120k).
- Cap rate 18.3% vs local median 3.8% in Greenville — top-decile yield for the area; either an underpriced asset or a hidden risk that comps aren't pricing in. Stress-test before assuming the spread holds.
Location & tenants
- Location reads 77/100 on livability (#30 in NC, #2,977 nationally) — a middle-class / working-renter tenant base. Strengths: commute A+, cost of living A+, health & safety A+; Watch: crime F, employment F.
- Pitt County Schools (rural): math 41% / reading 44% proficiency, ranked #100 of 178 in NC (top 56%) — families likely to look elsewhere, expect single-tenant / working-renter base with shorter leases.
- Zoned schools: South Greenville Elementary (math 8% / reading 12%, grade F, #1,385 of 1,410 statewide, top 99%, 281 students, 96% FRL); C M Eppes Middle (math 24% / reading 32%, grade F, #360 of 475 statewide, top 77%, 626 students, 99% FRL); Junius H Rose High (math 52% / reading 61%, grade C, #261 of 535 statewide, top 49%, 1,525 students, 50% FRL) — zoned schools average 82% FRL vs 56% district-wide (26 pts higher); higher-poverty schools than district average — tighter screening recommended.
- Market conditions: Rents rising fast (+5.4%/yr); 350 active listings in the ZIP; 4 comparable units currently listed for rent nearby; rentals at typical pace (median 22d on market — plan ~3-4 weeks tenant-placement turnaround); 1,300 units permitted in Pitt County in 2024 (204 in 5+ unit buildings).
- At $2,480/mo this rent would consume 61% of the median local household income ($49k/yr) (locally 3319% of renters already pay >50% of income on rent) — very limited rent-growth headroom before tenants either downsize or default.
Forward outlook
- Local home prices are declining (-3.0%/yr); year-one equity from $830 of loan paydown is wiped out by about $4k of value loss. Plan a longer hold.
- Pitt County population projected at +22% by 2050 — long-run rental-demand tailwind backs the buy-and-hold thesis.
- At projected returns (-3.0% appreciation + 5.4% rent growth), your $34k cash investment doubles in ~3 years — after that, you're playing with house money.
Negotiation context
- Only 7 days on market — expect competitive offers; lowballing is unlikely to land.
- 2 sale attempts since 10y ago with the ask held roughly flat each time — persistent listings suggest the price (not the market) is what's stuck; bring a comps-based counter.
- Current owner paid $100k; 20% above their basis — modest negotiation headroom, anchor on the comps not their cost.
Risks & watch-outs
- Watch-outs: built in 1920 — expect roof / HVAC / electrical / plumbing capex.
- Climate carrying-cost: severe wind risk, 80% chance of damaging wind over 30y; extreme-heat days projected 7→17/yr by 2055 (HVAC capex compounding) — expect insurance premiums to compound above CPI over the hold.
Questions for the listing agent
- Built in 1920 — when were the roof, HVAC, electrical panel, plumbing, and water heater last replaced?
- Is there a deadline driving the sale (1031 exchange, divorce, estate, relocation)? That informs how much negotiation room exists.
- Crime grade is F in this area — have there been break-ins, vandalism, or insurance claims at this property in the last 3 years? What carrier currently insures it and at what premium?
- What's the average days-on-market for RENTAL listings here right now (not sales)? A rising rental-DOM trend means longer vacancies and softer asking-rent achievability than the comps imply.
- What's the recent tenant-quality profile in this submarket — average credit score on applications, eviction rate, late-payment / NSF rate, and stable-employment percentage? A property-management company in the area should have these aggregated.
- How much new apartment / multifamily construction is in the pipeline within 1–3 miles? Heavy new supply (>2% of stock underway) typically softens rents 12–24 months out; light construction supports rent growth.
Investment metrics
- 1% rule
- 2.07% ✓
- Cap rate
- 18.27%
- Cash-on-cash
- 42.79%
- DSCR
- 2.90
- GRM
- 4.0
CMA / ARV
- ARV (on-the-fly)
- $113,886
- Comps found
- 1
Show comp detail 1 sale within ~0.75 mi
| Address | Dist | Beds/Ba | Sqft | Sold | Price | $/sf | Match |
|---|---|---|---|---|---|---|---|
| 306 Watauga Ave Unit A&B | 0.11mi | 4/2.0 | 2,312 (+10%) | 3mo | $125,000 | $54 | 72 |
Match score weights: distance 35% · size 25% · config 20% · recency 20%. Top-matched comps best support the ARV.
Projected returns pro-forma
-3.0% appreciation · 5.44% rent growth · sell at horizon
- IRR
- 42.2%
- Equity multiple
- 2.88×
- Total profit
- $63,098
- Equity at exit
- $17,892
- IRR
- 49.4%
- Equity multiple
- 6.36×
- Total profit
- $180,094
- Equity at exit
- $10,375
Cash invested: $33,600 (down + closing). Projections, not guarantees.
Landlord ↔ Tenant lean methodology
- Overall (STATE)
- 85 Strongly Landlord-Friendly
- State North Carolina
- 85 Strongly Landlord-Friendly · R+3
- County
- — inherits STATE
- City
- — inherits STATE
ZIP-level market 27834
- Rents YoY
- 5.4%
- Active inventory
- 350
- Price-to-rent
- 8.3×
Monthly cashflow live
- Estimated rent
- $2,480 high interval (Pro) →
- Mortgage (P&I)
- −$629
- Tax from tax record
- −$82 /mo · $981/yr
- Insurance
- −$50
- HOA
- −$0
- Vacancy / Maint / Mgmt
- −$521
- Net cashflow
- $1,198
Break-even live
Sensitivity live
| Price | -10% $1,266 | -5% $1,232 | +0% $1,198 | +5% $1,164 | +10% $1,130 |
|---|---|---|---|---|---|
| Rent | -10% $1,002 | -5% $1,100 | +0% $1,198 | +5% $1,296 | +10% $1,394 |
| Rate | -1.0pp $1,259 | -0.5pp $1,229 | base $1,198 | +0.5pp $1,167 | +1.0pp $1,135 |
2-unit breakdown (identical units grouped — click to expand)
| Units | Beds | Baths | Est. rent |
|---|---|---|---|
| 1× unit | 2 | 1 | $1,200 |
| 1× unit | 3 | 1 | $1,281 |
| Total (2 units) | $2,480 | ||
UW: 25.0% down · 7.5% · 30yr · 1.5% tax · 5.0% vac · 8.0% maint · 8.0% mgmt
Financing live
Cash to close
- Down payment
- $30,000
- Closing costs
- $3,600
- Reserves months
- —
- Total cash needed
- —
Loan-product check · same deal, 3 products live
Conventional
25% down · 7.5% · 30yr
- Down + closing
- —
- Monthly P&I
- —
- Monthly cashflow
- —
- DSCR
- —
- Eligible?
- —
Personal DTI + credit; lowest rate.
DSCR
20% down · 8.5% · 30yr
- Down + closing
- —
- Monthly P&I
- —
- Monthly cashflow
- —
- DSCR
- —
- Eligible?
- —
No personal income docs; deal must DSCR.
Hard money
10% down · 12.0% · 12mo
- Down + closing
- —
- Monthly P&I
- —
- Monthly cashflow
- —
- DSCR
- —
- Eligible?
- —
Short-term bridge; refi at stabilization.
Rent comps 4 comps
| Address | Beds | Baths | Sqft | Rent | $/sqft | DOM | Units | Dist |
|---|---|---|---|---|---|---|---|---|
| 550 Pitt-Greene Connector Greenville, NC | 4.0 | 1.0–4.0 | 1012 | $1,475 | $1.46 | 13d | 25 | 0.69mi |
| 1035 Spring Forest Rd Greenville, NC | 3.0 | 2.0–2.5 | 1453 | $1,450 | $1.00 | 21d | 2 | 1.36mi |
| 1015 Spring Forest Rd Unit F5 Greenville, NC | 3.0 | 2.5 | 1453 | $1,200 | $0.83 | 21d | 1 | 1.40mi |
| 2610 Evans St Greenville, NC | 3.0 | 2.0 | 1931 | $1,800 | $0.93 | 21d | 1 | 1.42mi |
Listing history 7 events
-
2026-05-13status Pending
-
2026-05-05$120,000 Active
-
2021-08-09soldstatus $100,000
-
2019-12-18soldstatus $30,000
-
2017-01-27soldstatus $30,000 385-char remark
Show marketing remark (385 chars)
EXCELLENT rental history. No Vacancies! 2 bedrooms, one bath upstairs (B side-left door) and 3 bedrooms, one bath downstairs (A side-right door). Vinyl exterior, Wood floors, EBB heat, extra blown-in insulation, thermal windows. RETURN ON INVESTMENT CAN'T BE BEAT! Rented for $325 (B side) & $475 (A side) per month through June 30, 2017. Please give 24 hour notice for showings.
-
2016-06-21$35,000 385-char remark
Show marketing remark (385 chars)
EXCELLENT rental history. No Vacancies! 2 bedrooms, one bath upstairs (B side-left door) and 3 bedrooms, one bath downstairs (A side-right door). Vinyl exterior, Wood floors, EBB heat, extra blown-in insulation, thermal windows. RETURN ON INVESTMENT CAN'T BE BEAT! Rented for $325 (B side) & $475 (A side) per month through June 30, 2017. Please give 24 hour notice for showings.
-
1984-08-01soldstatus $14,000
ⓘ Source: listings_history table (triggers on properties + properties_extension) + one-shot
backfill from property_details.listing_events for pre-trigger history.
Tax reassessment forecast NC · Resets to sale price
- Current annual tax
- $981 · $82/mo
- Projected year-2 tax
- $984 · $82/mo
- Expected delta
- +$3/yr ($0/mo · 0.3%)
ⓘ Screening estimate from a state-policy table — verify with the county assessor before closing.
Climate risk First Street
- Flood 1/10 Low FEMA zone X (unshaded) · 0% chance over 30 yrs
- Wildfire 3/10 Moderate
- Heat 8/10 Severe 7 d/yr ≥106°F today · 17 d/yr by 30 yrs out
- Wind 8/10 Severe 80% chance of damaging wind over 30 yrs
- Air quality 3/10 Moderate 3 unhealthy d/yr today · 3 by 30 yrs out
Nearby sold comps map
Loading sold comps map…
Walkable amenities ~0.75 mi
Loading nearby amenities…
Taxation est. · year 1
- Rental income
- $29,760
- − Mortgage interest
- −$6,722
- − Property taxes
- −$981
- − Insurance
- −$600
- − Repairs & maintenance
- −$2,381
- − Management
- −$2,381
- − Depreciation
- −$3,491
- Taxable income
- $13,205
- Est. tax owed @ 24.0%
- −$3,169
- After-tax cash flow
- $11,209/yr
For passive investors: Depreciation is non-cash, so a rental often shows a tax loss while cash-flowing — sheltering income. Rental losses are passive: they offset passive income freely, and up to $25,000/yr can offset ordinary (W-2) income if you actively participate and your MAGI is under $100k (phasing out to $0 by $150k); unused losses carry forward. On sale, claimed depreciation is recaptured at up to 25%, and gains may owe capital-gains tax (a 1031 exchange can defer both). Figures are a year-1 estimate at your 24.0% rate — not tax advice; consult a CPA.
Schools (NCES district)
- District
- Pitt County Schools
- NCES district ID
- 3700012
- Math proficiency
- 41% ▬ 0.00%
- Reading proficiency
- 44% ▲ 2.00%
- Median HH income
- $40,631
- Composite
- 35.67/100
- National rank
- #4877
- State rank
- #100 of 178 in NC
Livability — Greenville
- Score
- 77/100
- State rank
- #30
- US rank
- #2977
Category grades
Schools grade is shown separately in the Schools card above.
Census & demographics
- Census place
- Greenville, NC
- County
- Pitt County · 142,592 people
- City population
- 115,121
- Metro
- Greenville, NC
- Population (ZIP)
- 56,347
- Household income
- $48,935
- Rent vs Own
- Severe rent burden
- 3319.0
Population outlook (Pitt County) Hauer SSP2
- Today (2025)
- 194,585 people
- By 2030
- 203,756 · +4.7%
- By 2040
- 220,807 · +13.5%
- By 2050
- 236,614 · +21.6%
- By 2075
- 275,940 · +41.8%
- By 2100
- 300,058 · +54.2%
Race, ethnicity, and origin ACS 2023
- Neighborhood character
- Diverse neighborhood (Simpson 0.59)
- Race & ethnicity
- Black 54% White 33% Hispanic / Latino 8% Two or more races 3% Asian 2%
- Hispanic origin (detail)
- Mexican 7%
- Common ancestry
- Lithuanian 1% Slovak 1% Romanian 1%
- Foreign-born
- 7% · Canada, China
- Languages at home
- 91% English-only · Spanish 6% Other Asian/Pacific 1%
Political lean MEDSL · Pitt
- 2024 margin
- Lean D (+6.0) · D 52.5% · R 46.5% · Other 1.1%
- 2008→2024 swing
- -2.8pp toward R · 2008: 8.8pp · 2024: 6.0pp
- All cycles
- 2024: D+6.0 2020: D+9.4 2016: D+7.4 2012: D+6.7 2008: D+8.8
Not yet ingested
- Civics
- —
Market trends
- HPI YoY
- ▼ -187.99%
- Current HPI
- 190.6869
- Rent YoY
- ▲ 5.44%
- Metro
- Greenville, NC
- State GDP YoY
- ▲ 3.28%
- F500 in state
- 26
Industry mix (Fortune 500 HQ in NC)
| Industry | F500 HQs | Revenue |
|---|---|---|
| Financial Services | 2 | $213B |
|
||
| Retail | 2 | $95B |
|
||
| Industrial Conglomerate | 1 | $38B |
|
||
| Metals / Steel | 1 | $35B |
|
||
| Utilities | 1 | $30B |
|
||
| Industrial Machinery | 1 | $19B |
|
||
Price history
+757.1% since first listed7 events — show timeline
- 2026-05-13 Pending — Hive MLS
- 2026-05-05 Listed $120,000 Hive MLS
- 2021-08-09 Sold (Public Records) $100,000 Public Records
- 2019-12-18 Sold (Public Records) $30,000 Public Records
- 2017-01-27 Sold (MLS) $30,000 Hive MLS
- 2016-06-21 Listed $35,000 Hive MLS
- 1984-08-01 Sold (Public Records) $14,000 Public Records
Property tax history
+15.8%/yrLatest (2025): $981 · +1.2% YoY. Source: county tax records.
Cash-flow waterfall
monthlySold comps — $/sqft
last 12 mo · ≤1 miLoading sold comps…