418 Roberts St · Moberly, MO
Flood risk 1/10 · Minimal
- FEMA flood zone
- X (unshaded)
- Chance of flooding over 30 yrs
- 0.0%
- Est. flood insurance / yr
- $507 – $1,088
Fire risk 4/10 · Minor
- Est. fire insurance / yr
- $1,054 – $1,958
Heat risk 4/10 · Minor
- Hot days now (above 107°F)
- 7 days/yr
- Hot days in 30 yrs
- 17 days/yr
Wind risk 2/10 · Minimal
- Chance of severe wind over 30 yrs
- —
Air-quality risk 1/10 · Minimal
- Unhealthy air days now
- 0 days/yr
- Unhealthy air days in 30 yrs
- 0 days/yr
Risk factors via First Street. Map © Google.
Why this score? — see what drove the C+ grade
The composite is a weighted blend of 9 inputs, each scored 0–100. Each bar is that input's sub-score; the figure is the points it added to the 100-point composite (weight × sub-score).
- Cash flow +28.6/30.0
- DSCR +10.0/10.0
- ARV discount +7.5/15.0
- 1% rule +6.8/10.0
- Livability +3.9/5.0
- Schools +2.7/10.0
- Rent growth +2.5/5.0
- Condition / age +2.5/5.0
- Appreciation +0.0/10.0
$99,990
🖨 Deal sheet (PDF) 📄 Offer letter ✓ Due diligence
Listing remarks
Charming one bedroom home. Updated and move in ready! All new bathroom, new flooring in kitchen and bath. Painted throughout. New gas range and updates to the exterior! Full unfinished basement for any storage needs. Detached garage great for securing your vehicle and lawn equipment.
Key facts
- New gas range
- New bathroom
- New flooring
Tags
Property features AI
Exterior
- Parking: Detached 1-car garage
- Utilities: Public water
- Home design: Single family residence; Residential property
- Exterior features: Deck; Front porch; Paved road access; Lot approximately 50 x 150
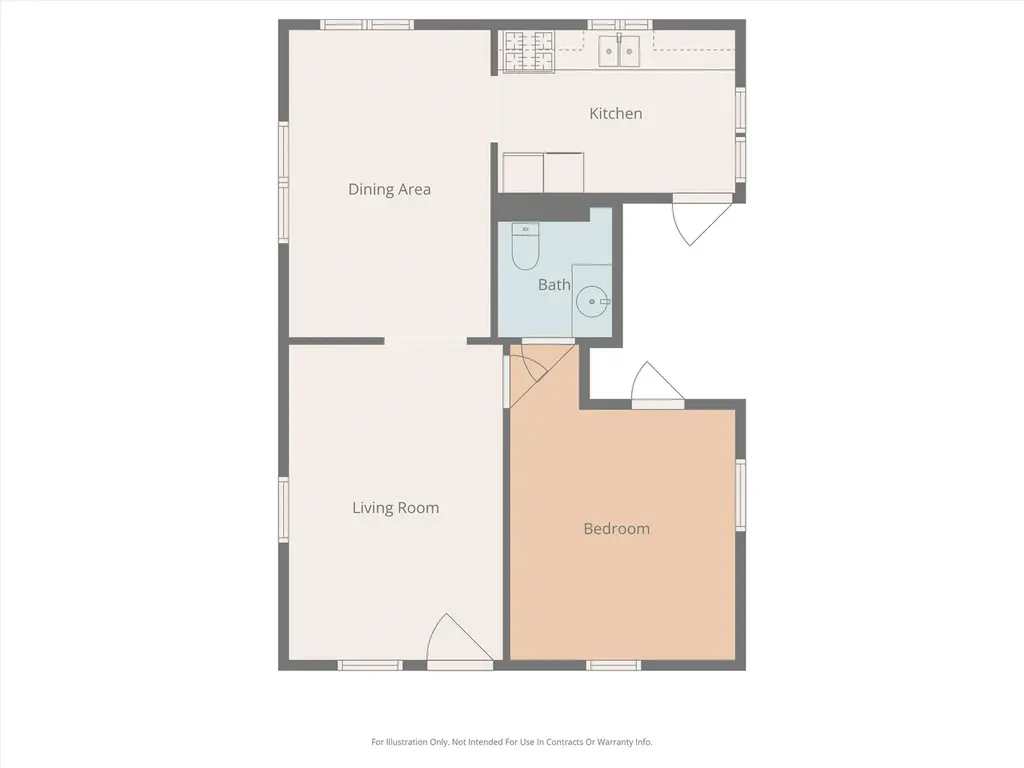
Interior
- Kitchen: Gas range
- Bedrooms: 5 total rooms (bedroom count not specified)
- Flooring: Wood flooring; Laminate flooring
- Bathrooms: 1 full bathroom
- Heating & cooling: Natural gas heating; Forced air
- Interior features: Gas range; Wood and laminate flooring; Basement
Neighborhood map
What this means for you Summary
Snapshot
- This is a 2-bed/1.0-bath single-family listed at $100k.
Deal economics
- At list price, monthly cash flow is $331 ($4k/yr) — positive.
- The deal already cash-flows at list — no discount required.
- Meets the 1% rule at list price ($1k rent vs $100k).
- Recommended offer: $97k (3.0% below list) — sets the bar for market timing.
- Cap rate 10.3% vs local median 4.5% in Moberly — top-decile yield for the area; either an underpriced asset or a hidden risk that comps aren't pricing in. Stress-test before assuming the spread holds.
Location & tenants
- Location reads 77/100 on livability (#32 in MO, #3,045 nationally) — a middle-class / working-renter tenant base. Strengths: cost of living A+, housing A+, health & safety A+; Watch: employment D, amenities F, commute F.
- Moberly (town): math 30% / reading 36% proficiency, ranked #246 of 324 in MO (top 76%) — families likely to look elsewhere, expect single-tenant / working-renter base with shorter leases.
- Zoned schools: Gratz Brown Elem. (math 28% / reading 28%, grade F, #849 of 1,115 statewide, top 76%, 436 students, 66% FRL); Moberly Middle (math 39% / reading 36%, grade F, #215 of 391 statewide, top 56%, 497 students, 59% FRL); Moberly Sr. High (math 2% / reading 52%, grade F, #417 of 521 statewide, top 80%, 691 students, 47% FRL) — zoned schools at 57% FRL track the district average.
- Market conditions: 136 active listings in the ZIP; 25 units permitted in Randolph County in 2024 (0 in 5+ unit buildings).
Forward outlook
- Local home prices are declining (-3.0%/yr); year-one equity from $692 of loan paydown is wiped out by about $3k of value loss. Plan a longer hold.
- Randolph County population projected at -10% by 2050 — secular population decline; favor cash flow + early exit over multi-decade hold.
- At projected returns (-3.0% appreciation + 3.0% rent growth), your $28k cash investment doubles in ~9 years — after that, you're playing with house money.
Negotiation context
- It's been on market 56 days — a 3% lower offer ($97k) is reasonable based on typical stale-listing flexibility.
Risks & watch-outs
- Watch-outs: built in 1940 — expect roof / HVAC / electrical / plumbing capex.
Questions for the listing agent
- It's been on market 56 days. Have you received any prior offers? Is the seller open to a 3% concession, seller financing, or rate buy-down credit?
- Built in 1940 — when were the roof, HVAC, electrical panel, plumbing, and water heater last replaced?
- Is there a deadline driving the sale (1031 exchange, divorce, estate, relocation)? That informs how much negotiation room exists.
- Schools are D-rated, which usually means shorter tenancies and higher turnover. Who's the typical renter profile here, and what's been the actual vacancy rate?
- What's the average days-on-market for RENTAL listings here right now (not sales)? A rising rental-DOM trend means longer vacancies and softer asking-rent achievability than the comps imply.
- What's the recent tenant-quality profile in this submarket — average credit score on applications, eviction rate, late-payment / NSF rate, and stable-employment percentage? A property-management company in the area should have these aggregated.
- How much new for-sale + rental construction is in the pipeline within 1–3 miles? Heavy new supply typically softens prices + rents 12–24 months out; constrained supply supports both.
Investment metrics
- 1% rule
- 1.18% ✓
- Cap rate
- 10.27%
- Cash-on-cash
- 14.19%
- DSCR
- 1.63
- GRM
- 7.1
CMA / ARV
- ARV (median comp)
- $64,743
- List price
- $99,990
- Delta
- 54.44%
- Verdict
- OVERPRICED
- Comps
- 20 within 1.0 mi
Show comp detail 12 sales within ~0.75 mi
| Address | Dist | Beds/Ba | Sqft | Sold | Price | $/sf | Match |
|---|---|---|---|---|---|---|---|
| 511 Union Ave | 0.32mi | 2/1.0 | 768 (0%) | 8mo | $99,900 | $130 | 79 |
| 537 Fulton Ave | 0.52mi | 2/1.0 | 780 (+2%) | 4mo | $15,000 | $19 | 70 |
| 438 E Rollins St | 0.17mi | 2/1.0 | 852 (+11%) | 16mo | $49,900 | $59 | 61 |
| 415 Mckinley Ave | 0.38mi | 2/1.0 | 864 (+12%) | 4mo | $119,000 | $138 | 58 |
| 602 Garfield Ave | 0.54mi | 2/1.0 | 792 (+3%) | 18mo | $129,000 | $163 | 54 |
| 218 S Ault St | 0.28mi | 2/1.0 | 858 (+12%) | 16mo | $110,000 | $128 | 54 |
| 808 Promenade St | 0.65mi | 2/1.0 | 728 (-5%) | 9mo | $120,000 | $165 | 54 |
| 209 Jefferson Ave | 0.73mi | 2/1.0 | 748 (-3%) | 13mo | $25,000 | $33 | 51 |
| 915 Owens St | 0.68mi | 1/1.0 (-1) | 756 (-2%) | 16mo | $49,000 | $65 | 48 |
| 319 Halleck St | 0.60mi | 2/1.0 | 860 (+12%) | 8mo | $120,000 | $140 | 46 |
| 320 E Carpenter St | 0.48mi | 1/1.0 (-1) | 660 (-14%) | 9mo | $105,000 | $159 | 42 |
| 610 Monroe Ave | 0.52mi | 2/1.0 | 864 (+12%) | 18mo | $115,000 | $133 | 40 |
Match score weights: distance 35% · size 25% · config 20% · recency 20%. Top-matched comps best support the ARV.
Projected returns pro-forma
-3.0% appreciation · 3.0% rent growth · sell at horizon
- IRR
- 4.5%
- Equity multiple
- 1.17×
- Total profit
- $4,844
- Equity at exit
- $14,909
- IRR
- 13.9%
- Equity multiple
- 2.11×
- Total profit
- $31,212
- Equity at exit
- $8,645
Cash invested: $27,997 (down + closing). Projections, not guarantees.
Landlord ↔ Tenant lean methodology
- Overall (STATE)
- 81 Strongly Landlord-Friendly
- State Missouri
- 81 Strongly Landlord-Friendly · R+10
- County
- — inherits STATE
- City
- — inherits STATE
ZIP-level market 65270
- Home prices YoY
- -30.6%
- Active inventory
- 136
- Price-to-rent
- 7.1×
Monthly cashflow live
- Estimated rent
- $1,178 medium interval (Pro) →
- Mortgage (P&I)
- −$524
- Tax from tax record
- −$33 /mo · $398/yr
- Insurance
- −$42
- HOA
- −$0
- Vacancy / Maint / Mgmt
- −$247
- Net cashflow
- $331
Break-even live
Sensitivity live
| Price | -10% $388 | -5% $359 | +0% $331 | +5% $303 | +10% $274 |
|---|---|---|---|---|---|
| Rent | -10% $238 | -5% $285 | +0% $331 | +5% $378 | +10% $424 |
| Rate | -1.0pp $381 | -0.5pp $356 | base $331 | +0.5pp $305 | +1.0pp $279 |
UW: 25.0% down · 7.5% · 30yr · 1.5% tax · 5.0% vac · 8.0% maint · 8.0% mgmt
Financing live
Cash to close
- Down payment
- $24,998
- Closing costs
- $3,000
- Reserves months
- —
- Total cash needed
- —
Loan-product check · same deal, 3 products live
Conventional
25% down · 7.5% · 30yr
- Down + closing
- —
- Monthly P&I
- —
- Monthly cashflow
- —
- DSCR
- —
- Eligible?
- —
Personal DTI + credit; lowest rate.
DSCR
20% down · 8.5% · 30yr
- Down + closing
- —
- Monthly P&I
- —
- Monthly cashflow
- —
- DSCR
- —
- Eligible?
- —
No personal income docs; deal must DSCR.
Hard money
10% down · 12.0% · 12mo
- Down + closing
- —
- Monthly P&I
- —
- Monthly cashflow
- —
- DSCR
- —
- Eligible?
- —
Short-term bridge; refi at stabilization.
Listing history 19 events
-
2026-06-21days on market $99,990 Active 56 DOM
-
2026-06-21days on market $99,990 Active 55 DOM
-
2026-06-18days on market $99,990 Active 53 DOM
-
2026-06-17days on market $99,990 Active 52 DOM
-
2026-06-16days on market $99,990 Active 51 DOM
-
2026-06-15days on market $99,990 Active 50 DOM
-
2026-06-13days on market $99,990 Active 48 DOM
-
2026-06-12days on market $99,990 Active 47 DOM
-
2026-06-09days on market $99,990 Active 44 DOM
-
2026-06-08days on market $99,990 Active 43 DOM
-
2026-06-07days on market $99,990 Active 42 DOM
-
2026-06-07days on market $99,990 Active 41 DOM
-
2026-06-04days on market $99,990 Active 38 DOM
-
2026-06-02days on market $99,990 Active 37 DOM
-
2026-06-01days on market $99,990 Active 36 DOM
-
2026-05-31days on market $99,990 Active 35 DOM
-
2026-04-26$99,990 Active 284-char remark
-
1994-10-07soldstatus
-
1984-06-11soldstatus
ⓘ Source: listings_history table (triggers on properties + properties_extension) + one-shot
backfill from property_details.listing_events for pre-trigger history.
Tax reassessment forecast MO · Resets to sale price
- Current annual tax
- $398 · $33/mo
- Projected year-2 tax
- $970 · $81/mo
- Expected delta
- +$572/yr (+$48/mo · 143.6%)
ⓘ Screening estimate from a state-policy table — verify with the county assessor before closing.
Climate risk First Street
- Flood 1/10 Low FEMA zone X (unshaded) · 0% chance over 30 yrs
- Wildfire 4/10 Moderate
- Heat 4/10 Moderate 7 d/yr ≥107°F today · 17 d/yr by 30 yrs out
- Wind 2/10 Low
- Air quality 1/10 Low 0 unhealthy d/yr today · 0 by 30 yrs out
Nearby sold comps map
Loading sold comps map…
Walkable amenities ~0.75 mi
Loading nearby amenities…
Taxation est. · year 1
- Rental income
- $14,130
- − Mortgage interest
- −$5,601
- − Property taxes
- −$398
- − Insurance
- −$500
- − Repairs & maintenance
- −$1,130
- − Management
- −$1,130
- − Depreciation
- −$2,909
- Taxable income
- $2,462
- Est. tax owed @ 24.0%
- −$591
- After-tax cash flow
- $3,382/yr
For passive investors: Depreciation is non-cash, so a rental often shows a tax loss while cash-flowing — sheltering income. Rental losses are passive: they offset passive income freely, and up to $25,000/yr can offset ordinary (W-2) income if you actively participate and your MAGI is under $100k (phasing out to $0 by $150k); unused losses carry forward. On sale, claimed depreciation is recaptured at up to 25%, and gains may owe capital-gains tax (a 1031 exchange can defer both). Figures are a year-1 estimate at your 24.0% rate — not tax advice; consult a CPA.
Schools (NCES district)
- District
- Moberly
- NCES district ID
- 2921100
- Math proficiency
- 30% ▼ -1.00%
- Reading proficiency
- 36% ▼ -3.00%
- Median HH income
- $36,160
- Composite
- 27.35/100
- National rank
- #6984
- State rank
- #246 of 324 in MO
Livability — Moberly
- Score
- 77/100
- State rank
- #32
- US rank
- #3045
Category grades
Schools grade is shown separately in the Schools card above.
Census & demographics
- Census place
- Moberly, MO
- Population (ZIP)
- 16,762
Population outlook (Randolph County) Hauer SSP2
- Today (2025)
- 24,596 people
- By 2030
- 24,213 · -1.6%
- By 2040
- 23,184 · -5.7%
- By 2050
- 22,081 · -10.2%
- By 2075
- 18,994 · -22.8%
- By 2100
- 15,070 · -38.7%
Race, ethnicity, and origin ACS 2023
- Neighborhood character
- Predominantly White (84%)
- Race & ethnicity
- White 84% Black 7% Two or more races 6% Hispanic / Latino 3%
- Common ancestry
- Italian 2% Lithuanian 2% Iranian 1%
- Foreign-born
- 1% · Canada
- Languages at home
- 98% English-only · Spanish 1%
Political lean MEDSL · Randolph
- 2024 margin
- Solid R (+52.2) · D 23.3% · R 75.5% · Other 1.2%
- 2008→2024 swing
- -28.9pp toward R · 2008: -23.3pp · 2024: -52.2pp
- All cycles
- 2024: R+52.2 2020: R+51.5 2016: R+50.9 2012: R+36.6 2008: R+23.3
Not yet ingested
- Civics
- —
Market trends
- HPI YoY
- ▼ -88.15%
- Current HPI
- 199.9743
- Rent YoY
- —
- Metro
- —
- State GDP YoY
- ▲ 1.84%
- F500 in state
- 20
Industry mix (Fortune 500 HQ in MO)
| Industry | F500 HQs | Revenue |
|---|---|---|
| Healthcare | 1 | $163B |
|
||
| Insurance | 1 | $21B |
|
||
| Industrial Technology | 1 | $17B |
|
||
| Retail | 1 | $16B |
|
||
| Industrial Distribution | 1 | $10B |
|
||
| Utilities | 1 | $9B |
|
||
Price history
3 events — show timeline
- 2026-04-26 Listed $99,990 CBORMLS
- 1994-10-07 Sold (Public Records) — Public Records
- 1984-06-11 Sold (Public Records) — Public Records
Property tax history
+2.1%/yrLatest (2025): $398 · +8.3% YoY. Source: county tax records.
Cash-flow waterfall
monthlySold comps — $/sqft
last 12 mo · ≤1 miLoading sold comps…