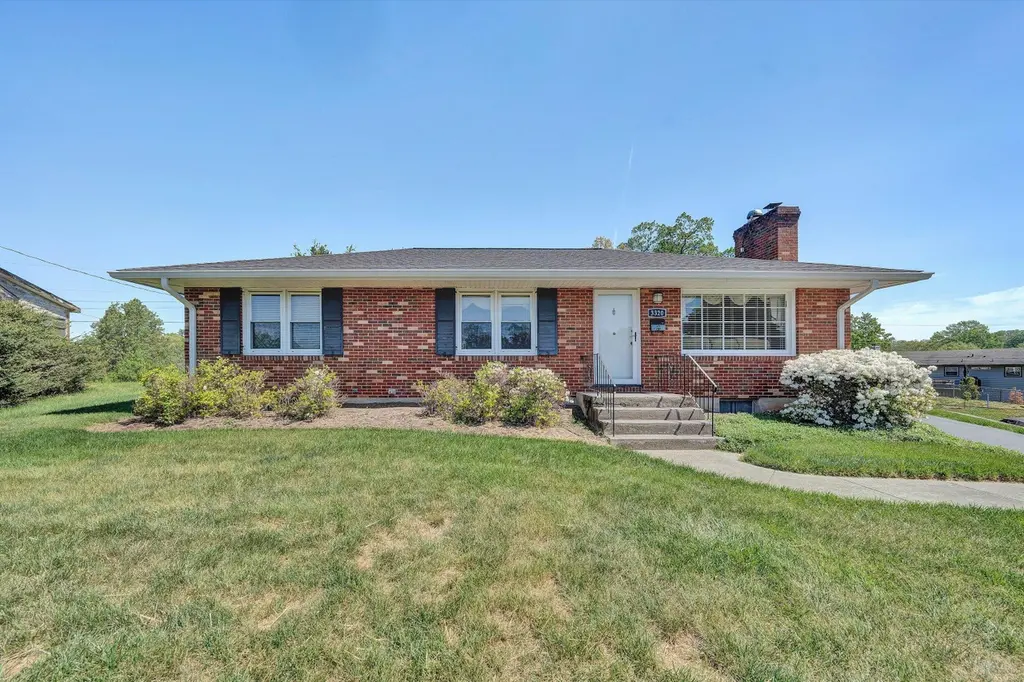
3320 Melody Ave · Cave Spring, VA
Flood risk 1/10 · Minimal
- FEMA flood zone
- X (unshaded)
- Chance of flooding over 30 yrs
- 0.0%
- Est. flood insurance / yr
- $473 – $860
Fire risk 1/10 · Minimal
- Est. fire insurance / yr
- $666 – $1,236
Heat risk 5/10 · Moderate
- Hot days now (above 100°F)
- 7 days/yr
- Hot days in 30 yrs
- 18 days/yr
Wind risk 2/10 · Minimal
- Chance of severe wind over 30 yrs
- 1.0%
Air-quality risk 2/10 · Minimal
- Unhealthy air days now
- 0 days/yr
- Unhealthy air days in 30 yrs
- 1 days/yr
Risk factors via First Street. Map © Google.
Why this score? — see what drove the F grade
The composite is a weighted blend of 9 inputs, each scored 0–100. Each bar is that input's sub-score; the figure is the points it added to the 100-point composite (weight × sub-score).
- ARV discount +8.7/15.0
- Cash flow +6.9/30.0
- Schools +6.4/10.0
- Livability +3.8/5.0
- Rent growth +3.2/5.0
- Condition / age +2.5/5.0
- 1% rule +1.1/10.0
- DSCR +1.1/10.0
- Appreciation +0.0/10.0
$299,950
🖨 Deal sheet 📄 Offer letter ✓ Due diligence
Listing remarks MLS
Totally Updated * Hardwoods Refinished * New Water Heater * New Light Fixtures 1st Floor * Remodeled Baths with fixtures, sinks, lights - you name it! Fresh Paint throughout - All Kitchen Appliances remain - New Dishwasher, Disposal, Plumbing, Backsplash, Pantry. Spacious Screened Porch off Kitchen * You will see the Love & Care put into this Home!
Key facts
- Gas log fireplaces
- Plenty of parking
- Paved driveway
Tags
Neighborhood map
What this means for you Summary
Snapshot
- This is a 3-bed/2.0-bath single-family listed at $300k.
Deal economics
- At list price, monthly cash flow is $-452 ($-5k/yr) — negative.
- To cash-flow at today's rent, offer at most $220k (26.6% below list).
- To meet the 1% rule (rent ≥ 1% of price), the offer needs to be $184k (38.8% below list).
- Recommended offer: $184k (38.8% below list) — sets the bar for 1% rule.
- Cap rate 4.5% vs local median 3.4% in Cave Spring — top-decile yield for the area; either an underpriced asset or a hidden risk that comps aren't pricing in. Stress-test before assuming the spread holds.
Location & tenants
- Location reads 76/100 on livability (#113 in VA, #3,513 nationally) — a middle-class / working-renter tenant base. Strengths: housing A+, health & safety A+, cost of living A-; Watch: amenities F, commute F.
- Roanoke County Public School District (suburban): math 71% / reading 78% proficiency, ranked #9 of 131 in VA (top 7%) — strong family-tenant draw, lease renewals of 3-5y typical.
- Zoned schools: Green Valley Elementary (math 63% / reading 75%, grade A-, #351 of 1,108 statewide, top 32%, 518 students, 43% FRL); Hidden Valley Middle (math 76% / reading 83%, grade A+, #28 of 342 statewide, top 8%, 578 students, 26% FRL); Hidden Valley High (math 90% / reading 92%, grade A+, #5 of 319 statewide, top 1%, 830 students, 24% FRL).
- Market conditions: Rents rising (+2.9%/yr); 333 active listings in the ZIP; 14 comparable units currently listed for rent nearby; rentals leasing fast (median 14d on market — plan ~1-2 weeks tenant-placement turnaround); solid renter incomes; 360 units permitted in Roanoke County in 2024 (228 in 5+ unit buildings).
Forward outlook
- Local home prices are declining (-3.0%/yr); year-one equity from $2k of loan paydown is wiped out by about $9k of value loss. Plan a longer hold.
- Roanoke County population projected at +5% by 2050 — modest demand growth; plan on rents tracking national, not racing it.
Negotiation context
- Only 6 days on market — expect competitive offers; lowballing is unlikely to land.
- 3 sale attempts since 25y ago with the ask held roughly flat each time — persistent listings suggest the price (not the market) is what's stuck; bring a comps-based counter.
- Current owner paid $192k; list at $300k implies a 56% gain — meaningful room to come down on a strong offer.
Risks & watch-outs
- Climate carrying-cost: extreme-heat days projected 7→18/yr by 2055 (HVAC capex compounding) — expect insurance premiums to compound above CPI over the hold.
Questions for the listing agent
- What do current leases actually rent for vs. the listed asking? Can we see a recent rent roll and the last 12 months of T-12 income?
- Built in 1960 — when were the roof, HVAC, electrical panel, plumbing, and water heater last replaced?
- Is there a deadline driving the sale (1031 exchange, divorce, estate, relocation)? That informs how much negotiation room exists.
- Schools are A-rated — typically a magnet for longer-tenancy family renters. What's the average tenant stay here, and is there a school-zone premium baked into asking?
- The area grade is low — what's the realistic commute time and amenity access for the typical tenant pool here? Any planned neighborhood developments (good or bad) we should know about?
- What's the average days-on-market for RENTAL listings here right now (not sales)? A rising rental-DOM trend means longer vacancies and softer asking-rent achievability than the comps imply.
- What's the recent tenant-quality profile in this submarket — average credit score on applications, eviction rate, late-payment / NSF rate, and stable-employment percentage? A property-management company in the area should have these aggregated.
- How much new for-sale + rental construction is in the pipeline within 1–3 miles? Heavy new supply typically softens prices + rents 12–24 months out; constrained supply supports both.
Investment metrics
- 1% rule
- 0.61% ✗
- Cap rate
- 4.48%
- Cash-on-cash
- -6.46%
- DSCR
- 0.71
- GRM
- 13.6
CMA / ARV
- ARV (on-the-fly)
- $308,367
- Comps found
- 6
Show comp detail 6 sales within ~0.75 mi
| Address | Dist | Beds/Ba | Sqft | Sold | Price | $/sf | Match |
|---|---|---|---|---|---|---|---|
| 3617 View Ave | 0.64mi | 3/2.0 | 1,250 (-2%) | 2mo | $305,000 | $244 | 66 |
| 3014 Fleetwood Ave SW | 0.32mi | 2/1.0 (-1) | 1,191 (-6%) | 1mo | $237,000 | $199 | 65 |
| 3713 Pinevale Rd | 0.36mi | 3/2.0 | 1,166 (-8%) | 10mo | $305,000 | $262 | 61 |
| 3715 Willetta Dr | 0.30mi | 3/1.0 | 1,104 (-13%) | 10mo | $210,000 | $190 | 52 |
| 2825 Tillett Rd SW | 0.56mi | 3/2.0 | 1,452 (+14%) | 20mo | $299,000 | $206 | 33 |
| 4346 Garstview Cir | 0.74mi | 2/2.0 (-1) | 1,358 (+7%) | 24mo | $329,950 | $243 | 29 |
Match score weights: distance 35% · size 25% · config 20% · recency 20%. Top-matched comps best support the ARV.
Projected returns pro-forma
-3.0% appreciation · 2.88% rent growth · sell at horizon
- IRR
- -27.6%
- Equity multiple
- 0.07×
- Total profit
- $-77,700
- Equity at exit
- $44,724
- IRR
- -26.5%
- Equity multiple
- -0.26×
- Total profit
- $-105,960
- Equity at exit
- $25,934
Cash invested: $83,986 (down + closing). Projections, not guarantees.
Landlord ↔ Tenant lean methodology
- Overall (STATE)
- 55 Moderately Landlord-Leaning
- State Virginia
- 55 Moderately Landlord-Leaning · D+2
- County
- — inherits STATE
- City
- — inherits STATE
ZIP-level market 24018
- Rents YoY
- 2.9%
- Active inventory
- 333
- Price-to-rent
- 13.6×
Monthly cashflow live
- Estimated rent
- $1,836 high interval (Pro) →
- Mortgage (P&I)
- −$1,573
- Tax from tax record
- −$204 /mo · $2,451/yr
- Insurance
- −$125
- HOA
- −$0
- Vacancy / Maint / Mgmt
- −$385
- Net cashflow
- $-452
Break-even live
UW: 25.0% down · 7.5% · 30yr · 1.5% tax · 5.0% vac · 8.0% maint · 8.0% mgmt
Financing live
Cash to close
- Down payment
- $74,988
- Closing costs
- $8,998
- Reserves months
- —
- Total cash needed
- —
Loan-product check · same deal, 3 products live
Conventional
25% down · 7.5% · 30yr
- Down + closing
- —
- Monthly P&I
- —
- Monthly cashflow
- —
- DSCR
- —
- Eligible?
- —
Personal DTI + credit; lowest rate.
DSCR
20% down · 8.5% · 30yr
- Down + closing
- —
- Monthly P&I
- —
- Monthly cashflow
- —
- DSCR
- —
- Eligible?
- —
No personal income docs; deal must DSCR.
Hard money
10% down · 12.0% · 12mo
- Down + closing
- —
- Monthly P&I
- —
- Monthly cashflow
- —
- DSCR
- —
- Eligible?
- —
Short-term bridge; refi at stabilization.
Rent comps 14 comps
| Address | Beds | Baths | Sqft | Rent | $/sqft | DOM | Units | Dist |
|---|---|---|---|---|---|---|---|---|
| 3363 View Ave Roanoke, VA | 3.0 | 1.0 | 1014 | $1,895 | $1.87 | 21d | 1 | 0.36mi |
| 2679 Beverly Blvd SW Roanoke, VA | 3.0 | 1.0 | 1000 | $1,623 | $1.62 | 13d | 1 | 0.48mi |
| 4356 Old Garst Ml Rd Cave Spring, VA | 1.0–2.0 | 1.0–1.5 | 889 | $1,341 | $1.51 | 13d | 14 | 0.49mi |
| 3602 Colonial Green Cir SW Roanoke, VA | 3.0 | 2.5 | 1670 | $2,622 | $1.57 | 13d | 1 | 0.62mi |
| 3709 Antietam Dr Roanoke, VA | 2.0 | 1.0 | 1016 | $1,899 | $1.87 | 13d | 1 | 0.70mi |
| 3501 Normandy Ln Roanoke, VA | 2.0 | 1.0 | 925 | $1,250 | $1.35 | 13d | 1 | 0.81mi |
| 3464 Colonial Ave Roanoke, VA | 2.0 | 1.0 | 1100 | $1,495 | $1.36 | 13d | 5 | 0.83mi |
| 3620 Manassas Dr Roanoke, VA | 3.0 | 1.5 | 1200 | $2,300 | $1.92 | 43d | 1 | 0.92mi |
| 3345 Circle Brook Dr Cave Spring, VA | 1.0–3.0 | 1.0–2.0 | 997 | $1,920 | $1.92 | 13d | 11 | 1.05mi |
| 3101 Honeywood Ln Roanoke, VA | 1.0–2.0 | 1.0–1.5 | 919 | $1,690 | $1.84 | 13d | 7 | 1.17mi |
| 2615 Laburnum Ave SW Roanoke, VA | 2.0 | 1.5 | 1323 | $1,800 | $1.36 | 43d | 1 | 1.32mi |
| 2615 Laburnum Ave SW Roanoke, VA | 2.0 | 1.5 | 1323 | $1,825 | $1.38 | 21d | 1 | 1.32mi |
| 2432 Brandon Ave SW Roanoke, VA | 2.0 | 1.0 | 1015 | $1,275 | $1.26 | 43d | 1 | 1.39mi |
| 4630 Roxbury Ln Cave Spring, VA | 1.0–2.0 | 1.0–1.5 | 930 | $1,625 | $1.75 | 13d | 7 | 1.40mi |
Listing history 8 events
-
2026-04-23status Pending
-
2026-04-17$299,950 Active
-
2006-05-26soldstatus $192,500 366-char remark
Show marketing remark (366 chars)
Totally Updated * Hardwoods Refinished * New Water Heater * New Light Fixtures 1st Floor * Remodeled Baths with fixtures, sinks, lights - you name it! Fresh Paint throughout - All Kitchen Appliances remain - New Dishwasher, Disposal, Plumbing, Backsplash, Pantry. Spacious Screened Porch off Kitchen * You will see the Love & Care put into this Home!
-
2006-05-01soldstatus $192,500
-
2006-04-07$192,500 366-char remark
Show marketing remark (366 chars)
Totally Updated * Hardwoods Refinished * New Water Heater * New Light Fixtures 1st Floor * Remodeled Baths with fixtures, sinks, lights - you name it! Fresh Paint throughout - All Kitchen Appliances remain - New Dishwasher, Disposal, Plumbing, Backsplash, Pantry. Spacious Screened Porch off Kitchen * You will see the Love & Care put into this Home!
-
2001-03-08soldstatus $114,000 205-char remark
Show marketing remark (205 chars)
* * PLEASE GIVE 1 HOUR NOTICE-ELDERLY * * WELL MAINTAINED HOME W/ HARDWOOD FLOORS UNDER CARPET, WONDERFUL SCREENED IN PORCH, GAS RANGE, UPDATED ELECTRIC & REPLACEMENT WINDOWS, LOCKBOX ON BACK DOOR
-
2001-03-01soldstatus $114,000
-
2001-01-29$114,950 205-char remark
Show marketing remark (205 chars)
* * PLEASE GIVE 1 HOUR NOTICE-ELDERLY * * WELL MAINTAINED HOME W/ HARDWOOD FLOORS UNDER CARPET, WONDERFUL SCREENED IN PORCH, GAS RANGE, UPDATED ELECTRIC & REPLACEMENT WINDOWS, LOCKBOX ON BACK DOOR
ⓘ Source: listings_history table (triggers on properties + properties_extension) + one-shot
backfill from property_details.listing_events for pre-trigger history.
Tax reassessment forecast VA · Resets to sale price
- Current annual tax
- $2,451 · $204/mo
- Projected year-2 tax
- $2,460 · $205/mo
- Expected delta
- +$8/yr (+$1/mo · 0.3%)
ⓘ Screening estimate from a state-policy table — verify with the county assessor before closing.
Climate risk First Street
- Flood 1/10 Low FEMA zone X (unshaded) · 0% chance over 30 yrs
- Wildfire 1/10 Low
- Heat 5/10 Major 7 d/yr ≥100°F today · 18 d/yr by 30 yrs out
- Wind 2/10 Low 100% chance of damaging wind over 30 yrs
- Air quality 2/10 Low 0 unhealthy d/yr today · 1 by 30 yrs out
Nearby sold comps map
Loading sold comps map…
Walkable amenities ~0.75 mi
Loading nearby amenities…
Taxation est. · year 1
- Rental income
- $22,027
- − Mortgage interest
- −$16,802
- − Property taxes
- −$2,451
- − Insurance
- −$1,500
- − Repairs & maintenance
- −$1,762
- − Management
- −$1,762
- − Depreciation
- −$8,726
- Taxable loss
- −$10,976
- Est. tax savings @ 24.0%
- +$2,634
- After-tax cash flow
- $-2,791/yr
For passive investors: Depreciation is non-cash, so a rental often shows a tax loss while cash-flowing — sheltering income. Rental losses are passive: they offset passive income freely, and up to $25,000/yr can offset ordinary (W-2) income if you actively participate and your MAGI is under $100k (phasing out to $0 by $150k); unused losses carry forward. On sale, claimed depreciation is recaptured at up to 25%, and gains may owe capital-gains tax (a 1031 exchange can defer both). Figures are a year-1 estimate at your 24.0% rate — not tax advice; consult a CPA.
Schools (NCES district)
- District
- Roanoke County Public School District
- NCES district ID
- 5103330
- Math proficiency
- 71% ▼ -19.00%
- Reading proficiency
- 78% ▼ -6.00%
- Median HH income
- $60,526
- Composite
- 64.08/100
- National rank
- #578
- State rank
- #9 of 131 in VA
Livability — Cave Spring
- Score
- 76/100
- State rank
- #113
- US rank
- #3513
Category grades
Schools grade is shown separately in the Schools card above.
Census & demographics
- Census place
- Cave Spring, VA
- County
- Roanoke County · 67,305 people
- Metro
- Roanoke, VA
- Population (ZIP)
- 38,720
- Household income
- $90,885
- Rent vs Own
- Severe rent burden
- 495.0
Population outlook (Roanoke County) Hauer SSP2
- Today (2025)
- 98,162 people
- By 2030
- 99,793 · +1.7%
- By 2040
- 101,965 · +3.9%
- By 2050
- 103,328 · +5.3%
- By 2075
- 108,641 · +10.7%
- By 2100
- 104,845 · +6.8%
Race, ethnicity, and origin ACS 2023
- Neighborhood character
- Predominantly White (83%)
- Race & ethnicity
- White 83% Asian 6% Hispanic / Latino 4% Two or more races 4% Black 4%
- Common ancestry
- Italian 4% Slovak 3% Serbian 3%
- Foreign-born
- 10% · Canada, China, Vietnam
- Languages at home
- 86% English-only · Spanish 5% Other Indo-European 3% Other Asian/Pacific 1%
Political lean MEDSL · Roanoke
- 2024 margin
- Strong R (+22.5) · D 38.2% · R 60.7% · Other 1.1%
- 2008→2024 swing
- -1.4pp toward R · 2008: -21.1pp · 2024: -22.5pp
- All cycles
- 2024: R+22.5 2020: R+21.8 2016: R+28.1 2012: R+25.6 2008: R+21.1
Not yet ingested
- Civics
- —
Market trends
- HPI YoY
- ▼ -266.18%
- Current HPI
- 176.0558
- Rent YoY
- ▲ 2.88%
- Metro
- Roanoke, VA
- State GDP YoY
- ▲ 2.40%
- F500 in state
- 50
Industry mix (Fortune 500 HQ in VA)
| Industry | F500 HQs | Revenue |
|---|---|---|
| Aerospace / Defense | 4 | $236B |
|
||
| Technology / Defense | 3 | $32B |
|
||
| Financial Services | 2 | $176B |
|
||
| Utilities | 2 | $27B |
|
||
| Insurance | 2 | $25B |
|
||
| Technology | 2 | $15B |
|
||
Price history
+160.9% since first listed8 events — show timeline
- 2026-04-23 Pending — MLSRV
- 2026-04-17 Listed $299,950 MLSRV
- 2006-05-26 Sold (MLS) $192,500 MLSRV
- 2006-05-01 Sold (Public Records) $192,500 Public Records
- 2006-04-07 Listed $192,500 MLSRV
- 2001-03-08 Sold (MLS) $114,000 MLSRV
- 2001-03-01 Sold (Public Records) $114,000 Public Records
- 2001-01-29 Listed $114,950 MLSRV
Property tax history
+2.8%/yrLatest (2025): $2,451 · +6.7% YoY. Source: county tax records.
Cash-flow waterfall
monthlySold comps — $/sqft
last 12 mo · ≤1 miLoading sold comps…