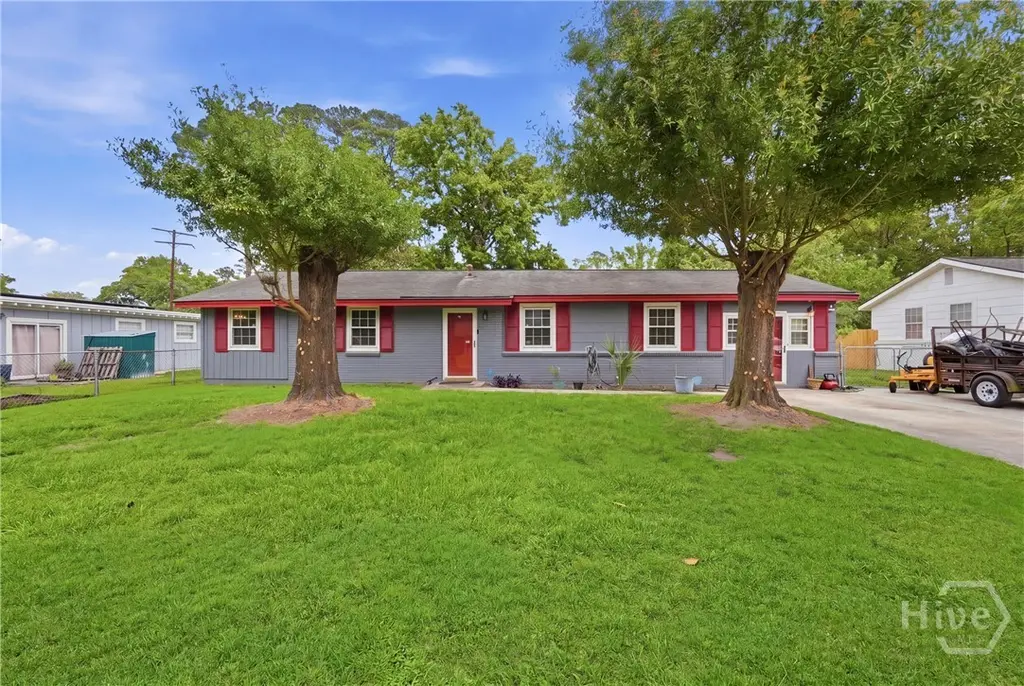
5806 Betty Dr · Savannah, GA
Flood risk 4/10 · Minor
- FEMA flood zone
- X (shaded)
- Chance of flooding over 30 yrs
- 0.13%
- Est. flood insurance / yr
- $507 – $1,088
Fire risk 3/10 · Minor
- Est. fire insurance / yr
- $963 – $1,789
Heat risk 10/10 · Severe
- Hot days now (above 106°F)
- 7 days/yr
- Hot days in 30 yrs
- 18 days/yr
Wind risk 9/10 · Severe
- Chance of severe wind over 30 yrs
- 99.0%
Air-quality risk 2/10 · Minimal
- Unhealthy air days now
- 2 days/yr
- Unhealthy air days in 30 yrs
- 2 days/yr
Risk factors via First Street. Map © Google.
Why this score? — see what drove the C- grade
The composite is a weighted blend of 9 inputs, each scored 0–100. Each bar is that input's sub-score; the figure is the points it added to the 100-point composite (weight × sub-score).
- Cash flow +17.6/30.0
- ARV discount +13.5/15.0
- DSCR +5.5/10.0
- Livability +4.3/5.0
- 1% rule +3.9/10.0
- Rent growth +2.5/5.0
- Condition / age +2.5/5.0
- Schools +2.0/10.0
- Appreciation +0.0/10.0
$259,900
🖨 Deal sheet 📄 Offer letter ✓ Due diligence
Listing remarks
Welcome to this spacious and well-maintained Southside Savannah home offering comfort, character, and strong value potential. This 3-bedroom, 2-bath residence features approximately 2,066 square feet of living space, providing plenty of room for both everyday living and entertaining. Built in 1958, this classic ranch-style home sits on a large lot and offers a functional layout with great natural light throughout. The home includes a spacious living area, well-sized bedrooms, and a layout that allows for easy customization or updates to match your personal style. Located in an established neighborhood on Savannah’s Southside, this property offers convenient access to shopping, dining,
Key facts
- Great natural light
- Move-in ready home
- Large lot
Tags
Property features AI
Exterior
- Utilities: Public water; Public sewer
- Home design: Single-family residence; One-story home
- Construction: Frame construction
- Exterior features: Underground utilities; Public sewer available
Interior
- Bathrooms: 2 full bathrooms
- Heating & cooling: Forced air heating (natural gas); Heat pump cooling (electric)
- Interior features: Electric water heater
- Laundry & utility: Laundry located in the kitchen
Neighborhood map
What this means for you Summary
Snapshot
- This is a 3-bed/2.0-bath single-family listed at $260k.
Deal economics
- At list price, monthly cash flow is $205 ($2k/yr) — positive.
- The deal already cash-flows at list — no discount required.
- To meet the 1% rule (rent ≥ 1% of price), the offer needs to be $230k (11.3% below list).
- Recommended offer: $230k (11.3% below list) — sets the bar for 1% rule.
- Cap rate 7.2% vs local median 4.0% in Savannah — top-decile yield for the area; either an underpriced asset or a hidden risk that comps aren't pricing in. Stress-test before assuming the spread holds.
Location & tenants
- Location reads 86/100 on livability (#1 in GA, #397 nationally) — a professional / high-income tenant draw. Strengths: crime A+, amenities A+, commute A+; Watch: employment D, schools F.
- Savannah-Chatham County (urban): math 20% / reading 26% proficiency, ranked #134 of 174 in GA (top 77%) — low school quality limits family demand, transient renter base, plan for 1-2y turnover.
- Market conditions: Rents flat; 176 active listings in the ZIP; 11 comparable units currently listed for rent nearby; rentals at typical pace (median 23d on market — plan ~3-4 weeks tenant-placement turnaround); 2,694 units permitted in Chatham County in 2024 (973 in 5+ unit buildings).
- This rent runs 41% of the median local income ($67k/yr) — at the standard rent-burdened threshold; future hikes will face affordability resistance.
Forward outlook
- Local home prices are declining (-3.0%/yr); year-one equity from $2k of loan paydown is wiped out by about $8k of value loss. Plan a longer hold.
- Chatham County population projected at +33% by 2050 — long-run rental-demand tailwind backs the buy-and-hold thesis.
Negotiation context
- It's been on market 30 days — a 2% lower offer ($256k) is reasonable based on typical stale-listing flexibility.
- 6 sale attempts since 14y ago with the ask held roughly flat each time — persistent listings suggest the price (not the market) is what's stuck; bring a comps-based counter.
- Current owner paid $118k; list at $260k implies a 120% gain — meaningful room to come down on a strong offer.
Risks & watch-outs
- Watch-outs: built in 1958 — expect roof / HVAC / electrical / plumbing capex.
- Climate carrying-cost: severe wind risk, 99% chance of damaging wind over 30y; extreme-heat days projected 7→18/yr by 2055 (HVAC capex compounding) — expect insurance premiums to compound above CPI over the hold.
Questions for the listing agent
- Built in 1958 — when were the roof, HVAC, electrical panel, plumbing, and water heater last replaced?
- Is there a deadline driving the sale (1031 exchange, divorce, estate, relocation)? That informs how much negotiation room exists.
- Schools are F-rated, which usually means shorter tenancies and higher turnover. Who's the typical renter profile here, and what's been the actual vacancy rate?
- What's the average days-on-market for RENTAL listings here right now (not sales)? A rising rental-DOM trend means longer vacancies and softer asking-rent achievability than the comps imply.
- What's the recent tenant-quality profile in this submarket — average credit score on applications, eviction rate, late-payment / NSF rate, and stable-employment percentage? A property-management company in the area should have these aggregated.
- How much new for-sale + rental construction is in the pipeline within 1–3 miles? Heavy new supply typically softens prices + rents 12–24 months out; constrained supply supports both.
Investment metrics
- 1% rule
- 0.89% ✗
- Cap rate
- 7.24%
- Cash-on-cash
- 3.38%
- DSCR
- 1.15
- GRM
- 9.4
CMA / ARV
- ARV (median comp)
- $299,899
- List price
- $259,900
- Delta
- -13.34%
- Verdict
- UNDERPRICED
- Comps
- 20 within 1.0 mi
Show comp detail 12 sales within ~0.75 mi
| Address | Dist | Beds/Ba | Sqft | Sold | Price | $/sf | Match |
|---|---|---|---|---|---|---|---|
| 5626 Lafitte Dr | 0.21mi | 3/2.0 | 1,659 (-15%) | 5mo | $247,500 | $149 | 62 |
| 5 Sidney Dr | 0.38mi | 3/2.0 | 1,700 (-13%) | 5mo | $340,000 | $200 | 57 |
| 2418 Bonaire Dr | 0.19mi | 3/2.0 | 1,662 (-15%) | 12mo | $365,000 | $220 | 56 |
| 1940 Speir St | 0.69mi | 4/2.0 (+1) | 1,920 (-1%) | 7mo | $350,000 | $182 | 55 |
| 7 Windfield Ct | 0.25mi | 3/2.5 | 2,236 (+15%) | 8mo | $525,000 | $235 | 55 |
| 2006 Cokesbury Dr | 0.68mi | 3/2.5 | 1,839 (-6%) | 3mo | $375,000 | $204 | 55 |
| 4 Brookview Dr | 0.33mi | 3/2.0 | 1,662 (-15%) | 7mo | $223,500 | $134 | 54 |
| 2020 Cokesbury Dr | 0.63mi | 4/2.0 (+1) | 1,991 (+2%) | 14mo | $461,000 | $232 | 50 |
| 1906 Bona Bella Ave | 0.58mi | 4/2.0 (+1) | 2,070 (+6%) | 15mo | $425,000 | $205 | 45 |
| 1 Broadmoor Cir | 0.66mi | 3/2.0 | 1,748 (-10%) | 12mo | $425,900 | $244 | 42 |
| 2018 Speir St | 0.61mi | 3/2.0 | 1,730 (-11%) | 15mo | $443,500 | $256 | 40 |
| 55 Saint Johns Ave | 0.67mi | 4/2.0 (+1) | 1,659 (-15%) | 9mo | $320,000 | $193 | 32 |
Match score weights: distance 35% · size 25% · config 20% · recency 20%. Top-matched comps best support the ARV.
Projected returns pro-forma
-3.0% appreciation · 0.04% rent growth · sell at horizon
- IRR
- -14.1%
- Equity multiple
- 0.51×
- Total profit
- $-35,806
- Equity at exit
- $38,752
- IRR
- -10.4%
- Equity multiple
- 0.44×
- Total profit
- $-40,466
- Equity at exit
- $22,471
Cash invested: $72,772 (down + closing). Projections, not guarantees.
Landlord ↔ Tenant lean methodology
- Overall (STATE)
- 90 Strongly Landlord-Friendly
- State Georgia
- 90 Strongly Landlord-Friendly · R+3
- County
- — inherits STATE
- City
- — inherits STATE
ZIP-level market 31406
- Rents YoY
- 0.0%
- Active inventory
- 176
- Price-to-rent
- 9.4×
Monthly cashflow live
- Estimated rent
- $2,305 high interval (Pro) →
- Mortgage (P&I)
- −$1,363
- Tax from tax record
- −$144 /mo · $1,733/yr
- Insurance
- −$108
- HOA
- −$0
- Vacancy / Maint / Mgmt
- −$484
- Net cashflow
- $205
Break-even live
UW: 25.0% down · 7.5% · 30yr · 1.5% tax · 5.0% vac · 8.0% maint · 8.0% mgmt
Financing live
Cash to close
- Down payment
- $64,975
- Closing costs
- $7,797
- Reserves months
- —
- Total cash needed
- —
Loan-product check · same deal, 3 products live
Conventional
25% down · 7.5% · 30yr
- Down + closing
- —
- Monthly P&I
- —
- Monthly cashflow
- —
- DSCR
- —
- Eligible?
- —
Personal DTI + credit; lowest rate.
DSCR
20% down · 8.5% · 30yr
- Down + closing
- —
- Monthly P&I
- —
- Monthly cashflow
- —
- DSCR
- —
- Eligible?
- —
No personal income docs; deal must DSCR.
Hard money
10% down · 12.0% · 12mo
- Down + closing
- —
- Monthly P&I
- —
- Monthly cashflow
- —
- DSCR
- —
- Eligible?
- —
Short-term bridge; refi at stabilization.
Rent comps 11 comps
| Address | Beds | Baths | Sqft | Rent | $/sqft | DOM | Units | Dist |
|---|---|---|---|---|---|---|---|---|
| 5908 Fairview Ave Savannah, GA | 3.0 | 2.0 | 1625 | $1,950 | $1.20 | 43d | 1 | 0.10mi |
| 2222 Bacon Park Dr Savannah, GA | 4.0 | 2.0 | 2246 | $2,995 | $1.33 | 43d | 1 | 0.18mi |
| 5505 Betty Dr Savannah, GA | 3.0 | 2.0 | 1550 | $1,859 | $1.20 | 43d | 1 | 0.36mi |
| 28 Gerald Dr Savannah, GA | 4.0 | 2.0 | 1519 | $2,650 | $1.74 | 21d | 1 | 0.39mi |
| 5 Sidney Dr Savannah, GA | 3.0 | 2.0 | 1700 | $2,600 | $1.53 | 23d | 1 | 0.39mi |
| 2233 E De Renne Ave Savannah, GA | 4.0 | 2.0 | 1476 | $2,400 | $1.63 | 23d | 1 | 0.49mi |
| 2619 Livingston Ave Savannah, GA | 3.0 | 1.5 | 1300 | $1,555 | $1.20 | 23d | 1 | 0.52mi |
| 5020 La Roche Ave Savannah, GA | 3.0 | 2.5 | 2170 | $3,350 | $1.54 | 13d | 1 | 0.72mi |
| 2337 Shirley Dr Savannah, GA | 3.0 | 2.0 | 1850 | $2,600 | $1.41 | 23d | 1 | 1.03mi |
| 24 N Parkwood Dr Savannah, GA | 3.0 | 2.0 | 1277 | $2,200 | $1.72 | 13d | 1 | 1.30mi |
| 7331 Leghorn St Savannah, GA | 3.0 | 2.0 | 1588 | $2,190 | $1.38 | 23d | 1 | 1.35mi |
Listing history 20 events
-
2026-06-18days on market $259,900 Active 30 DOM
-
2026-06-17days on market $259,900 Active 29 DOM
-
2026-06-16days on market $259,900 Active 28 DOM
-
2026-06-15days on market $259,900 Active 27 DOM
-
2026-06-14days on market $259,900 Active 25 DOM
-
2026-06-13days on market $259,900 Active 24 DOM
-
2026-06-10days on market $259,900 Active 22 DOM
-
2026-06-09days on market $259,900 Active 21 DOM
-
2026-06-08pricestatusdays on market $259,900 Active 20 DOM
-
2026-05-06$265,000 Active 956-char remark
-
2014-12-11soldstatus $118,000
-
2014-09-03historical
-
2014-03-05$119,500
-
2013-12-07historical
-
2013-02-07$119,500
-
2012-12-31historical
-
2012-07-06$129,900
-
2012-06-30historical
-
2012-01-13$129,900
-
1973-07-01soldstatus $18,500
ⓘ Source: listings_history table (triggers on properties + properties_extension) + one-shot
backfill from property_details.listing_events for pre-trigger history.
Tax reassessment forecast GA · Resets to sale price
- Current annual tax
- $1,733 · $144/mo
- Projected year-2 tax
- $2,391 · $199/mo
- Expected delta
- +$658/yr (+$55/mo · 38.0%)
ⓘ Screening estimate from a state-policy table — verify with the county assessor before closing.
Climate risk First Street
- Flood 4/10 Moderate FEMA zone X (shaded) · 13% chance over 30 yrs
- Wildfire 3/10 Moderate
- Heat 10/10 Extreme 7 d/yr ≥106°F today · 18 d/yr by 30 yrs out
- Wind 9/10 Extreme 99% chance of damaging wind over 30 yrs
- Air quality 2/10 Low 2 unhealthy d/yr today · 2 by 30 yrs out
Nearby sold comps map
Loading sold comps map…
Walkable amenities ~0.75 mi
Loading nearby amenities…
Taxation est. · year 1
- Rental income
- $27,654
- − Mortgage interest
- −$14,558
- − Property taxes
- −$1,733
- − Insurance
- −$1,300
- − Repairs & maintenance
- −$2,212
- − Management
- −$2,212
- − Depreciation
- −$7,561
- Taxable loss
- −$1,922
- Est. tax savings @ 24.0%
- +$461
- After-tax cash flow
- $2,920/yr
For passive investors: Depreciation is non-cash, so a rental often shows a tax loss while cash-flowing — sheltering income. Rental losses are passive: they offset passive income freely, and up to $25,000/yr can offset ordinary (W-2) income if you actively participate and your MAGI is under $100k (phasing out to $0 by $150k); unused losses carry forward. On sale, claimed depreciation is recaptured at up to 25%, and gains may owe capital-gains tax (a 1031 exchange can defer both). Figures are a year-1 estimate at your 24.0% rate — not tax advice; consult a CPA.
Schools (NCES district)
- District
- Savannah-Chatham County
- NCES district ID
- 1301020
- Math proficiency
- 20% ▼ -11.00%
- Reading proficiency
- 26% ▼ -5.00%
- Median HH income
- $47,443
- Composite
- 20.14/100
- National rank
- #8639
- State rank
- #134 of 174 in GA
Livability — Savannah
- Score
- 86/100
- State rank
- #1
- US rank
- #397
Category grades
Schools grade is shown separately in the Schools card above.
Census & demographics
- Census place
- Savannah, GA
- County
- Chatham County · 271,602 people
- City population
- 216,564
- Metro
- Savannah, GA
- Population (ZIP)
- 34,904
- Household income
- $67,120
- Rent vs Own
- Severe rent burden
- 1453.0
Population outlook (Chatham County) Hauer SSP2
- Today (2025)
- 332,584 people
- By 2030
- 355,508 · +6.9%
- By 2040
- 400,030 · +20.3%
- By 2050
- 443,019 · +33.2%
- By 2075
- 534,579 · +60.7%
- By 2100
- 583,863 · +75.6%
Race, ethnicity, and origin ACS 2023
- Neighborhood character
- Diverse neighborhood (Simpson 0.63)
- Race & ethnicity
- White 47% Black 38% Hispanic / Latino 7% Two or more races 6% Asian 4%
- Hispanic origin (detail)
- Mexican 2% Puerto Rican 2%
- Common ancestry
- Slovak 3% Lithuanian 1% Serbian 1%
- Foreign-born
- 7% · Canada, China, Vietnam
- Languages at home
- 91% English-only · Spanish 4% Chinese 2% Other Asian/Pacific 1%
Political lean MEDSL · Chatham
- 2024 margin
- D (+18.0) · D 58.6% · R 40.6%
- 2008→2024 swing
- +3.6pp toward D · 2008: 14.4pp · 2024: 18.0pp
- All cycles
- 2024: D+18.0 2020: D+18.8 2016: D+14.5 2012: D+12.0 2008: D+14.4
Not yet ingested
- Civics
- —
Market trends
- HPI YoY
- ▼ -240.18%
- Current HPI
- 280.3587
- Rent YoY
- ▬ 0.04%
- Metro
- Savannah, GA
- State GDP YoY
- ▲ 2.66%
- F500 in state
- 28
Industry mix (Fortune 500 HQ in GA)
| Industry | F500 HQs | Revenue |
|---|---|---|
| Paper / Packaging | 2 | $29B |
|
||
| Retail | 1 | $160B |
|
||
| Transportation / Logistics | 1 | $91B |
|
||
| Airlines | 1 | $62B |
|
||
| Consumer Goods | 1 | $47B |
|
||
| Utilities | 1 | $25B |
|
||
Price history
+1304.9% since first listed14 events — show timeline
- 2026-06-08 Price Changed $259,900 Hive MLS
- 2026-06-08 Relisted — Hive MLS
- 2026-05-28 Pending — Hive MLS
- 2026-05-06 Listed $265,000 Hive MLS
- 2014-12-11 Sold (Public Records) $118,000 Public Records
- 2014-09-03 Listing Removed — Hive MLS
- 2014-03-05 Listed $119,500 Hive MLS
- 2013-12-07 Listing Removed — Hive MLS
- 2013-02-07 Listed $119,500 Hive MLS
- 2012-12-31 Listing Removed — Hive MLS
- 2012-07-06 Listed $129,900 Hive MLS
- 2012-06-30 Listing Removed — Hive MLS
- 2012-01-13 Listed $129,900 Hive MLS
- 1973-07-01 Sold (Public Records) $18,500 Public Records
Property tax history
+21.1%/yrLatest (2025): $1,733 · +0.4% YoY. Source: county tax records.
Cash-flow waterfall
monthlySold comps — $/sqft
last 12 mo · ≤1 miLoading sold comps…